Copyright
©The Author(s) 2025.
World J Diabetes. May 15, 2025; 16(5): 101473
Published online May 15, 2025. doi: 10.4239/wjd.v16.i5.101473
Published online May 15, 2025. doi: 10.4239/wjd.v16.i5.101473
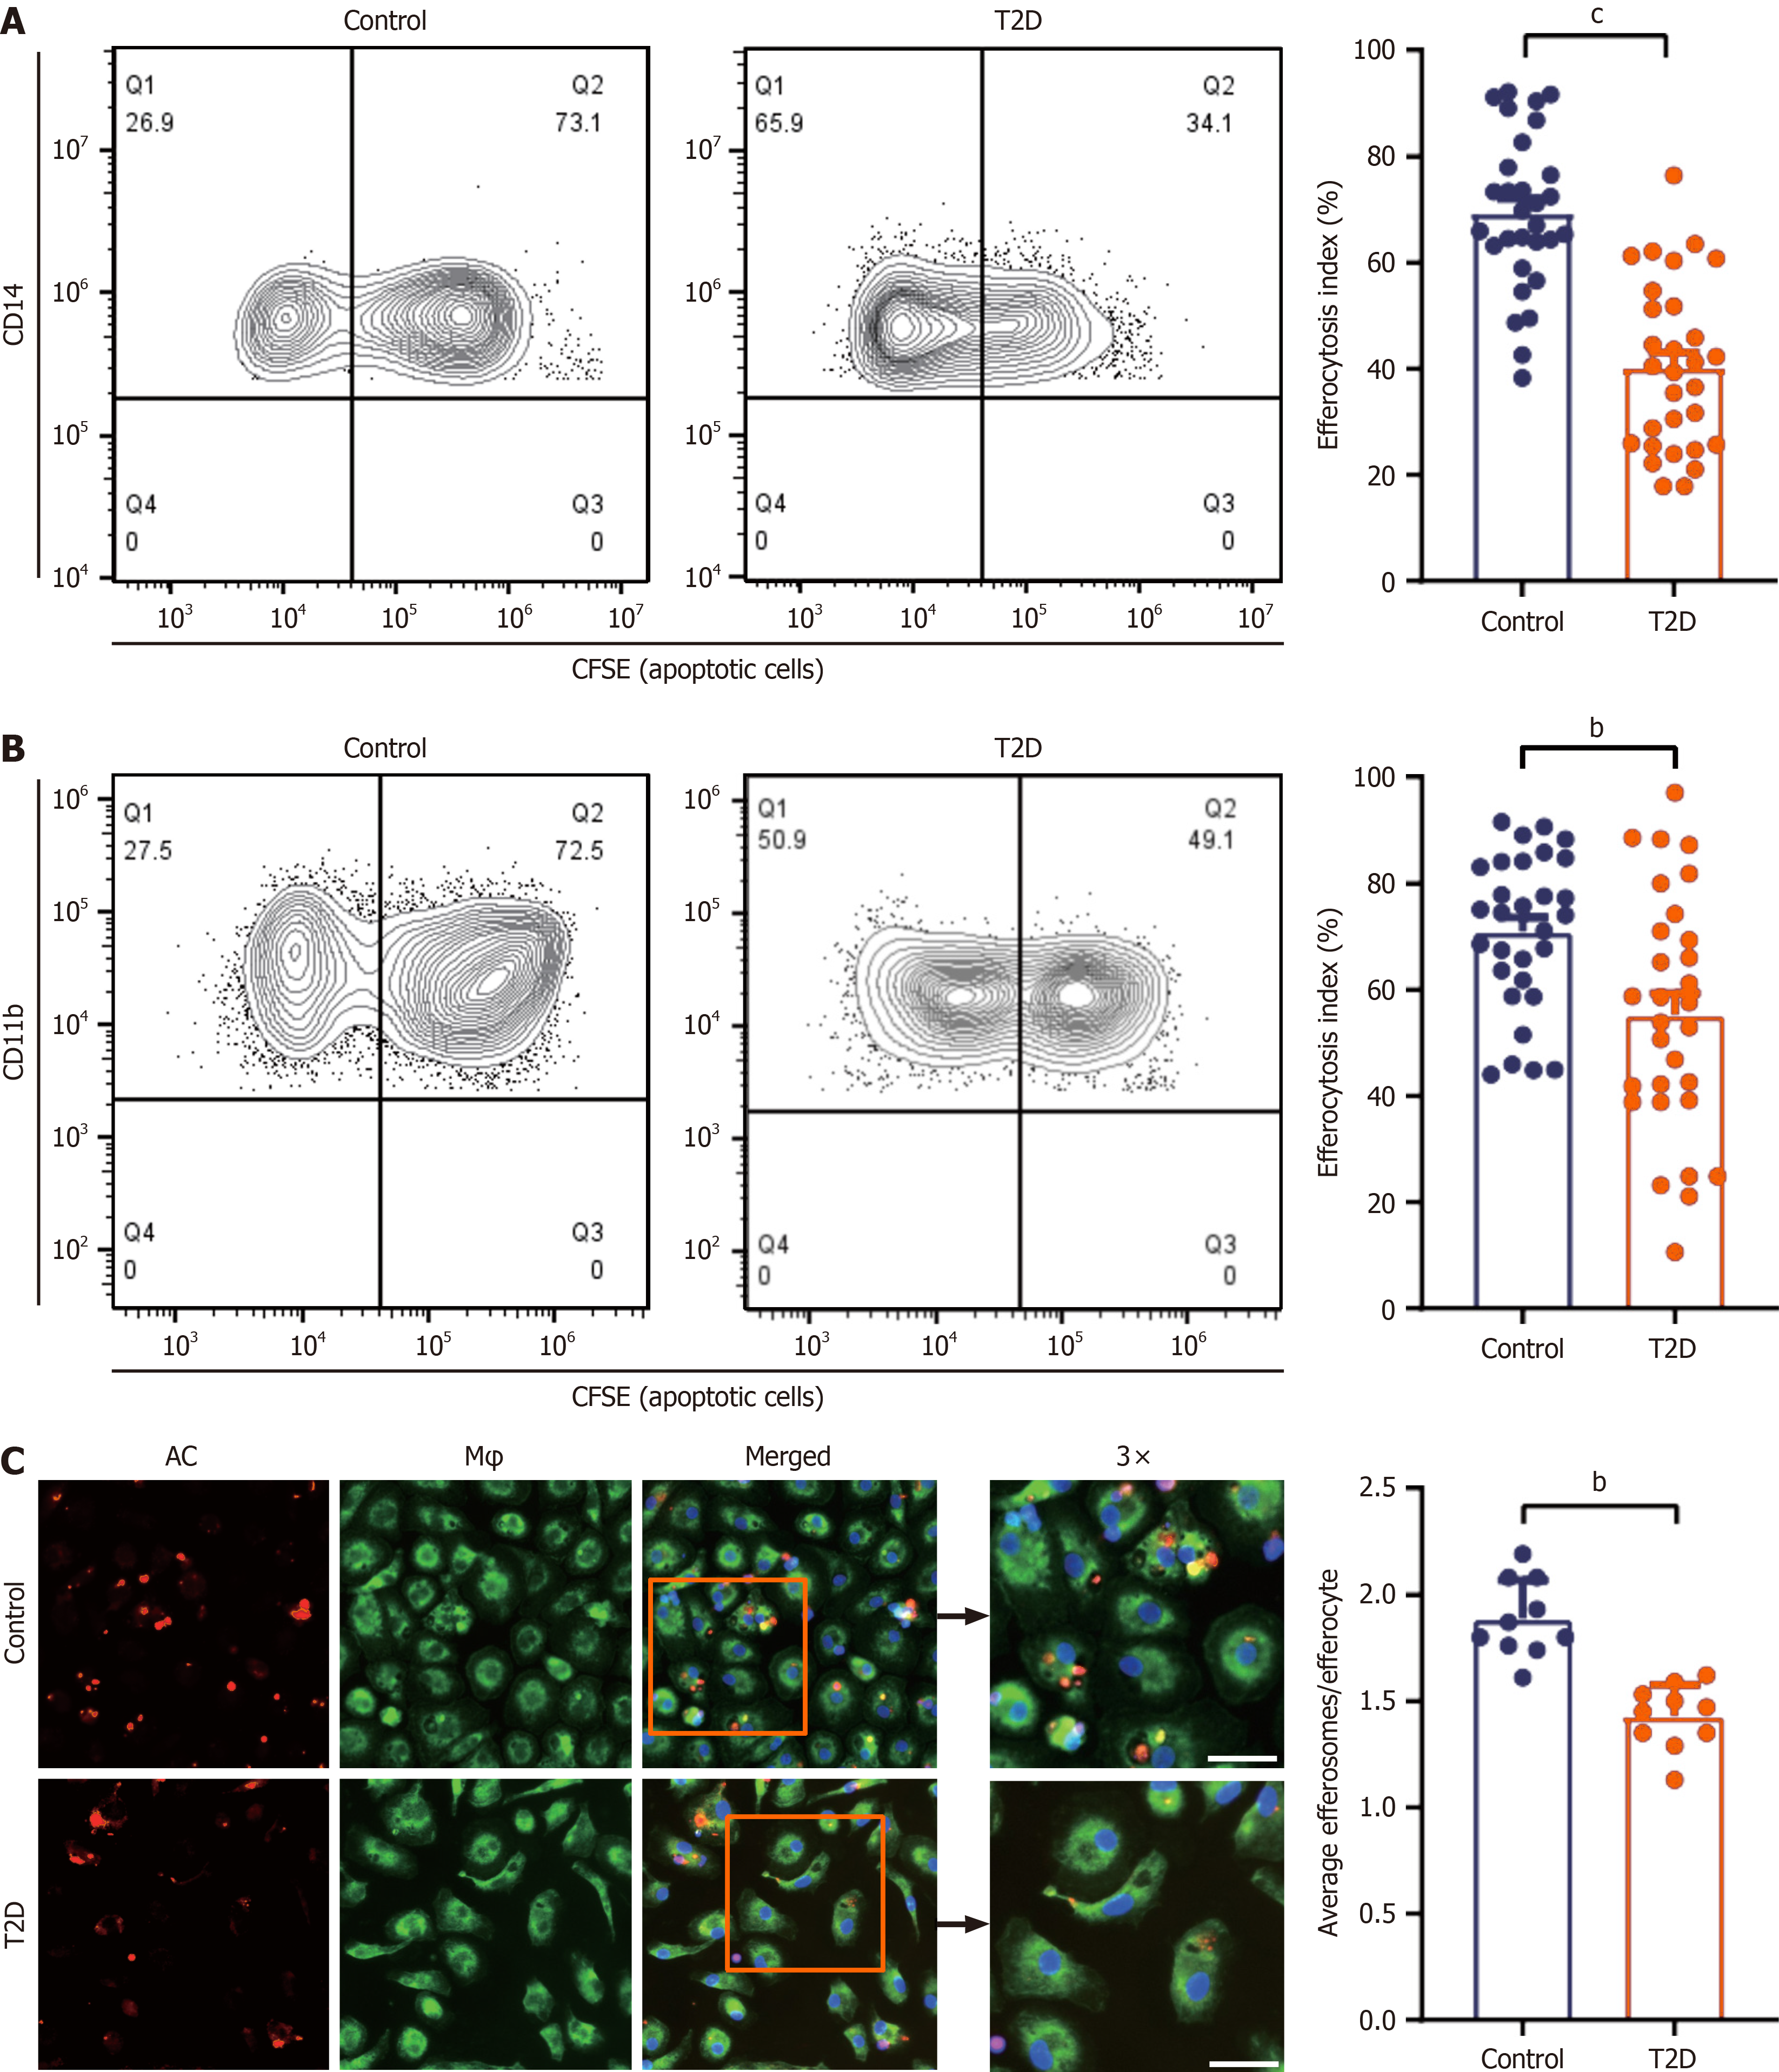
Figure 1 Impaired efferocytosis function of monocytes and monocyte-derived macrophages in type 2 diabetes patients.
A: Efferocytosis by monocytes in control subjects and type 2 diabetes patients determined by flow cytometry. The efferocytosis index was calculated as (number of CFSE+CD14+ monocytes/number of total CD14+ monocytes) × 100 (%). Data are presented as medians and quartiles or mean ± SD; B and C: Efferocytosis by monocyte-derived macrophages in control subjects and diabetic patients determined by flow cytometry or by immunofluorescence. The efferocytosis index was determined as (number of CFSE+CD11b+ monocytes/number of total CD11b+ monocytes) × 100 (%). The average number of efferosomes per efferocyte was calculated as the amount of efferocytosed apoptotic material per macrophage containing at least one bound or ingested apoptotic cell(s). Scale bar: 20 μm. The data are the mean ± SD. bP < 0.01 from paired t test (B) or unpaired t test (C), cP < 0.001 from the Wilcoxon matched pair test (for monocyte subsets) or paired t test (for the monocyte efferocytosis index). T2D: Type 2 diabetes.
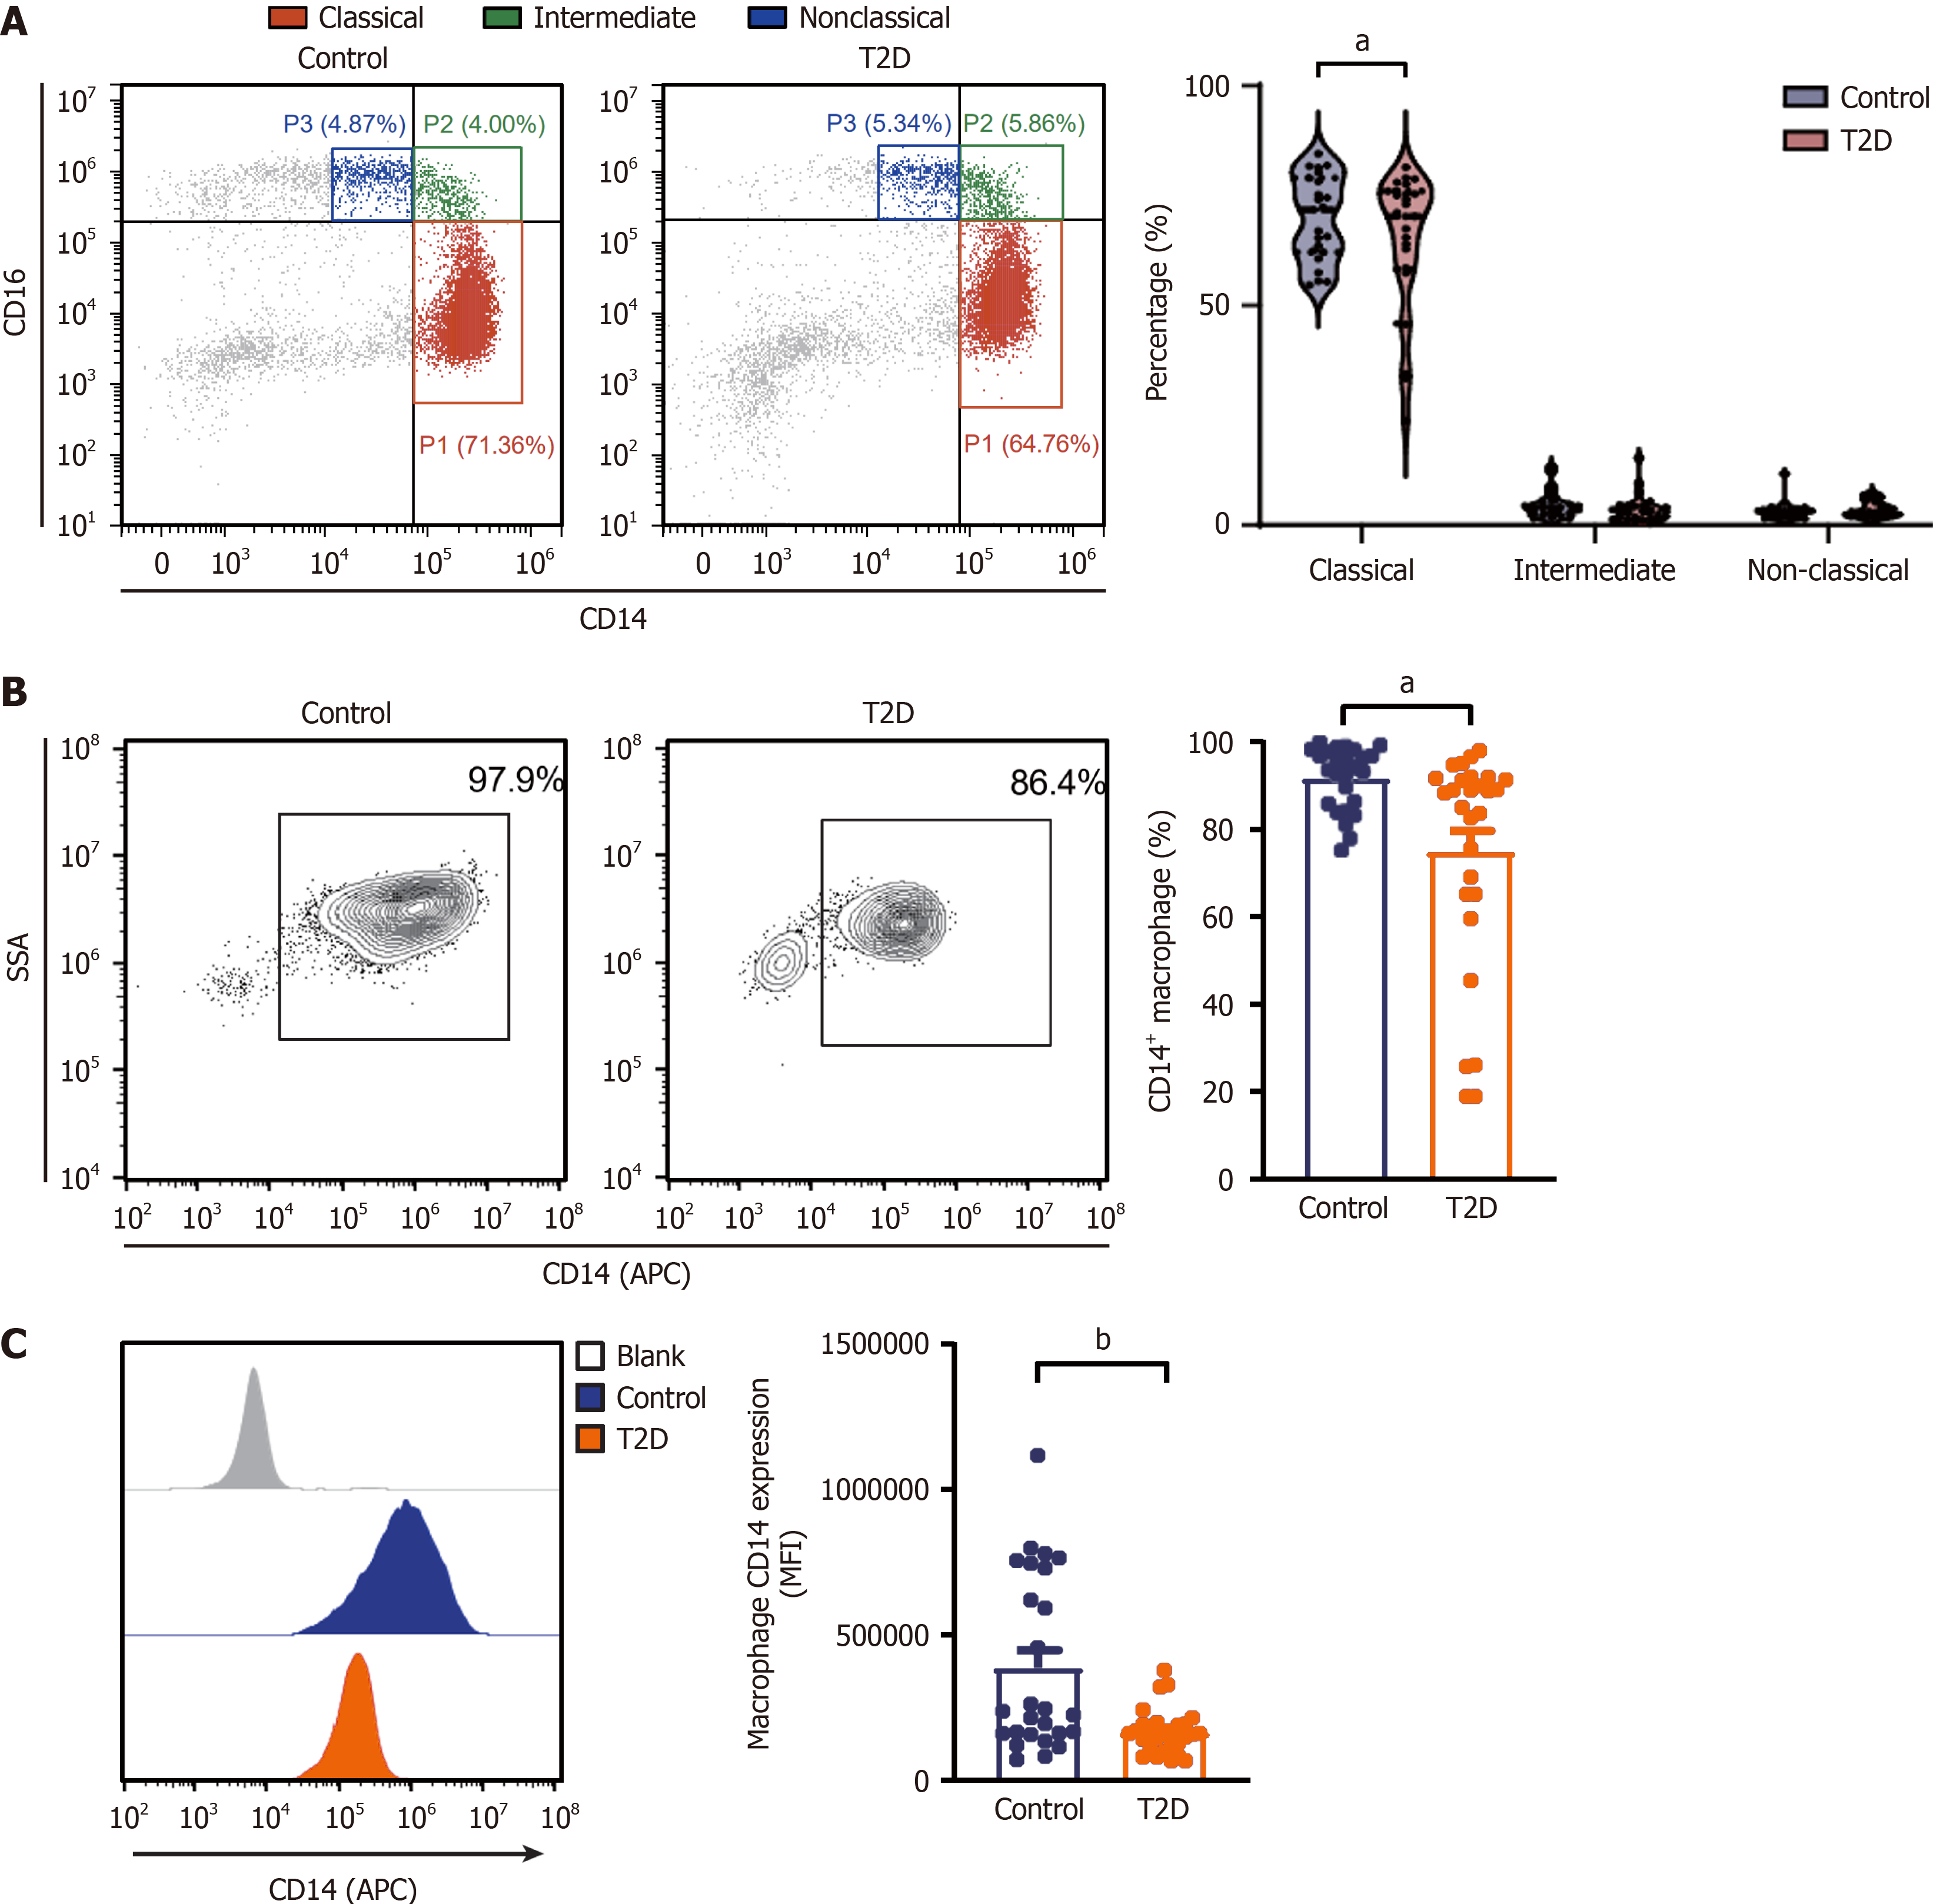
Figure 2 Percentage of classical monocytes and macrophage CD14 expression were decreased in type 2 diabetes patients.
A: Percentages of different monocyte subsets (classical, intermediate and nonclassical monocytes); B: The percentage of CD14+ macrophages in control subjects and diabetes patients was determined by flow cytometry; C: The median fluorescence intensity of CD14 in macrophages from control subjects and diabetes patients. The data are the mean ± SD. aP < 0.05, bP < 0.01 from paired t test. T2D: Type 2 diabetes; MFI: Median fluorescence intensity.
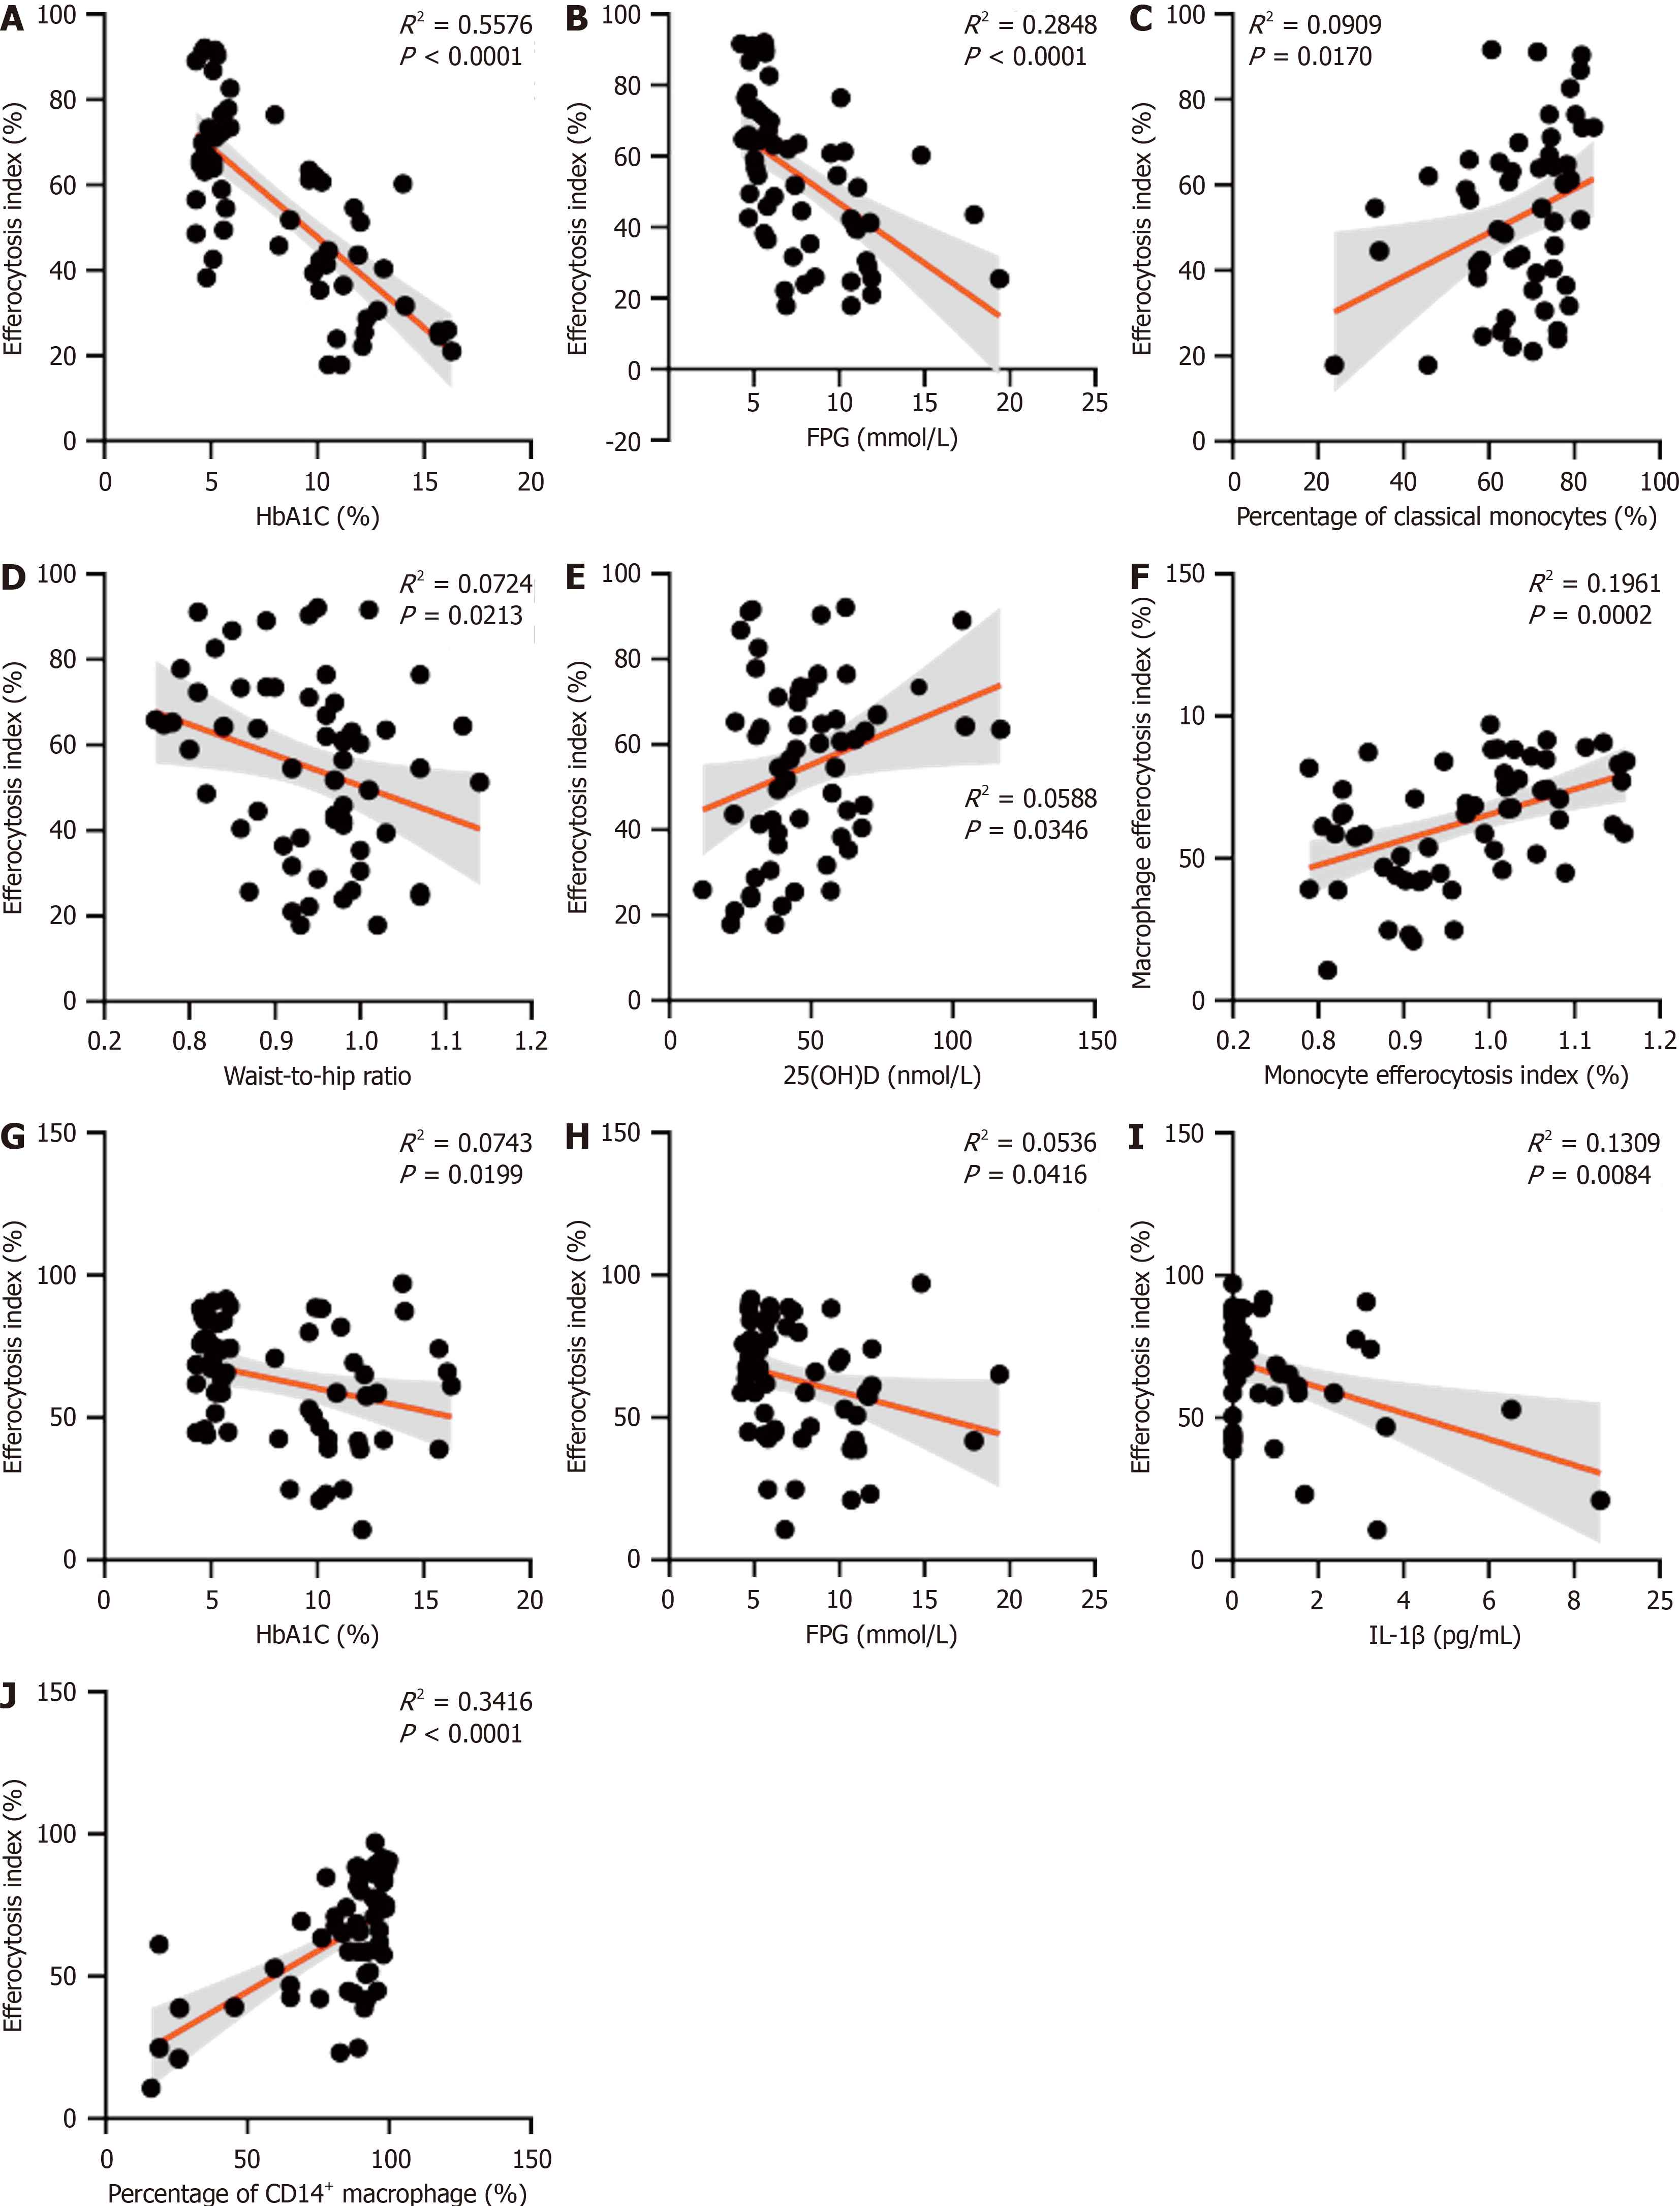
Figure 3 Parameters correlated with the efferocytosis index of monocytes and monocyte-derived macrophages in the total sample population.
A-E: Univariate regression analysis of the relationships between each variable and the efferocytosis indices of monocytes; F-J: Monocyte-derived macrophages in the total sample population. The regression line (black line) and corresponding 95%CI (gray area) are shown for each univariate regression analysis. FPG: Fasting plasma glucose.
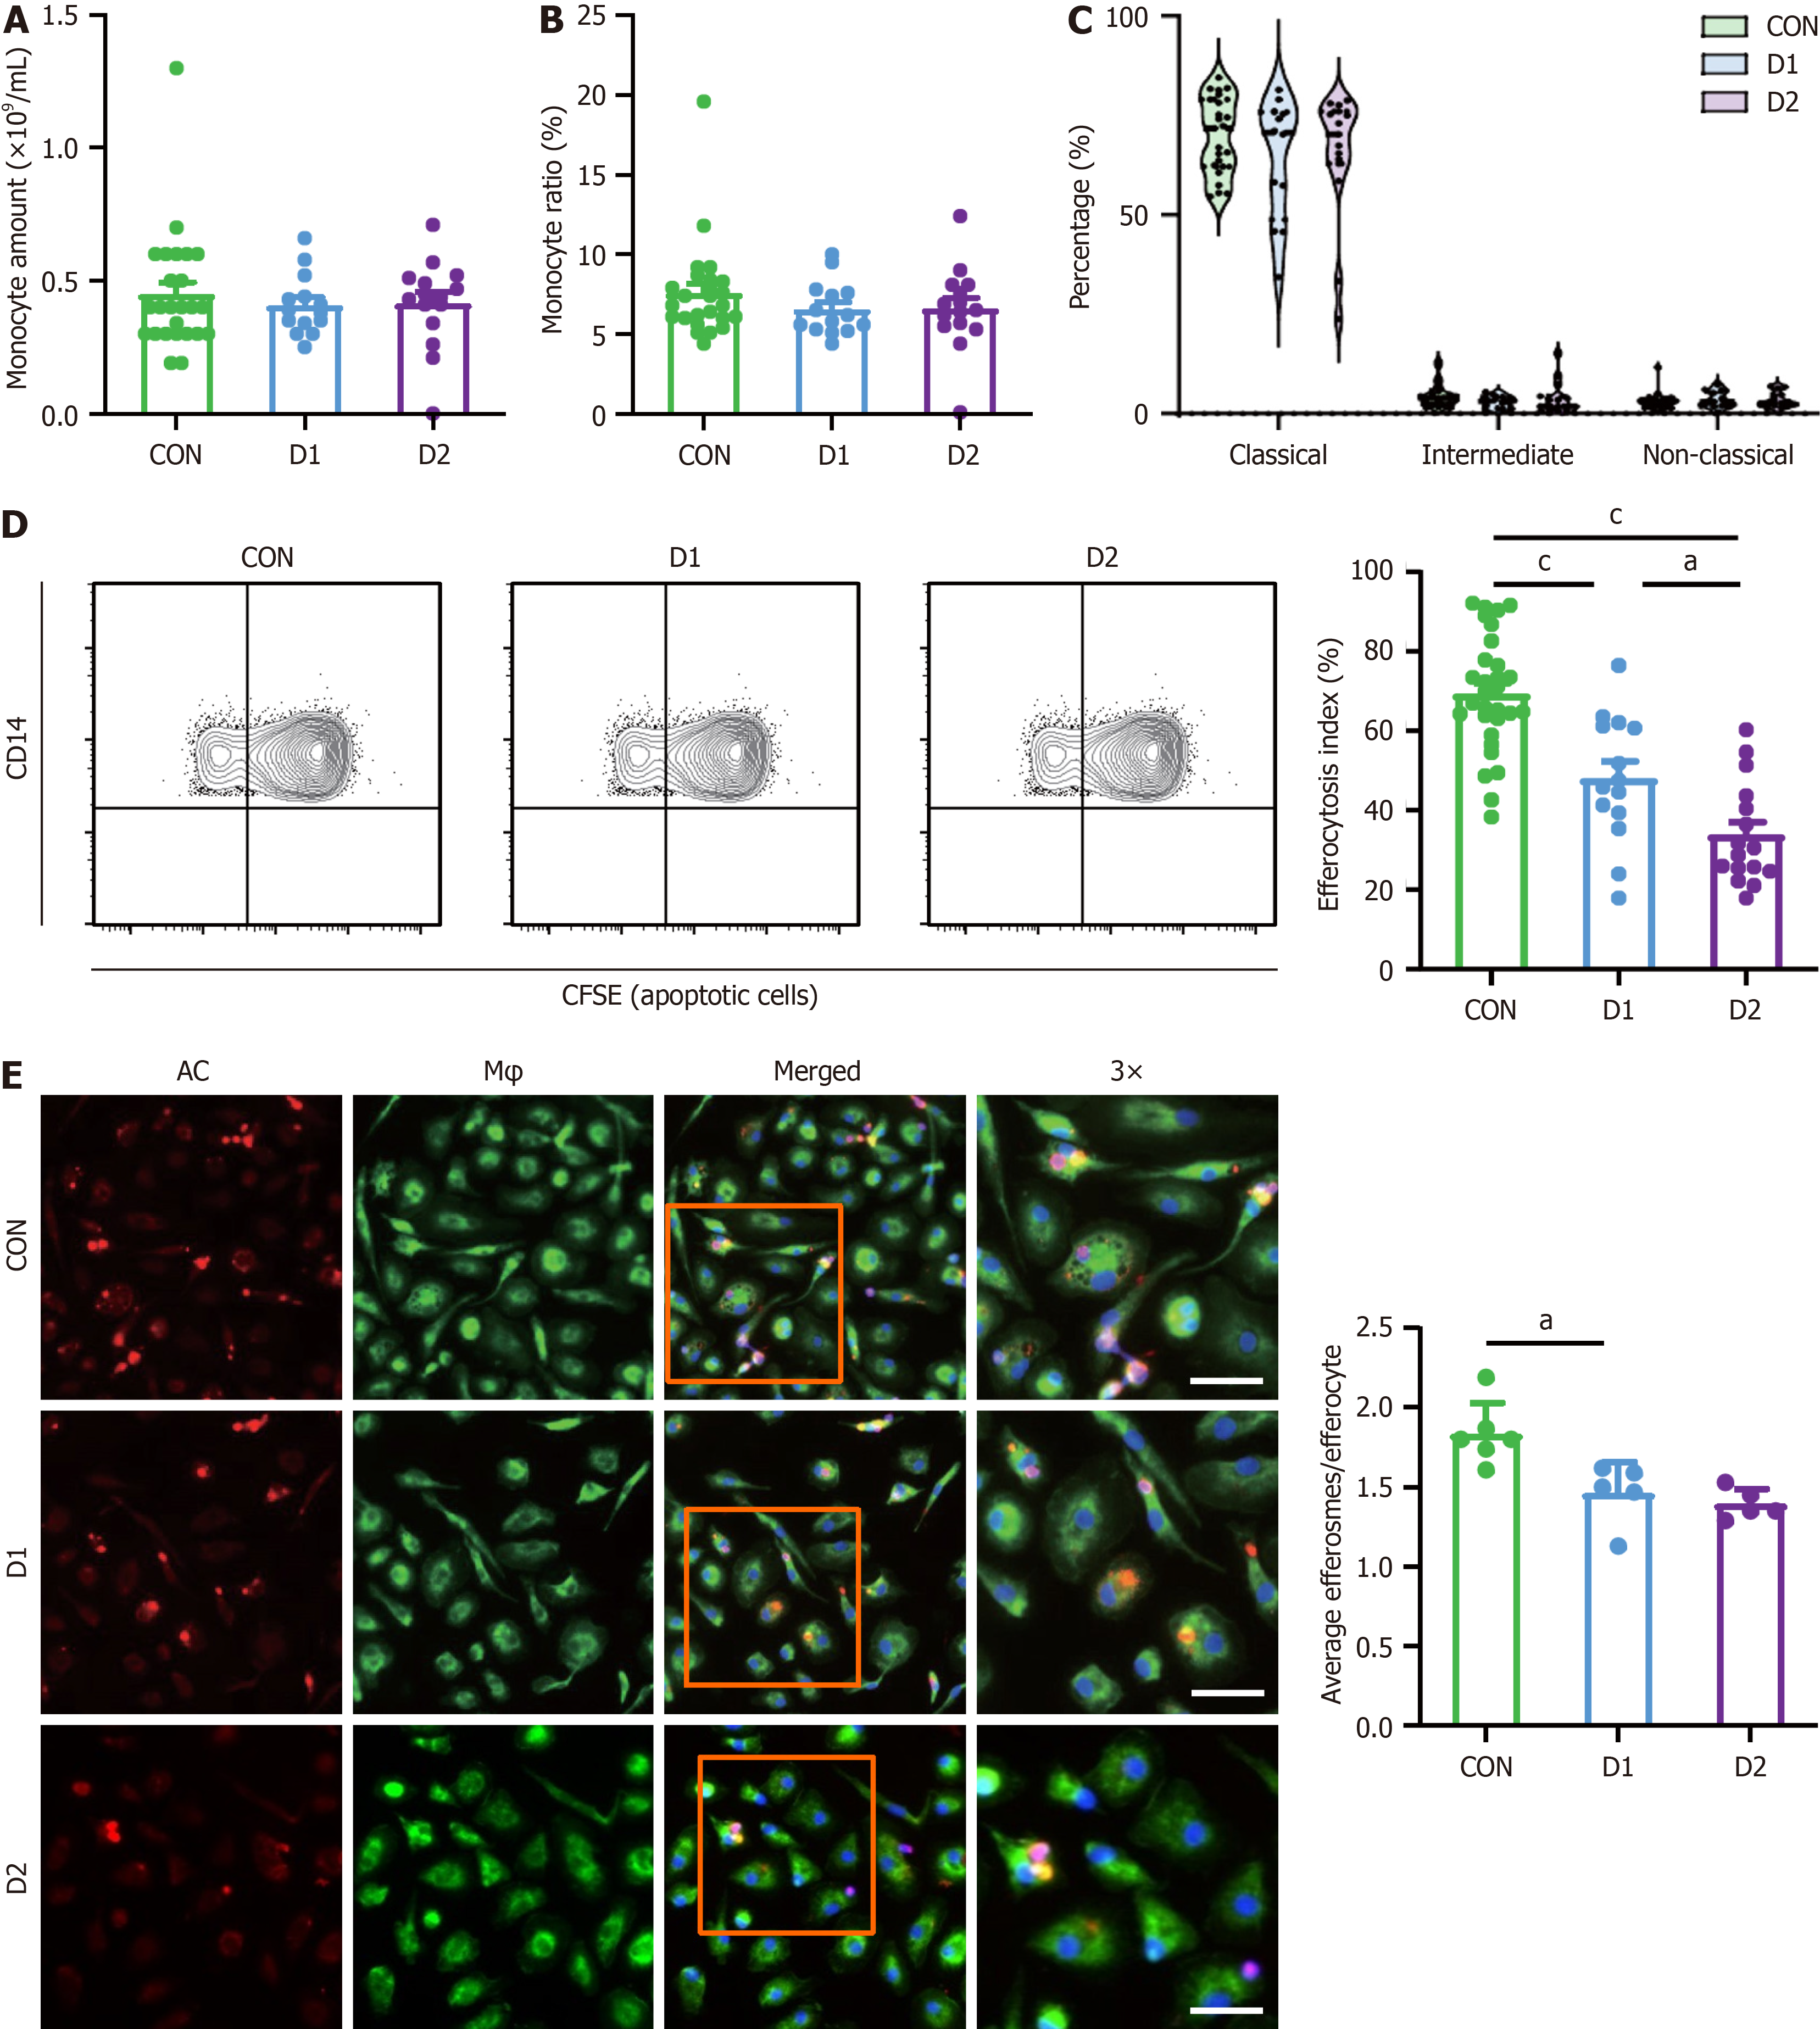
Figure 4 The monocyte efferocytosis index further decreased in the type 2 diabetes patients with glycosylated hemoglobin levels greater than 11.
0%. A and B: The number and percentage of monocytes, percentage of monocyte subsets; C-E: efferocytosis index of monocytes and monocyte-derived macrophages in healthy controls and in diabetes patients with glycosylated hemoglobin levels lower than 11.0% (D1) or greater than 11.0% (D2). Scale bar: 20 μm. aP < 0.05, cP < 0.001 from paired t test.
- Citation: Mao QY, Ran H, Hu QY, He SY, Lu Y, Li H, Chai YM, Chu ZY, Qian X, Ding W, Niu YX, Zhang HM, Li XY, Su Q. Impaired efferocytosis by monocytes and monocyte-derived macrophages in patients with poorly controlled type 2 diabetes. World J Diabetes 2025; 16(5): 101473
- URL: https://www.wjgnet.com/1948-9358/full/v16/i5/101473.htm
- DOI: https://dx.doi.org/10.4239/wjd.v16.i5.101473


