Copyright
©The Author(s) 2025.
World J Diabetes. May 15, 2025; 16(5): 101354
Published online May 15, 2025. doi: 10.4239/wjd.v16.i5.101354
Published online May 15, 2025. doi: 10.4239/wjd.v16.i5.101354
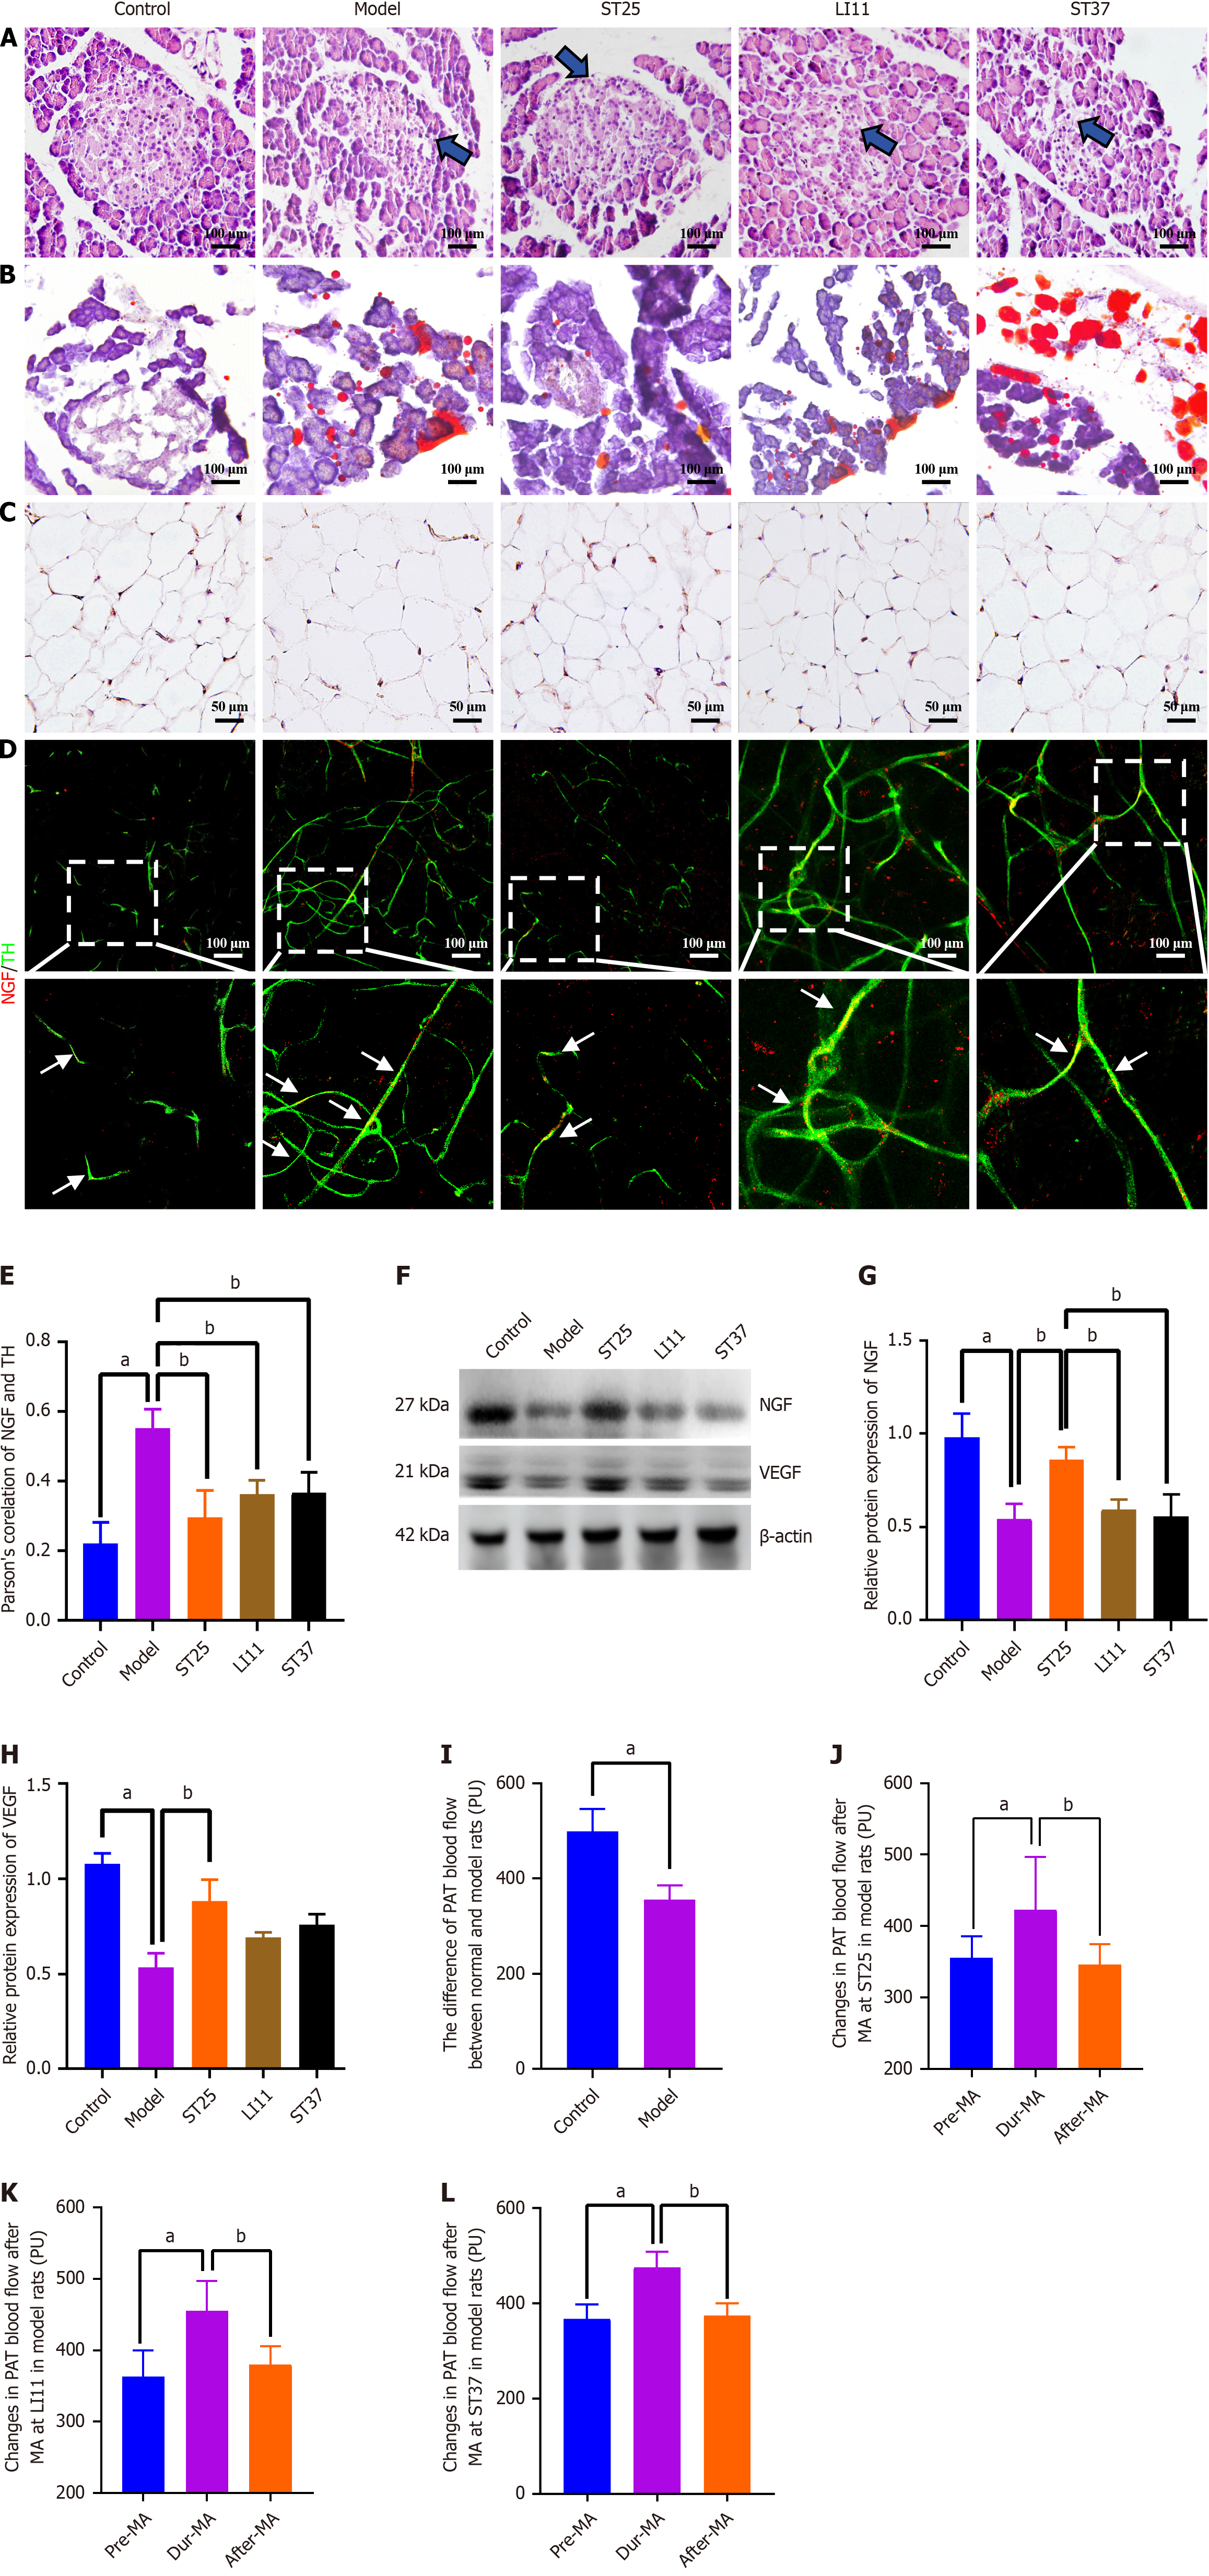
Figure 1 Electroacupuncture modulates the trophic influence of peripancreatic adipose tissue on the pancreatic intrinsic nervous system.
A: Histological alterations in pancreatic tissue and ectopic fat deposition in the pancreas across experimental groups (200 × magnification). Blue arrows indicate vacuolar-like changes; B: Comparative analysis of peripancreatic adipose tissue (PAT) blood perfusion between the control and model groups; C: Immunohistochemical staining for NGF in PAT under high magnification for the different groups (400 × magnification). Scale bar represents 50 μm; D: Illustrative immunofluorescence images showing co-expression of NGF and tyrosine hydroxylase (TH) in all groups (200 × magnification). Red fluorescence denotes NGF, while green fluorescence indicates TH. A uniform scale bar is applied to all groups; D: Pearson correlation analysis between NGF and TH expression (n = 5); E: Illustrative immunofluorescence images showing co-expression of NGF and TH in all groups (200 × magnification); F and G: Representative Western blot bands for NGF; F and H: Vascular endothelial growth factor (VEGF) in PAT. Vinculin served as a loading control; I-L: PAT blood flow changes during electroacupuncture stimulation at acupoints ST25, LI11, and ST37 in normal rats, respectively. aP < 0.05 compared to the normal control group; bP < 0.05 compared to the model or alternative treatment group. TH: Tyrosine hydroxylase; ST25: Tianshu acupoint; LI11: Quchi acupoint; ST37: Shangjuxu acupoint.
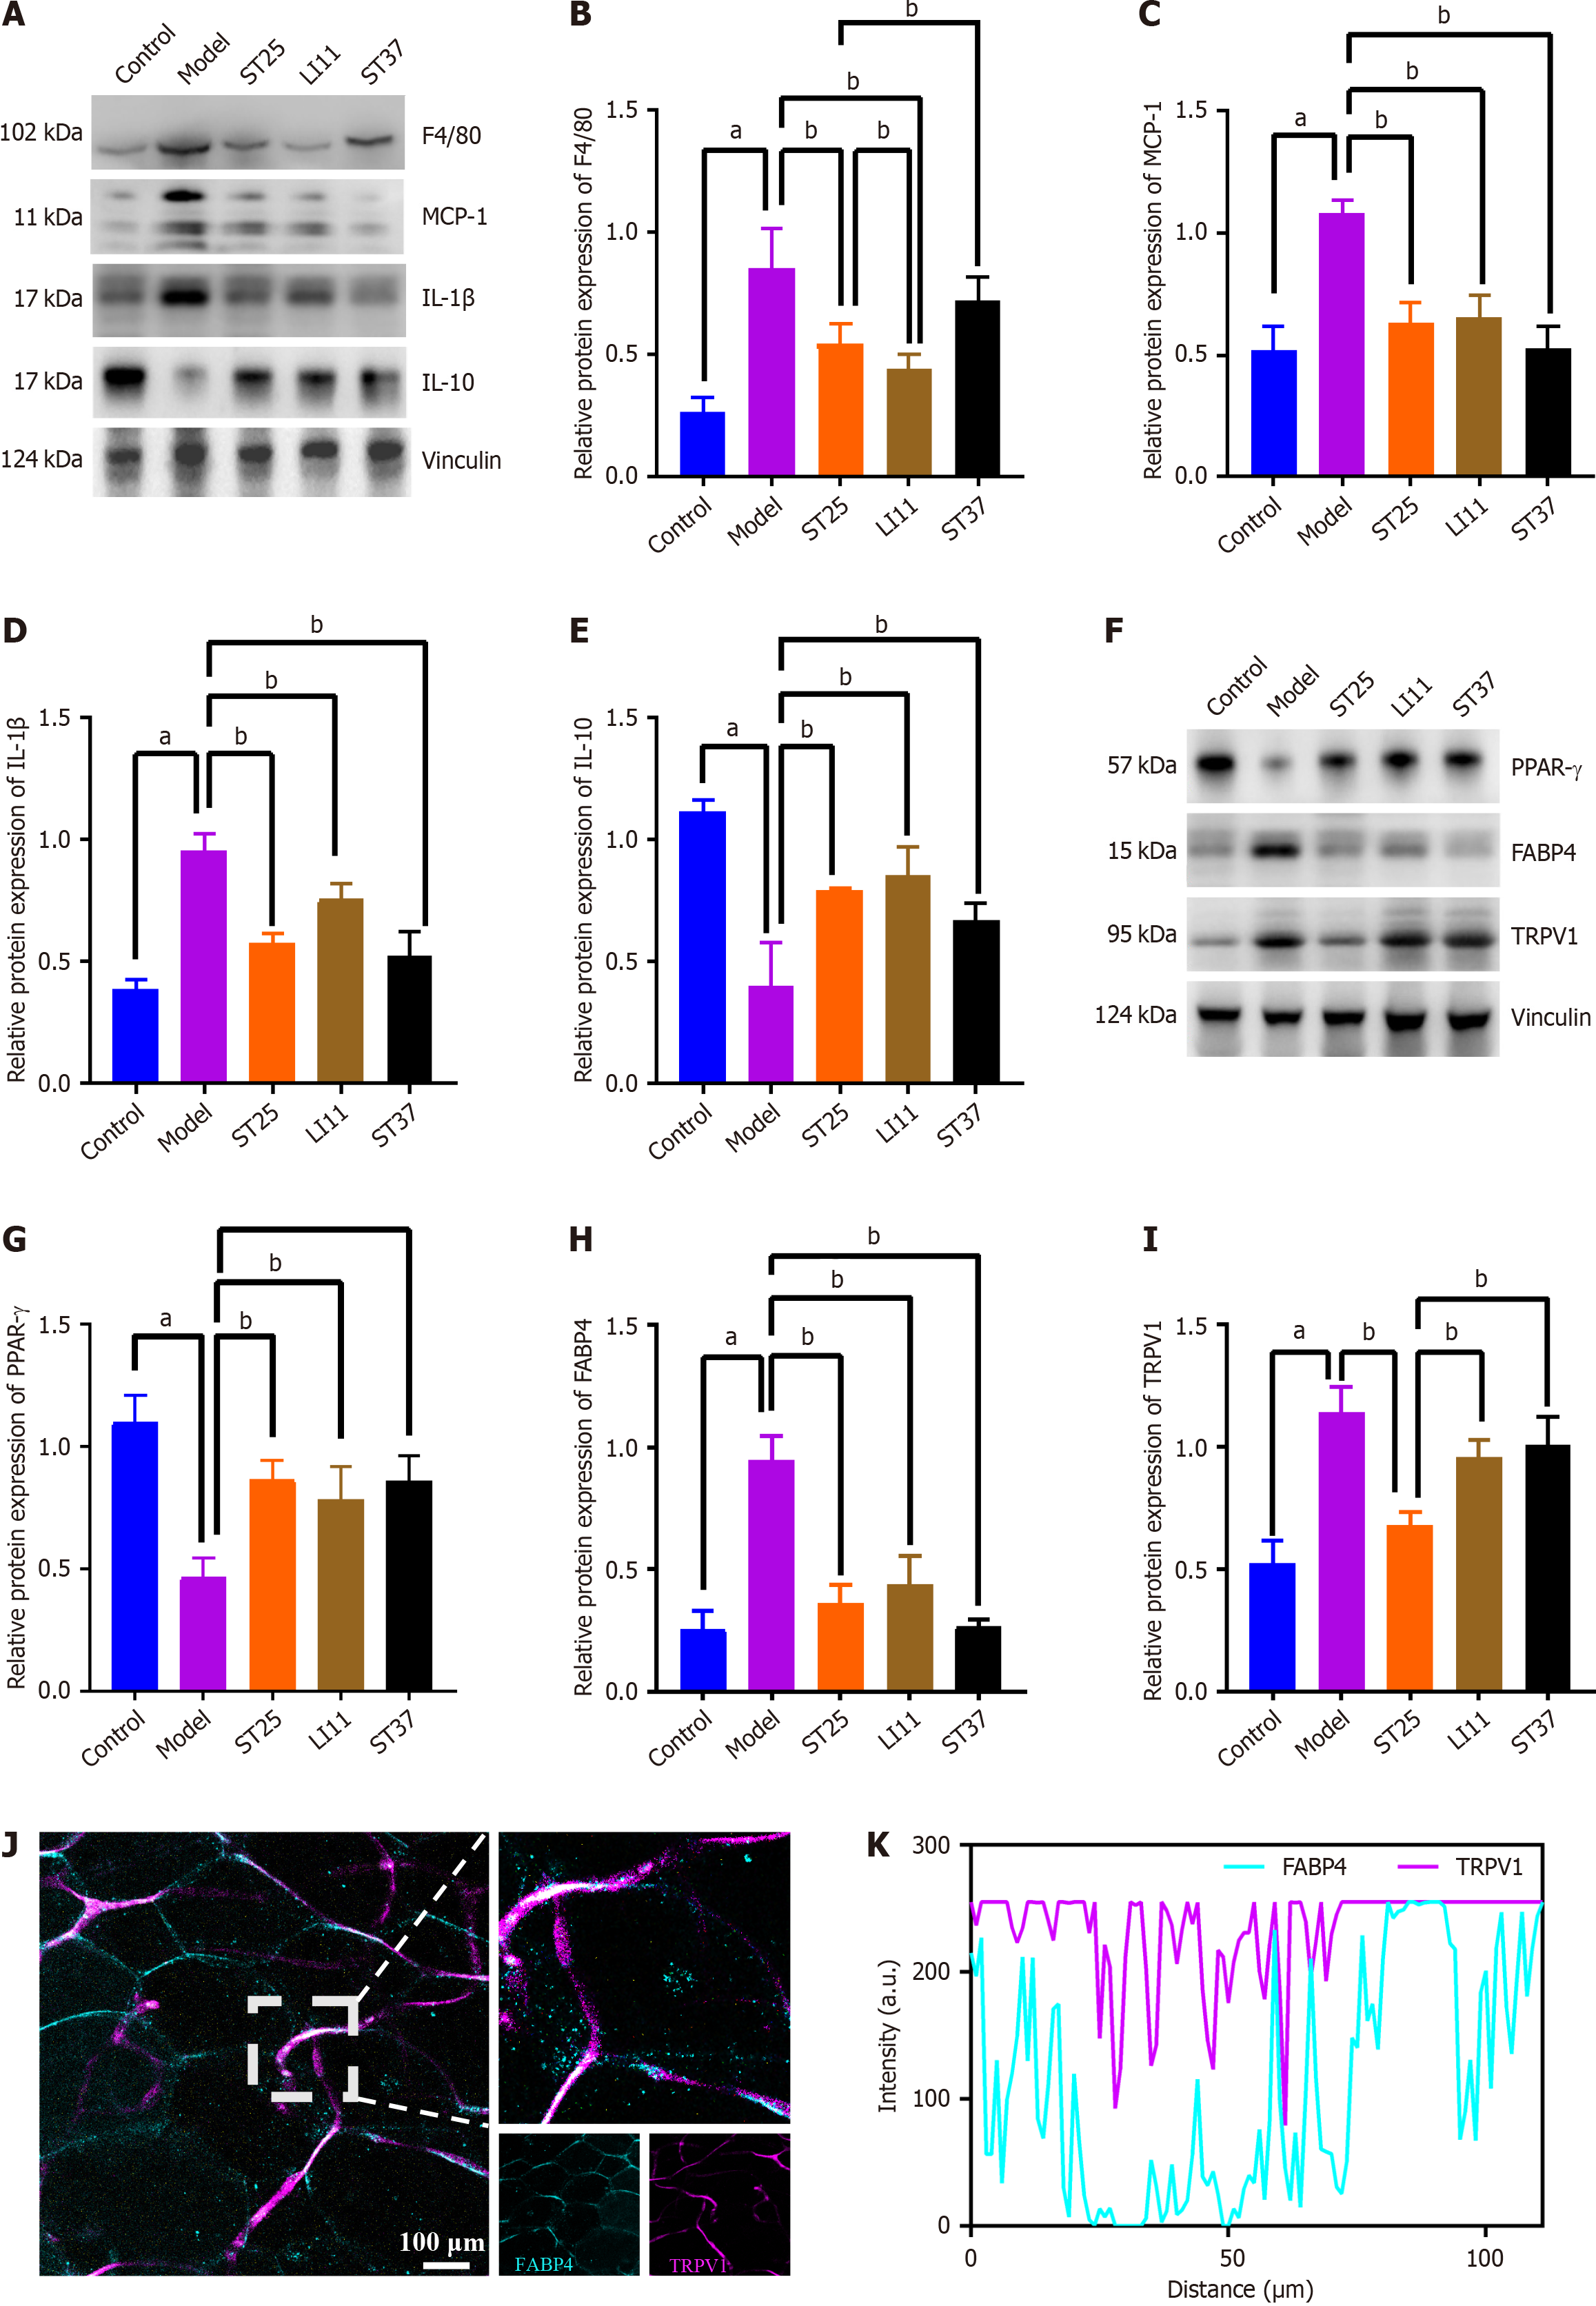
Figure 2 Electroacupuncture modulates inflammatory mediators in peripancreatic adipose tissue, enhancing metabolic function.
A and B: Electroacupuncture (EA)'s impact on the expression of F4/80 (also known as EGF-like module-containing mucin-like hormone receptor-like 1); A and C: Influence of EA on MCP-1 levels; A and D: Changes in interleukin (IL)-1β expression due to EA treatment; A and E: EA's effect on IL-10 expression; F and G: Expression levels of PPAR-γ following EA intervention; F and H: Adipose tissue expression of FABP4 in response to EA; F and I: TRPV1 expression in PAT after EA treatment. Vinculin served as a loading control; J: Representative immunofluorescence images of co-expression of FABP4 and TRPV1 in the pancreas of the model group (200 × magnification). Blue fluorescence representing FABP4, and TRPV1 is represented by purple fluorescence; K: Quantitative analysis of the co-localization of FABP4 and TRPV1 immunofluorescence, indicating a correlation between the two proteins. aP < 0.05 compared to the normal control group; bP < 0.05 compared to the model or another treatment group.
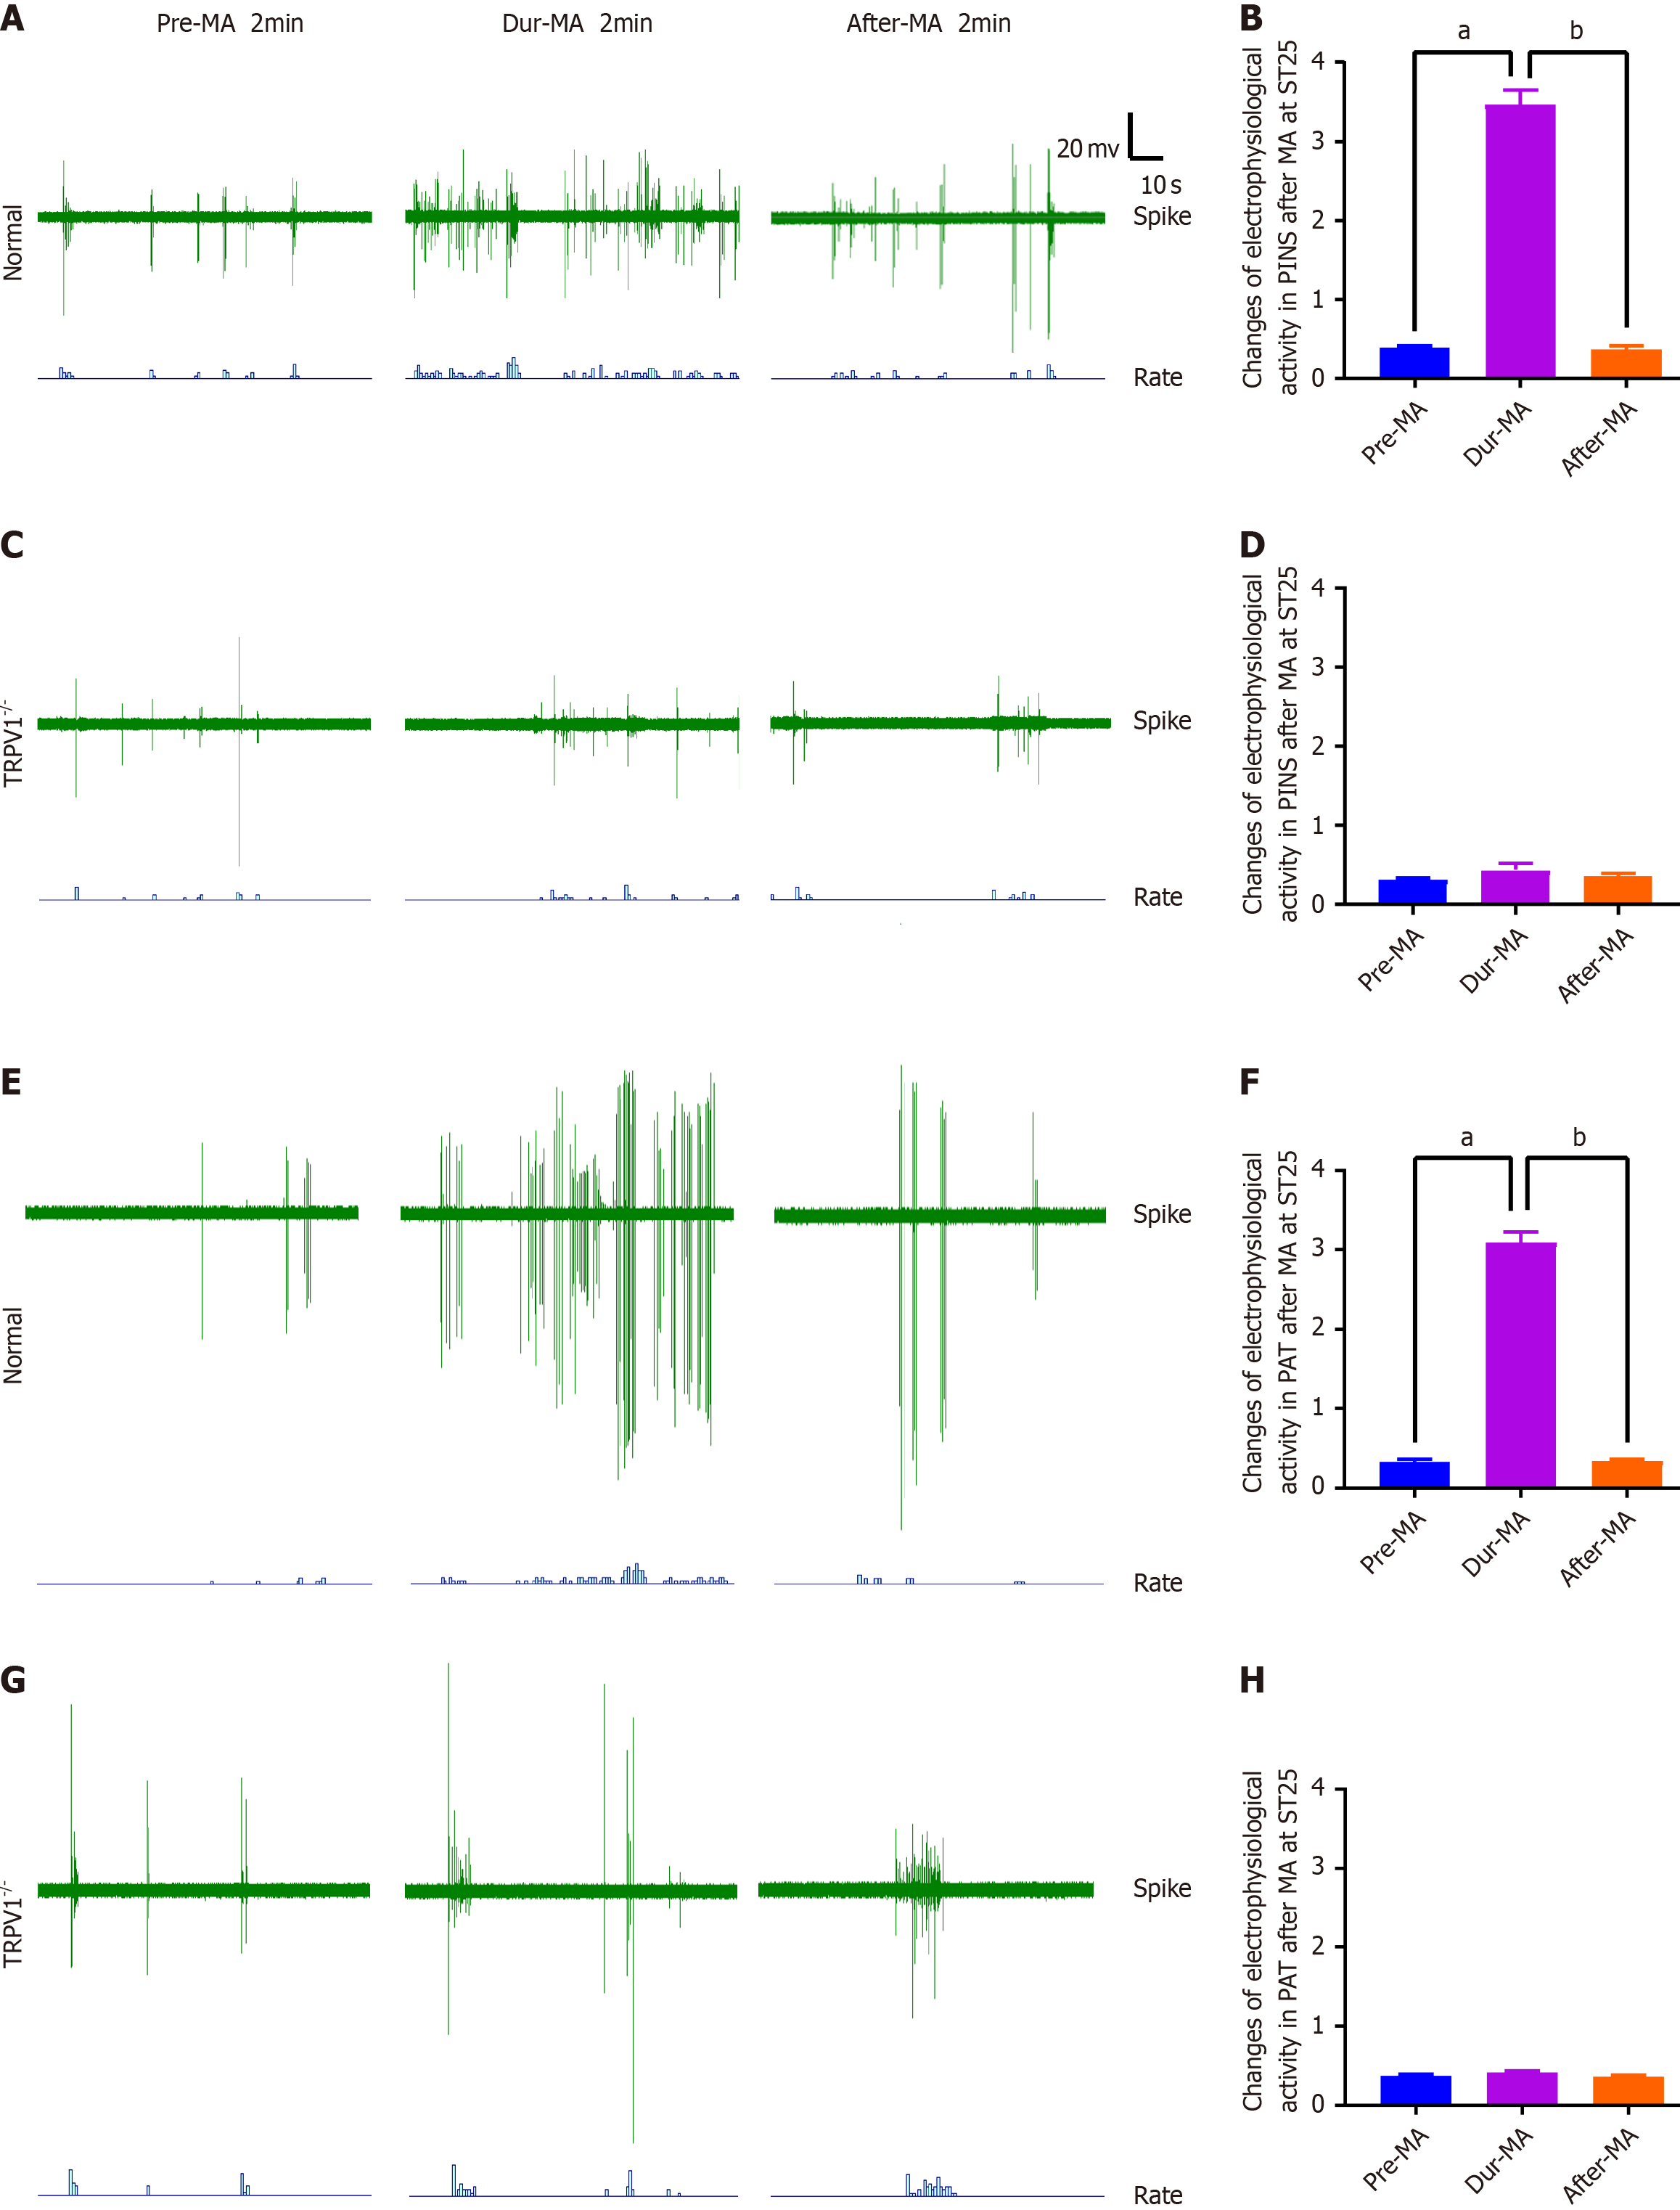
Figure 3 TRPV1-mediated acupuncture modulates the discharge patterns of the pancreatic intrinsic nervous system.
A and B: The impact of manual acupuncture (MA) at Tianshu (ST25) acupoint on pancreatic intrinsic nervous system (PINS) activity and the corresponding discharge frequency in wild-type (WT) mice; C and D: The influence of MA at ST25 on PINS activity and discharge frequency in TRPV1 knockout (TRPV1-/-) mice; E and F: The effect of MA at ST25 on peripancreatic adipose tissue (PAT) activity and associated discharge frequency in WT mice; G and H: The alteration in PAT activity and discharge frequency following MA at Tianshu (ST25) acupoint in TRPV1-/- mice (n = 7). aP < 0.01 compared to the dur-MA group; bP < 0.01 compared to the pre-MA group and MA, manual acupuncture. TRPV1: Transient receptor potential vanilloid subfamily member 1; MA: Manual acupuncture.
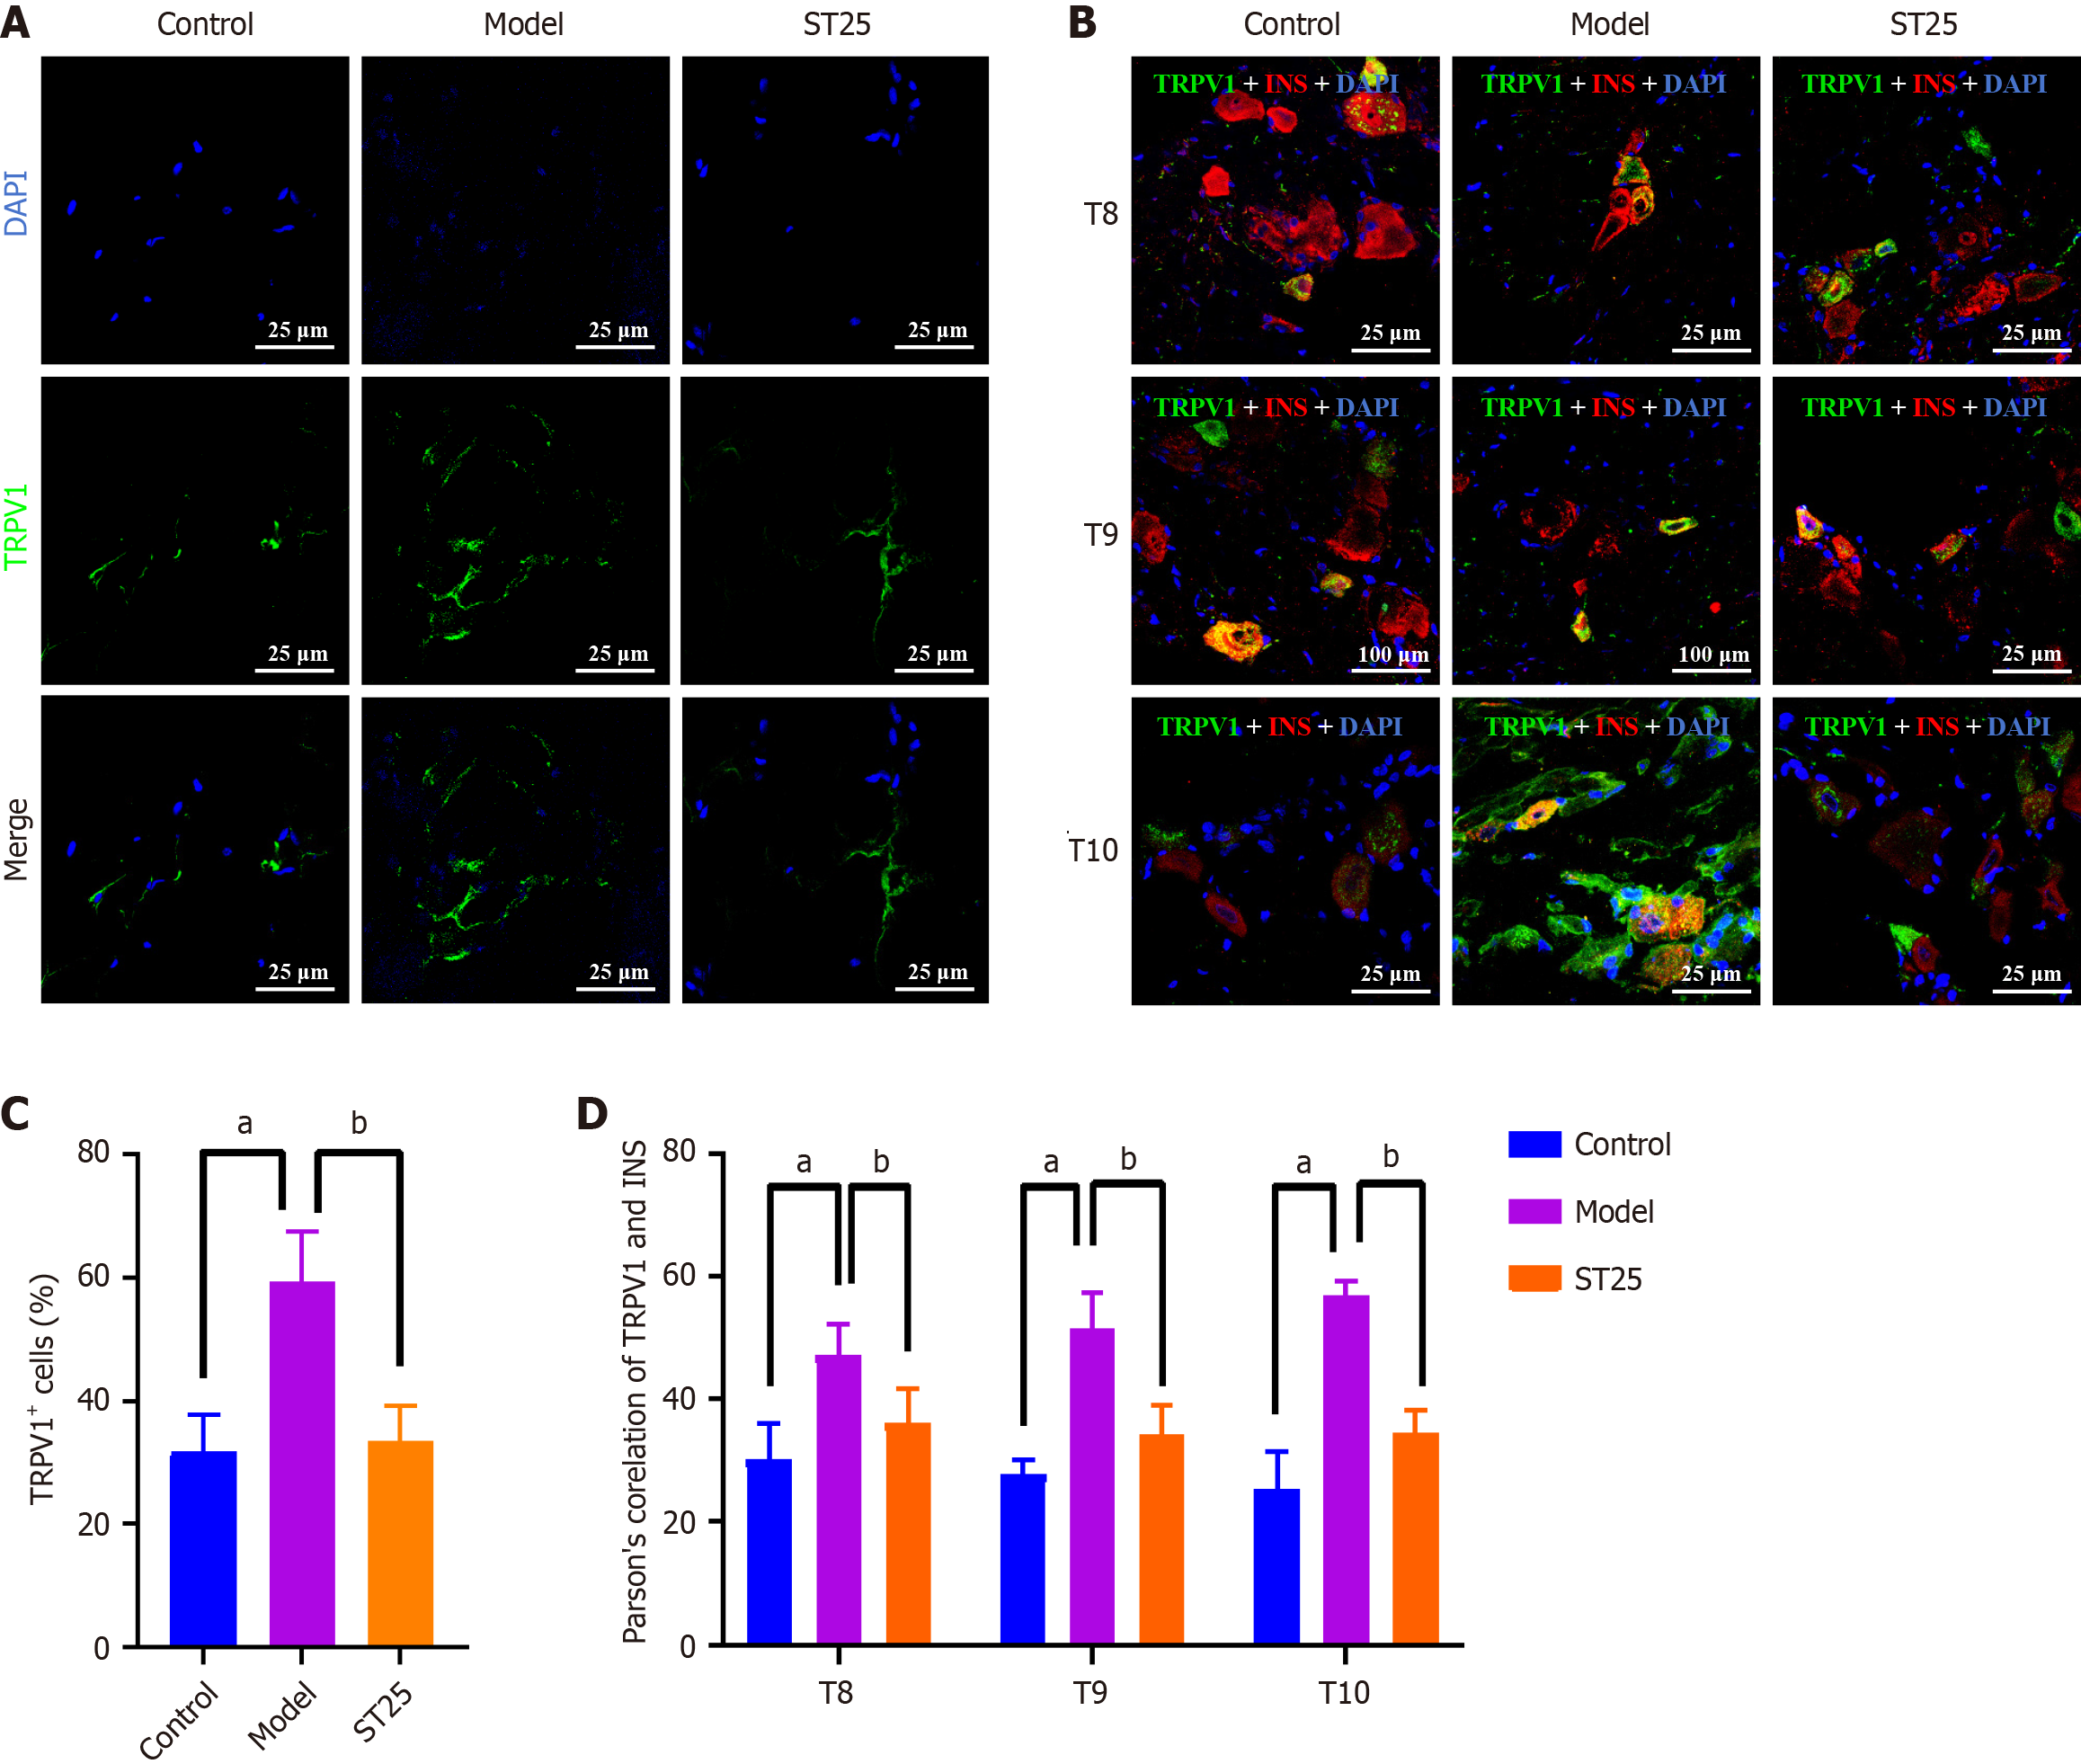
Figure 4 TRPV1-mediated enhancement of metabolic function by electroacupuncture.
A: Representative immunofluorescence images of pancreatic tissue across experimental groups. The nuclei are visualized in blue by 4',6-diamidino-2-phenylindole (DAPI), with green immunofluorescence indicating the presence of TRPV1. Islets were examined at 630 × magnification. A uniform scale bar of 25 μm applies to all groups; B: Representative immunofluorescenc images of the dorsal root ganglion across groups. Nuclei are stained blue by DAPI, with green immunofluorescence representing TRPV1 and red immunofluorescence representing insulin; C: Percentage of pancreatic TRPV1+ nerve fibers in each group; D: Illustrative immunofluorescence images showing co-expression of TRPV1 and INS in all groups. aP < 0.05 compared to the normal control group; bP < 0.05 compared to the model group. TRPV1: Transient receptor potential vanilloid subfamily member 1; INS: Insulin; DAPI: 4',6-diamidino-2-phenylindole.
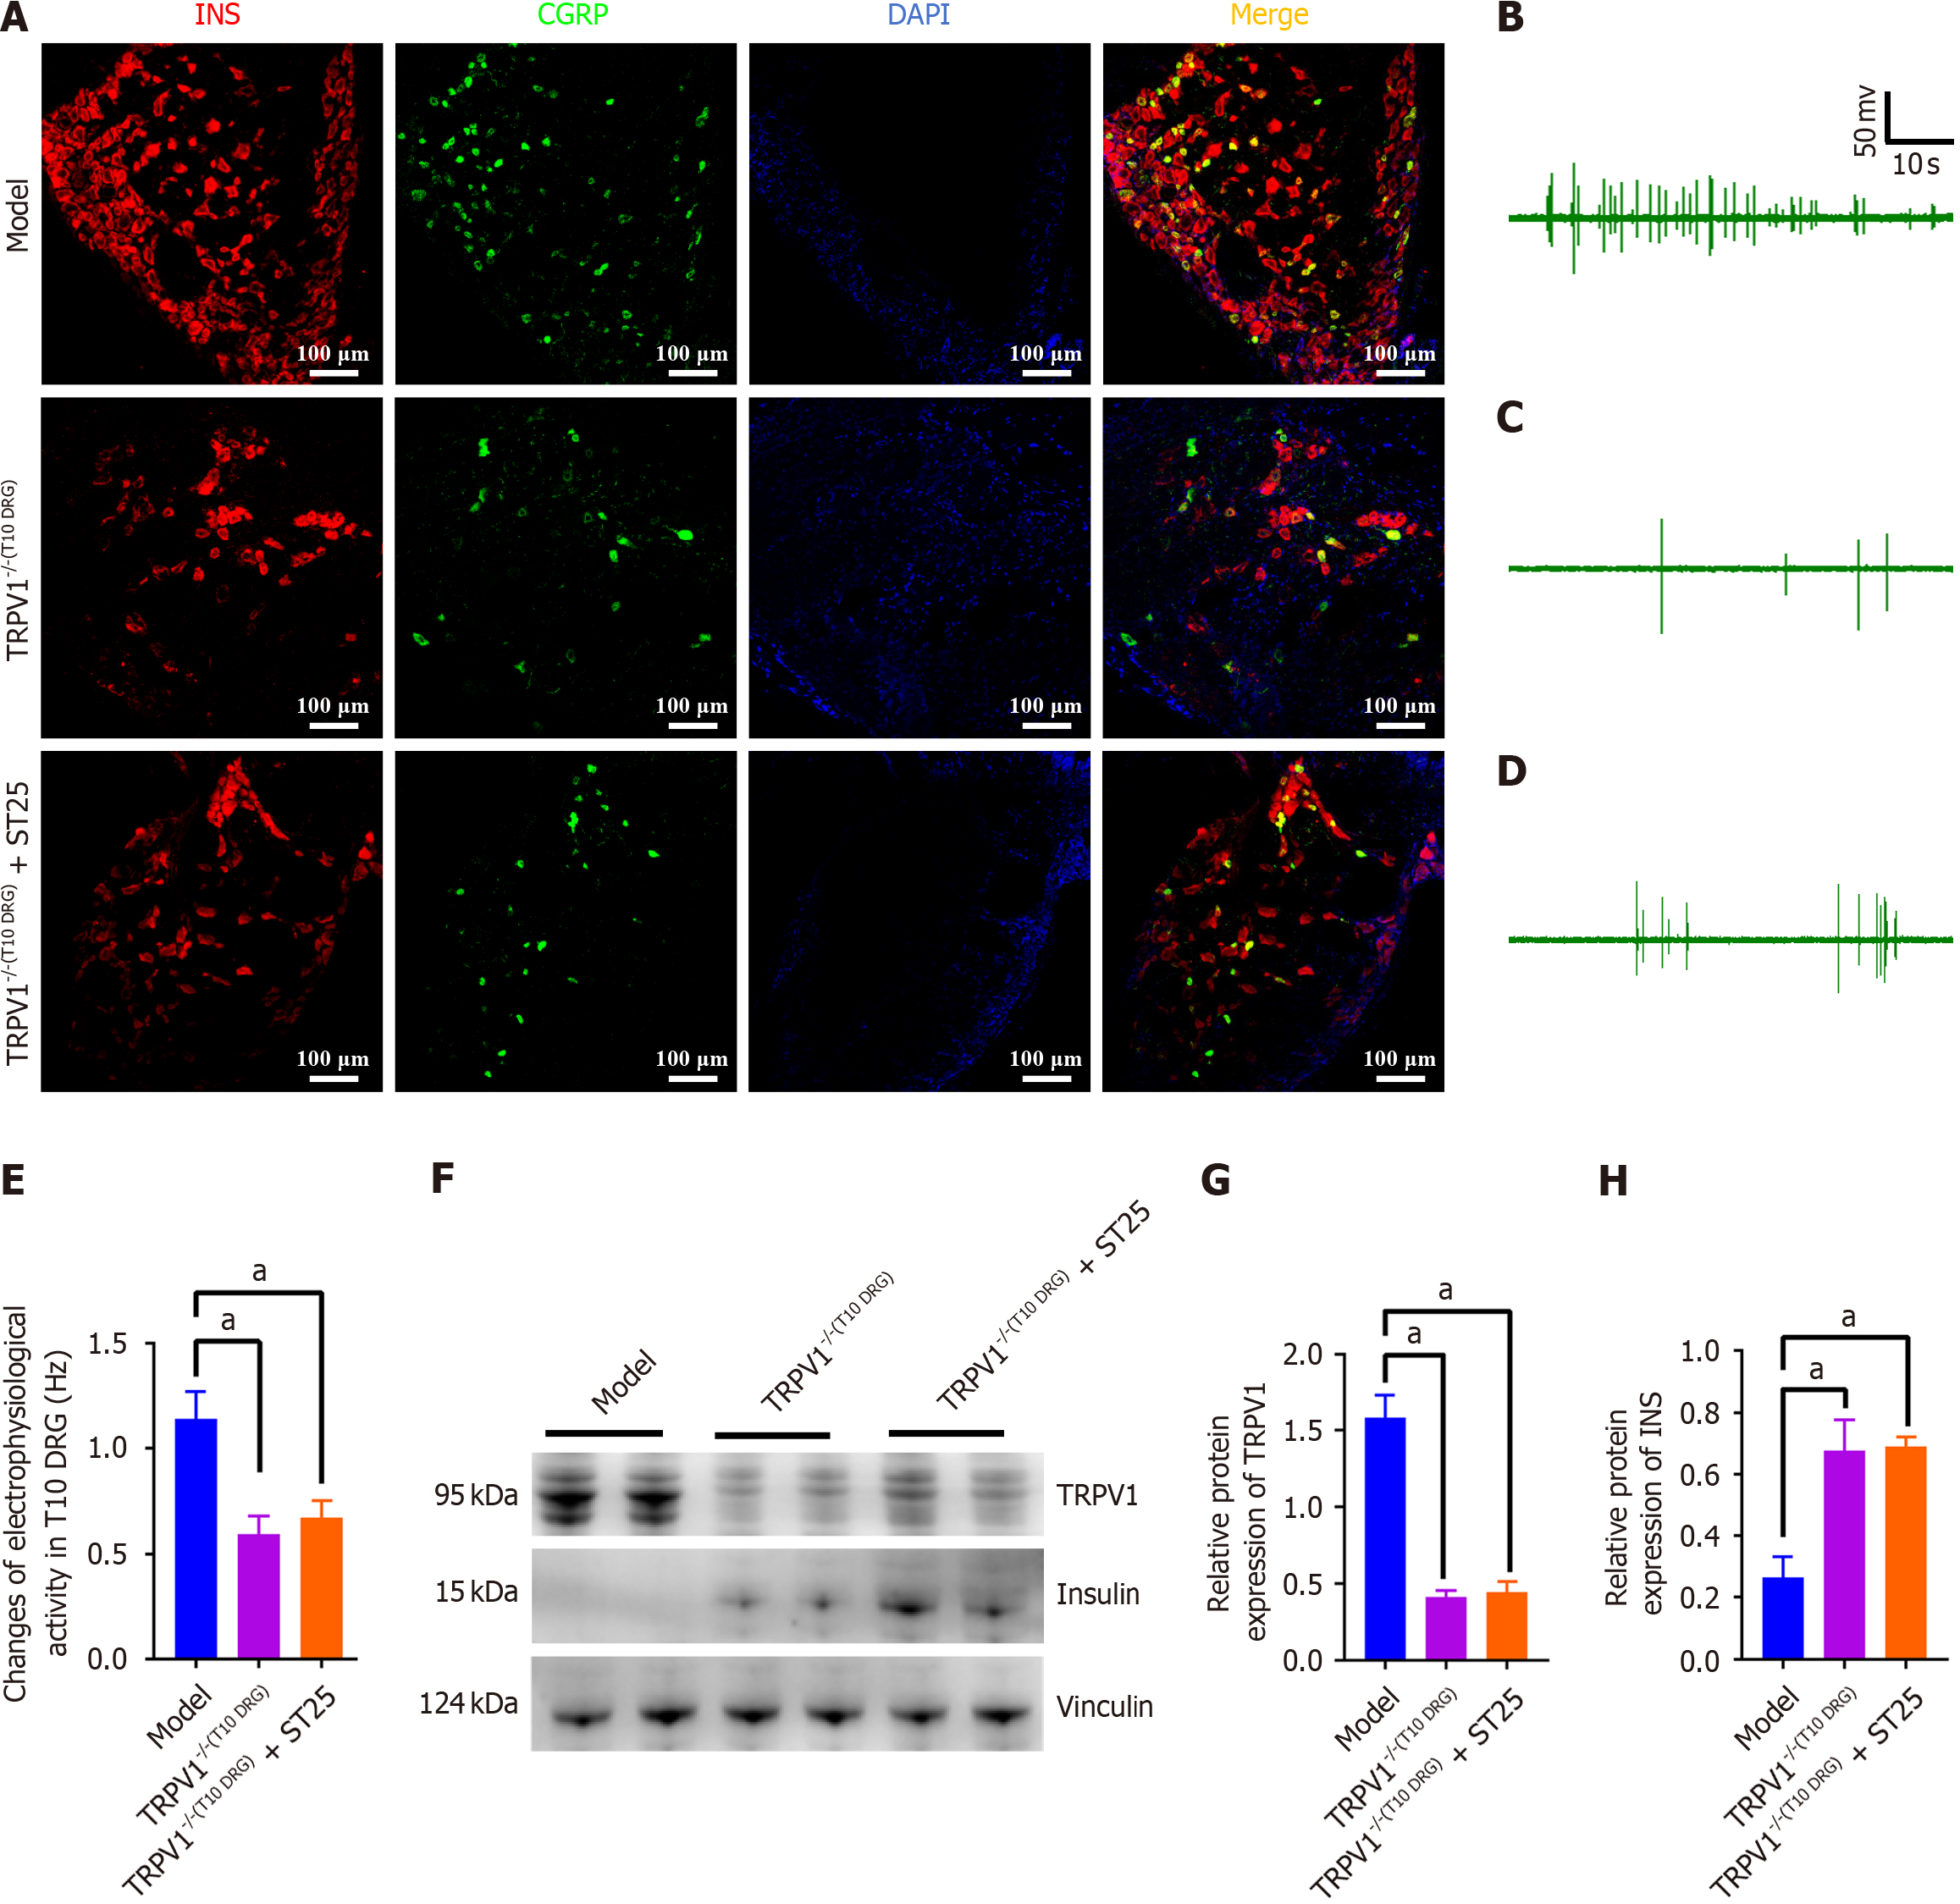
Figure 5 Modulation of pancreatic function by TRPV1 neuronal pathways in electroacupuncture-treated t10 dorsal root ganglion.
A: Representative immunofluorescence images illustrating co-expression of insulin (INS) and CGRP in the pancreas at 200 × magnification. Nuclei are stained blue with 4',6-diamidino-2-phenylindole, with red representing INS and green representing CGRP immunofluorescence; B-D: Electrophysiological activity measurements of the T10 DRG in model mice under different conditions: Untreated model, TRPV1 knockout (TRPV1-/-) in T10 DRG, and TRPV1-/- in T10 DRG followed by electroacupuncture (EA) at the ST25 acupoint; E: Discharge frequency associated with the groups mentioned in B-D; F-H: Impact of EA on the expression levels of TRPV1 and INS in the pancreas following capsazepine injection into the T10 DRG. GAPDH served as an internal reference protein. aP < 0.05 compared to the model or another treatment group. INS: Insulin; DAPI: 4',6-diamidino-2-phenylindole; ST25: Tianshu acupoint.
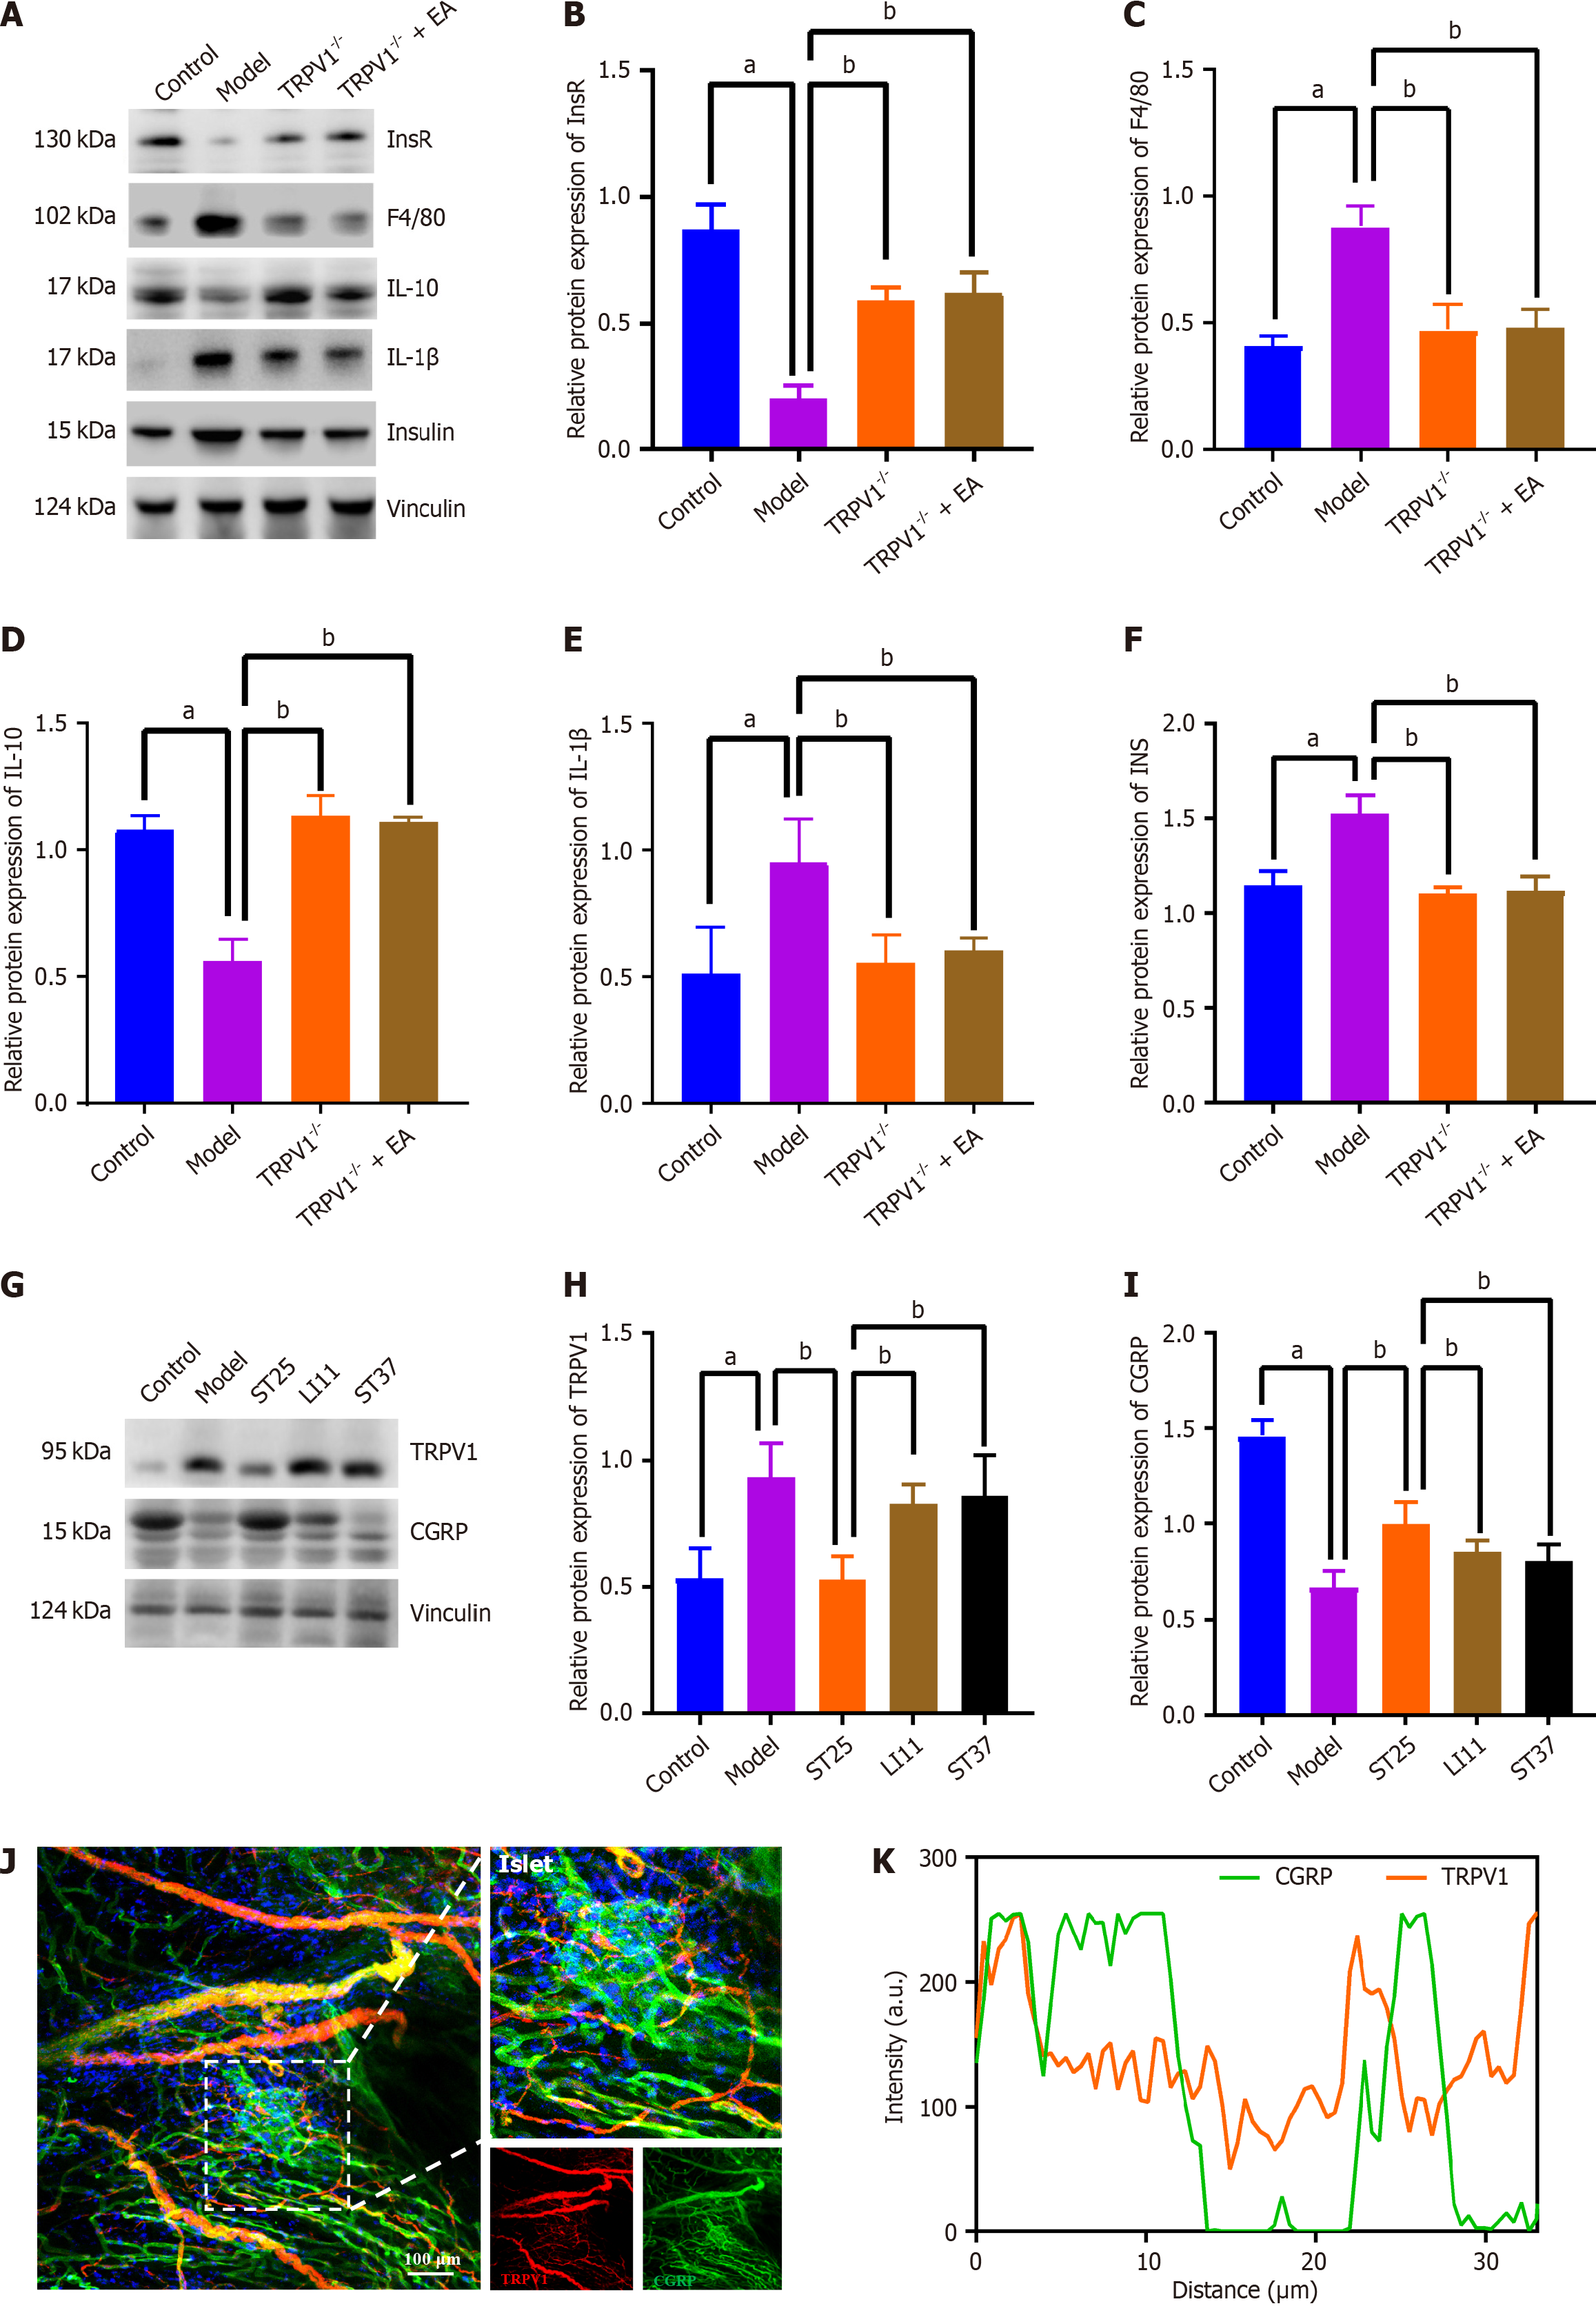
Figure 6 TRPV1 knockout preserves immunometabolic homeostasis in peripancreatic adipose tissue and pancreas.
A-F: Impact of electroacupuncture (EA) on the levels of insulin receptor, EGF-like module-containing mucin-like hormone receptor-like 1 (F4/80), interleukin (IL)-10, IL-1β, and insulin in peripancreatic adipose tissue following TRPV1 knockout; G-I: Influence of EA on the expression levels of TRPV1 and calcitonin gene-related peptide-receptor component protein (CGRP) in the pancreas. Vinculin served as loading controls; J: Representative immunofluorescence images of co-expression of TRPV1 and CGRP in the islets of the ST25 group (200 × magnification). Nuclei were stained with 4',6-diamidino-2-phenylindole (blue), TRPV1 is represented by red immunofluorescence, and CGRP by green immunofluorescence; K: Correlation between TRPV1 and CGRP expression as revealed by quantitative analysis of the co-localization of TRPV1 and CGRP immunofluorescence. aP < 0.05 compared to the normal control group; bP < 0.05 compared to the model or another treatment group. IL: Interleukin; EA: Electroacupuncture
- Citation: Liu Y, Yu Z, Wang X, Yuan MQ, Lu MJ, Gong MR, Li Q, Xia YB, Yang GH, Xu B, Litscher G, Xu TC. Neurophysiological mechanisms of electroacupuncture in regulating pancreatic function and adipose tissue expansion. World J Diabetes 2025; 16(5): 101354
- URL: https://www.wjgnet.com/1948-9358/full/v16/i5/101354.htm
- DOI: https://dx.doi.org/10.4239/wjd.v16.i5.101354


