Copyright
©The Author(s) 2025.
World J Diabetes. May 15, 2025; 16(5): 100980
Published online May 15, 2025. doi: 10.4239/wjd.v16.i5.100980
Published online May 15, 2025. doi: 10.4239/wjd.v16.i5.100980
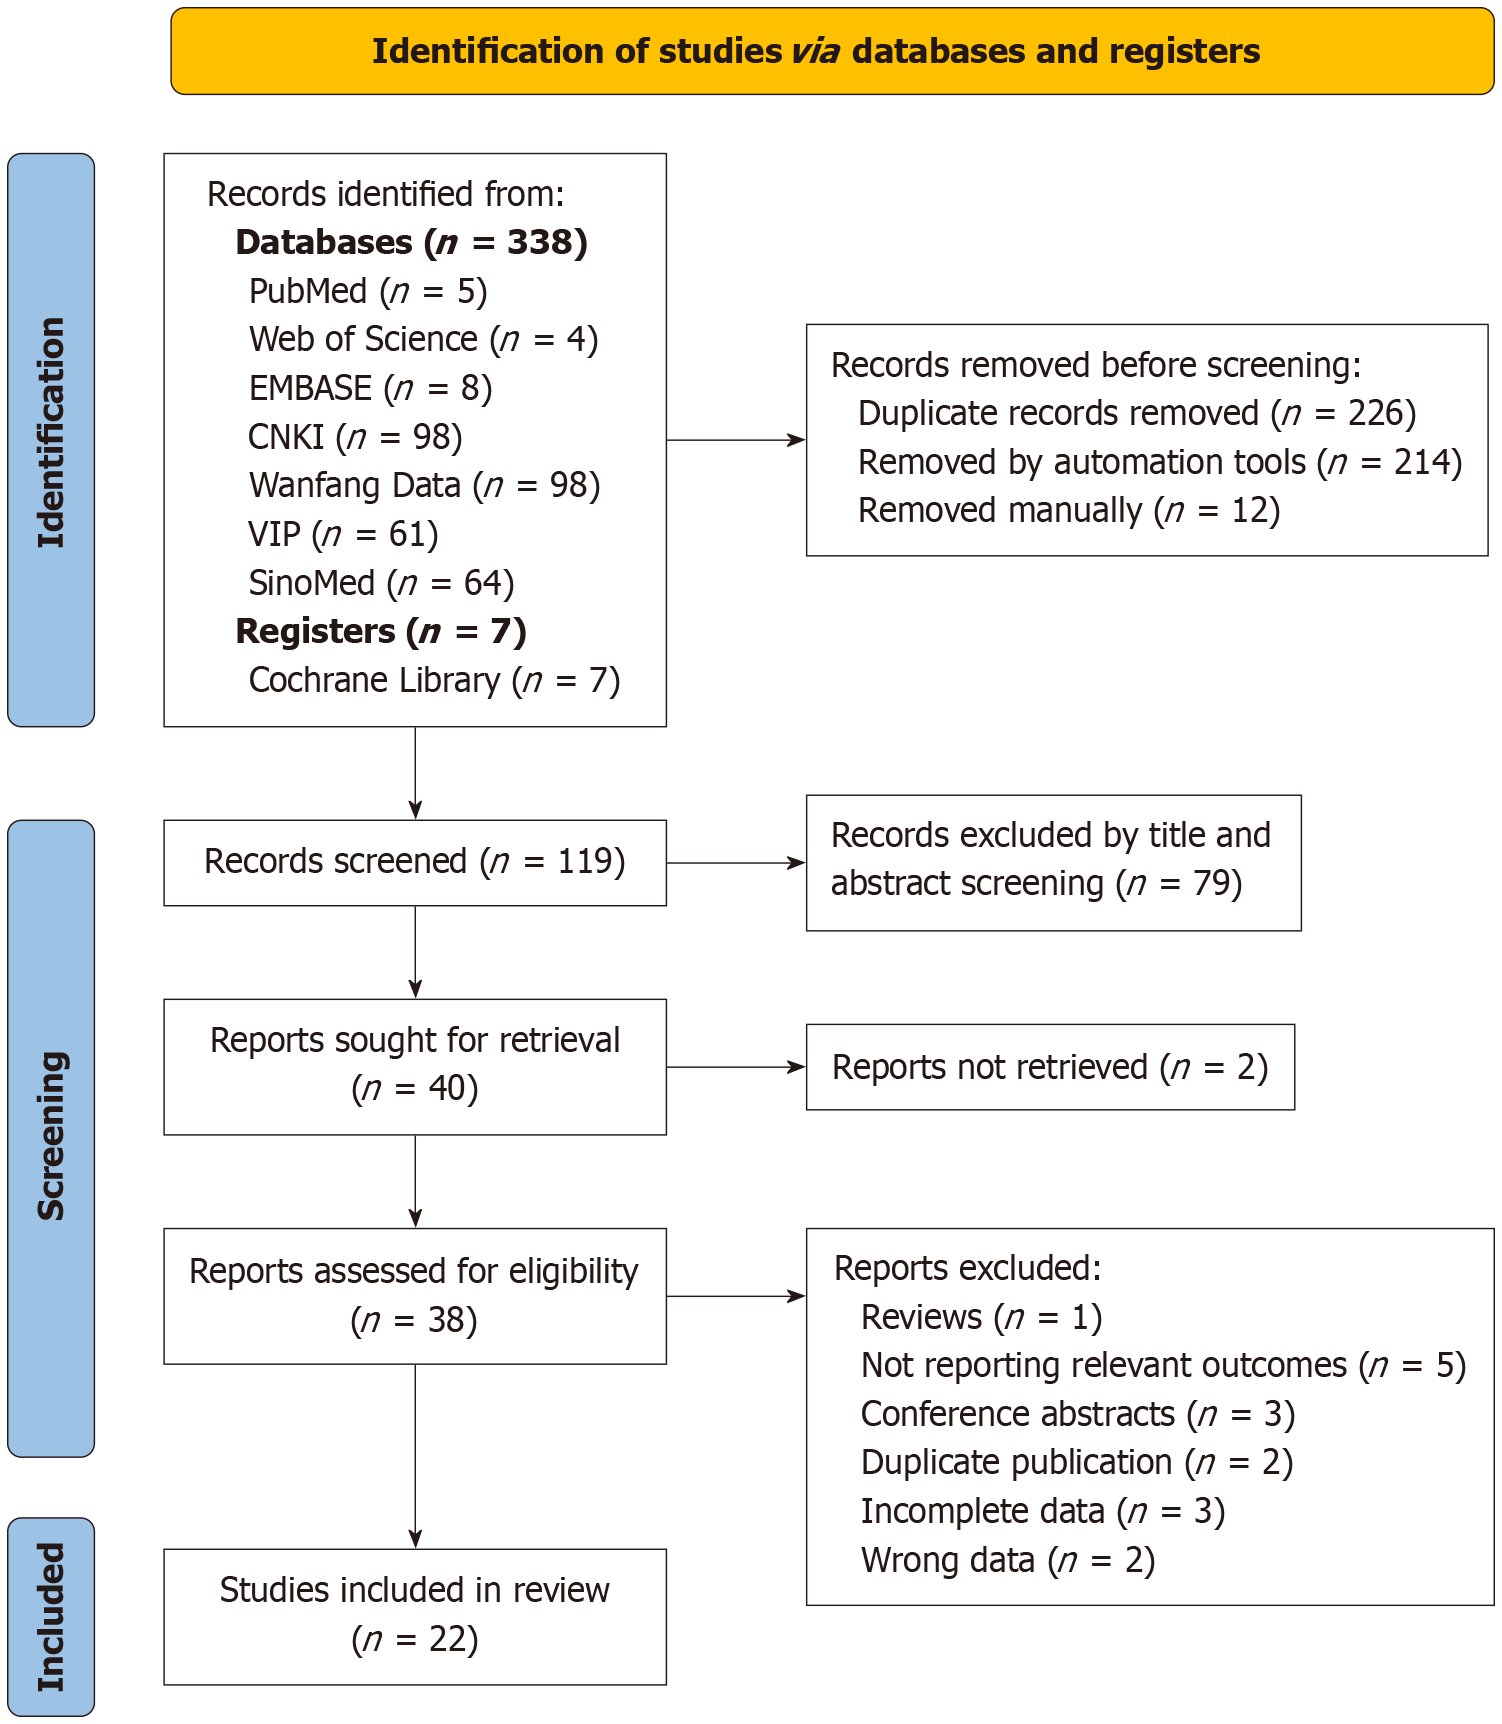
Figure 1
Flowchart of the retrieval and screening process.
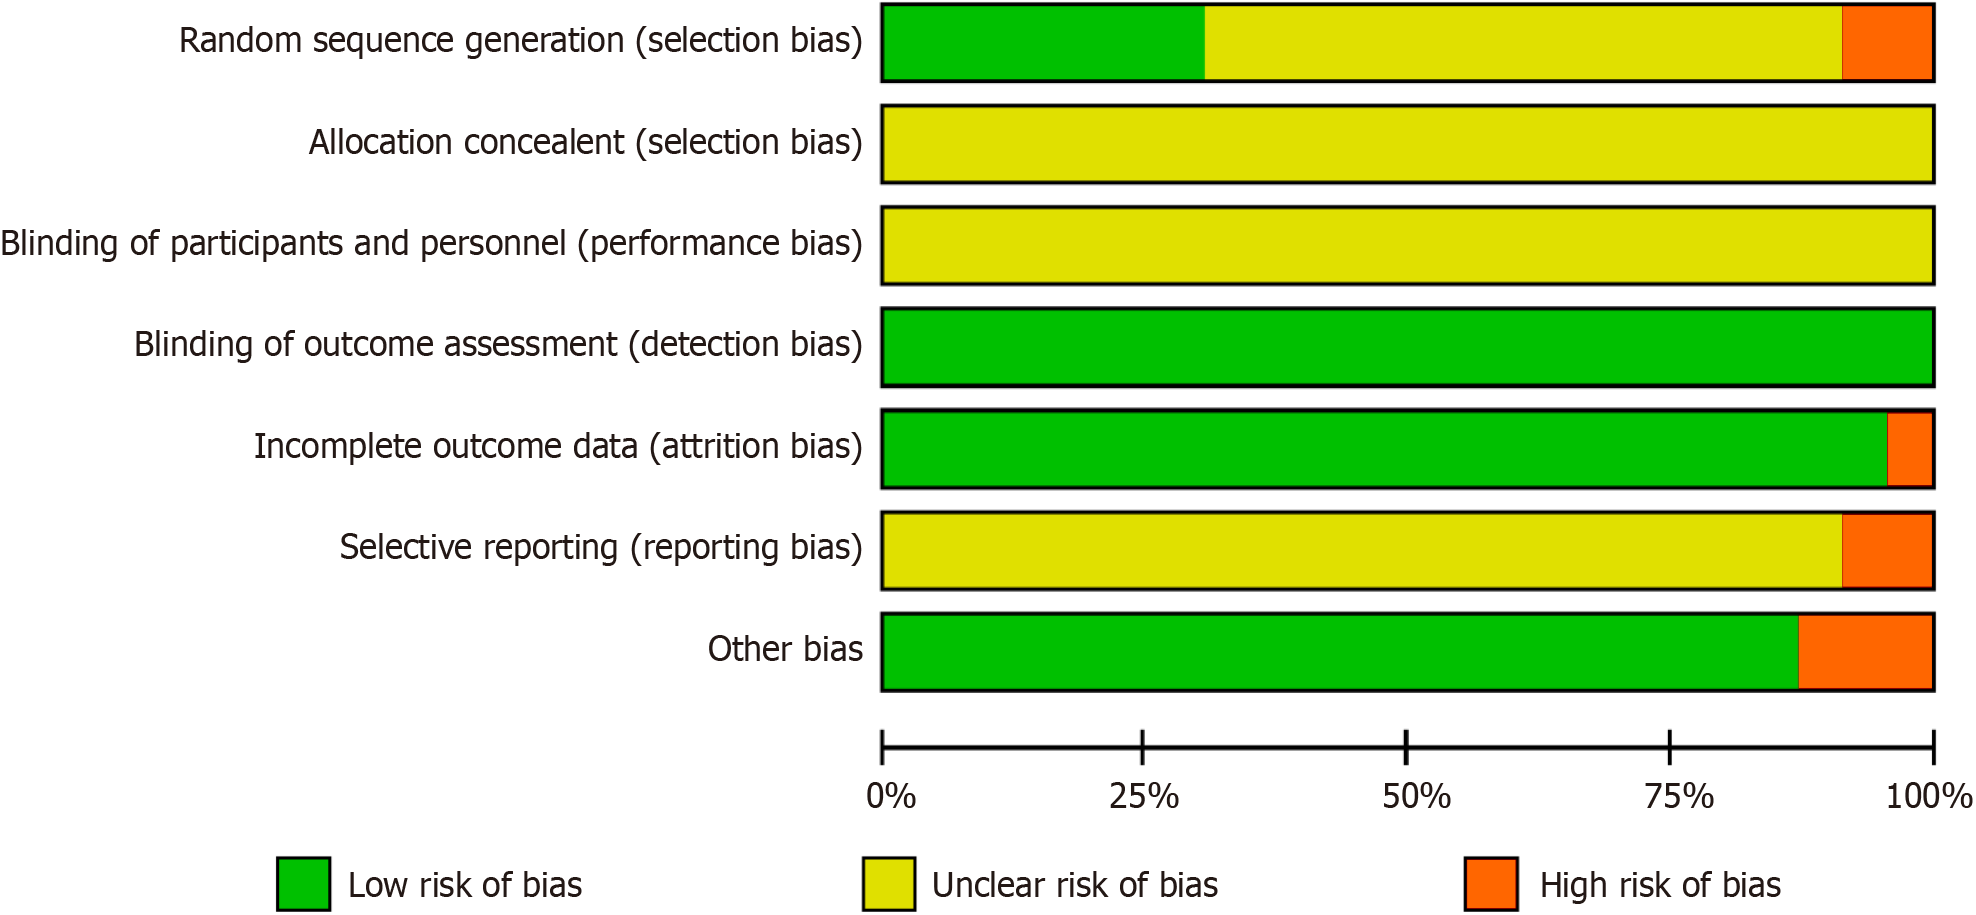
Figure 2
The risk of assessment graph of the included studies.
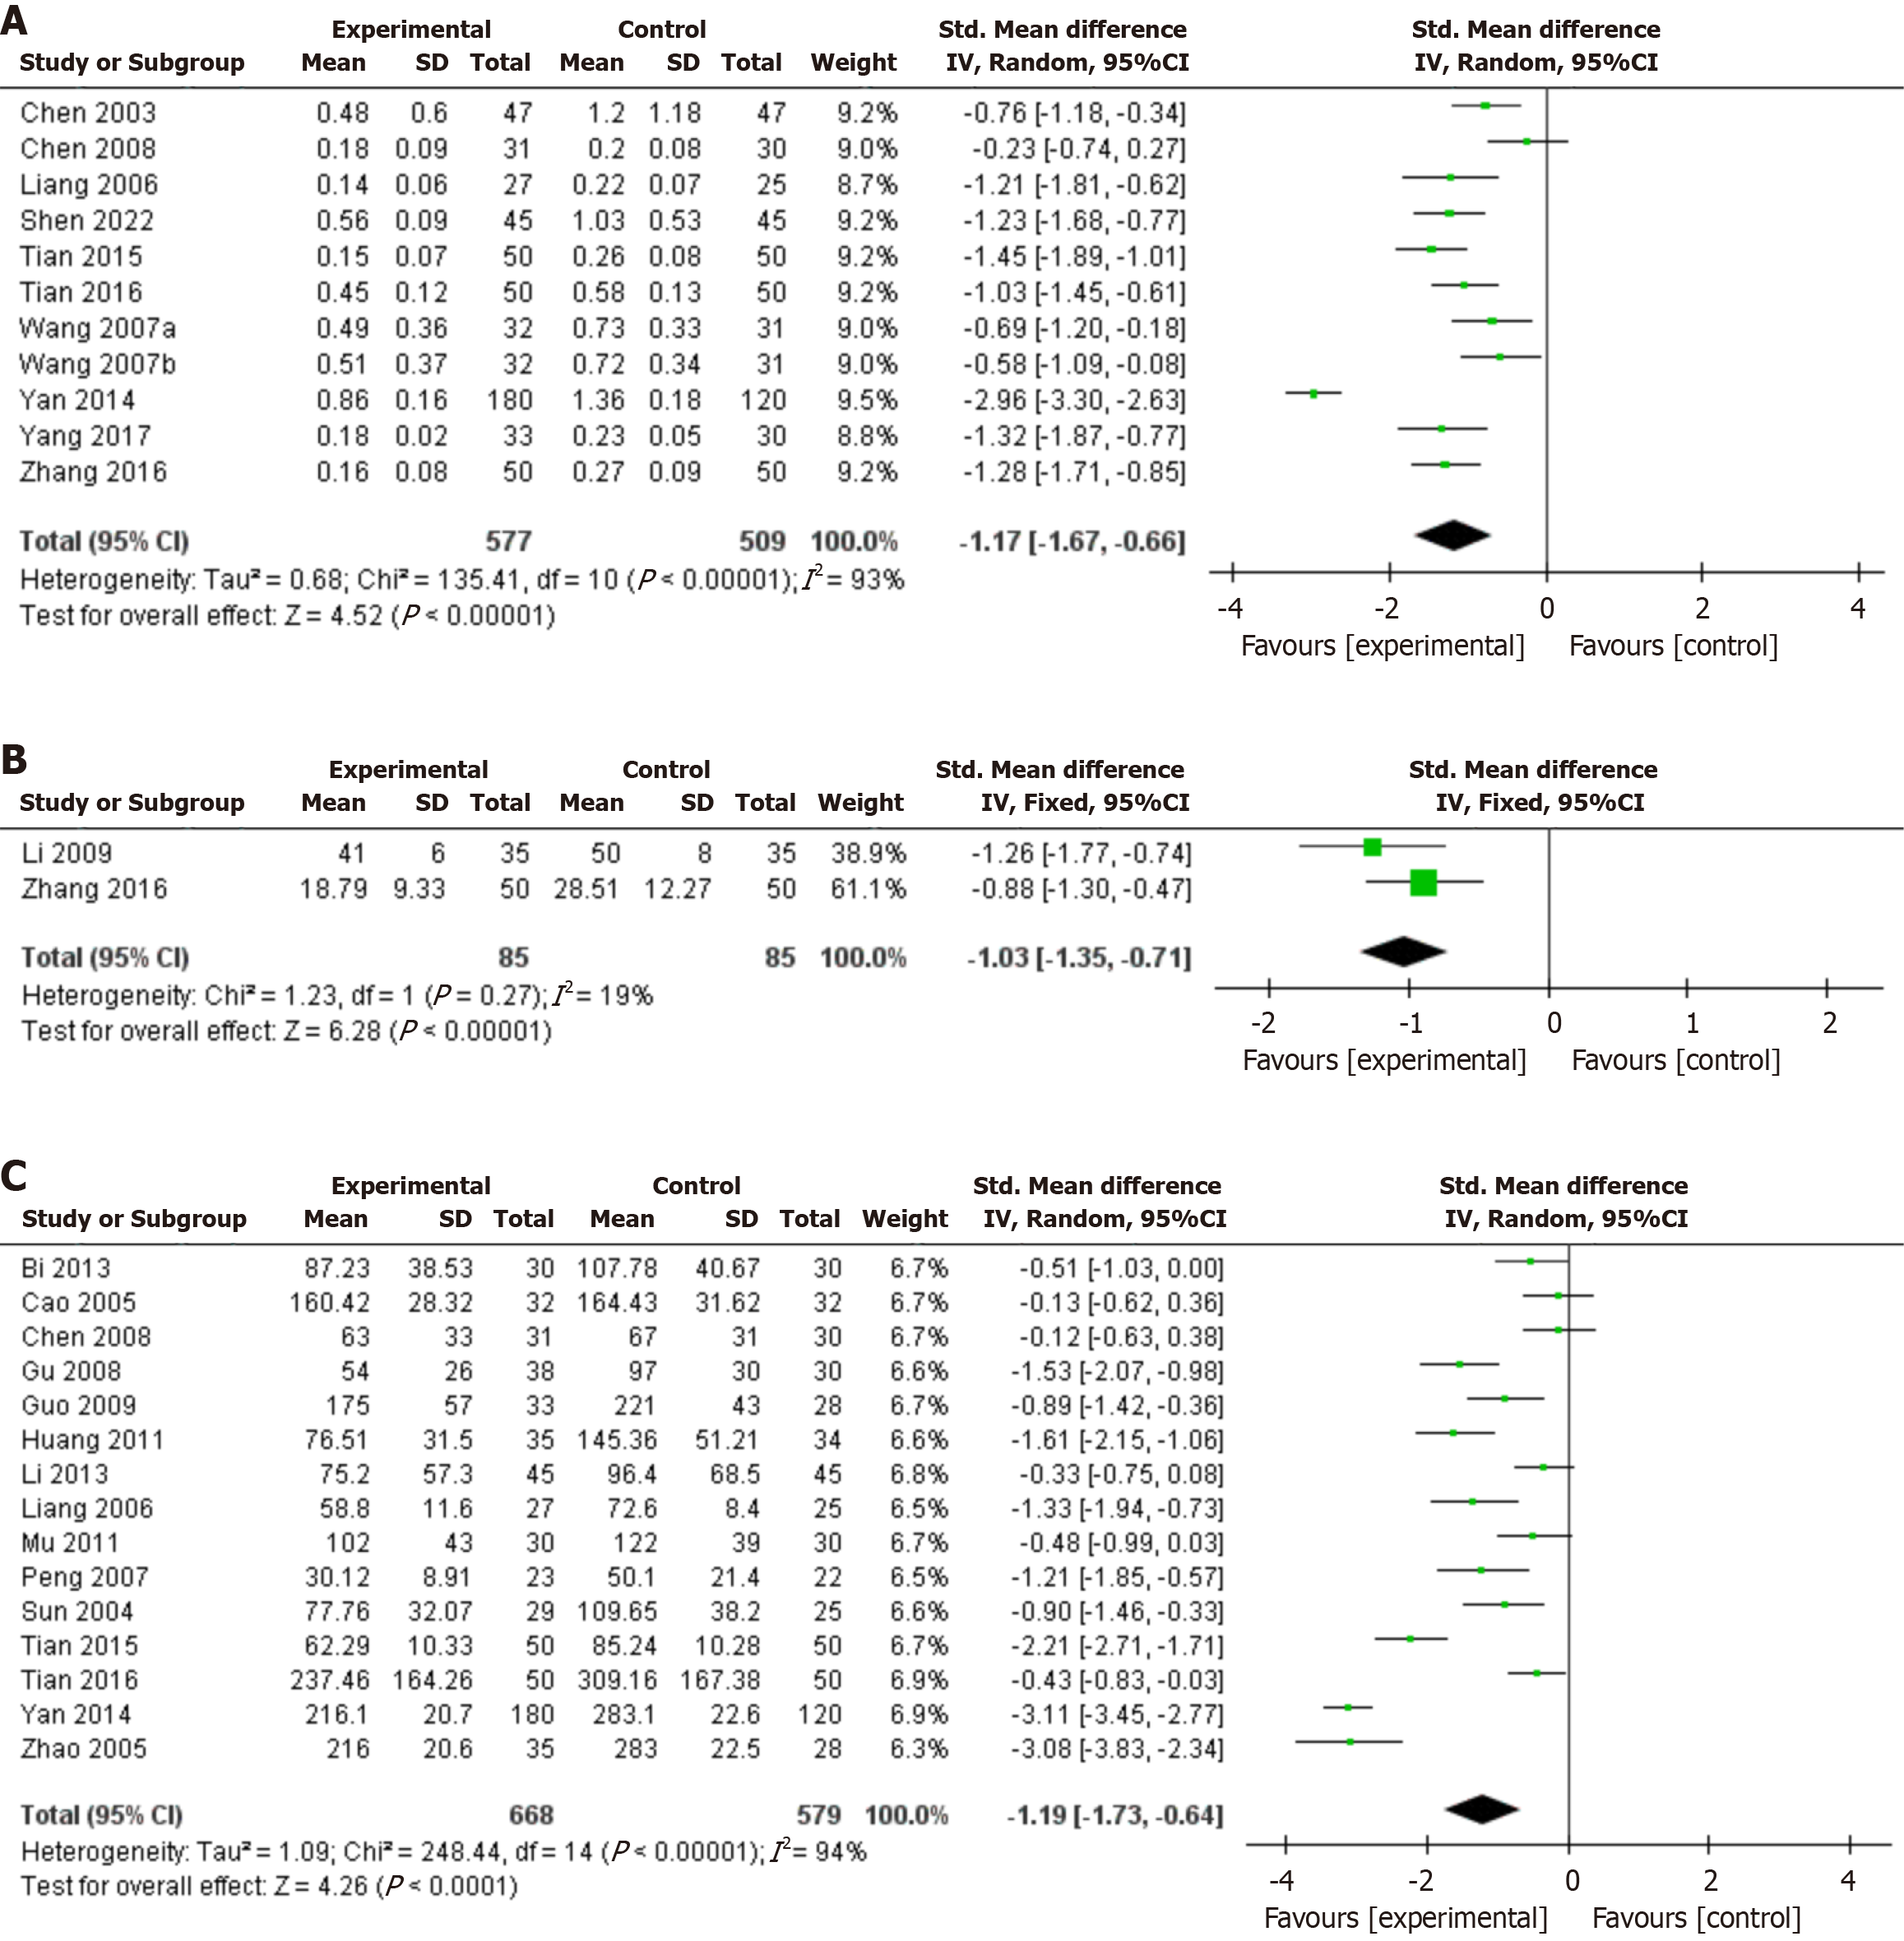
Figure 3 Forest plots for the meta-analysis of urinary protein.
A: 24-hour urine proteinuria; B: Urine microalbumin; C: Urinary albumin excretion rate.
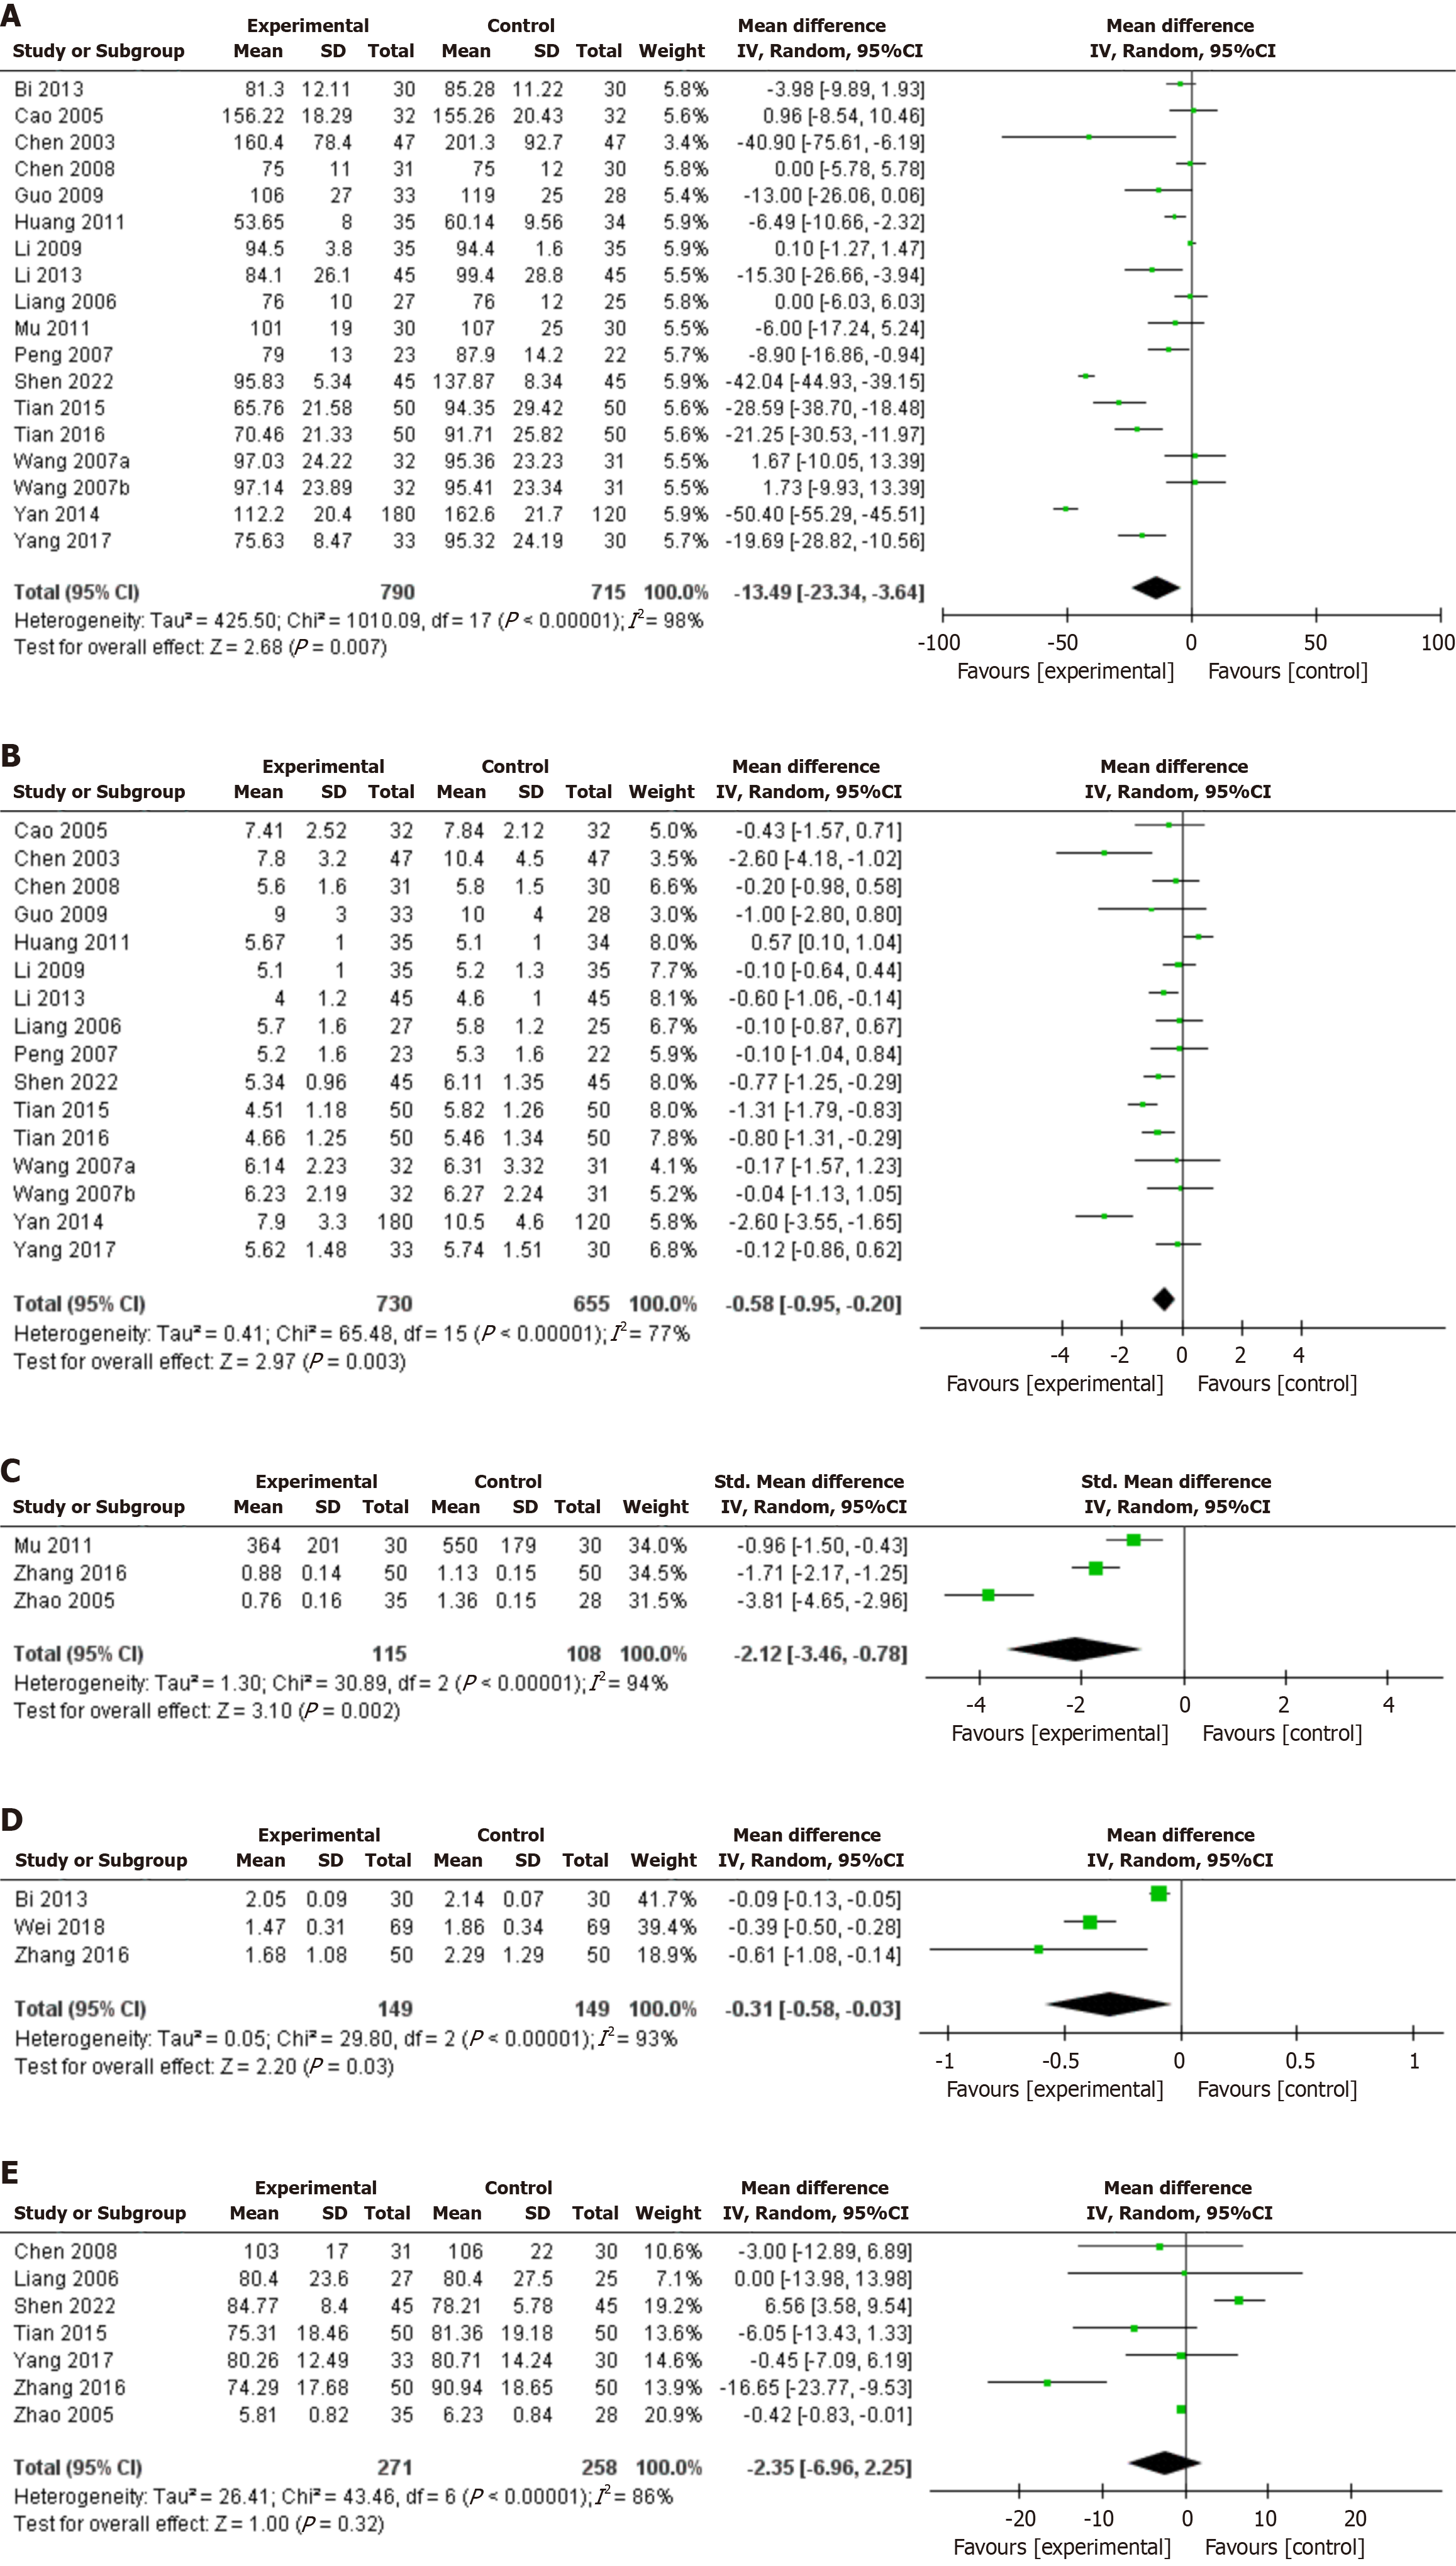
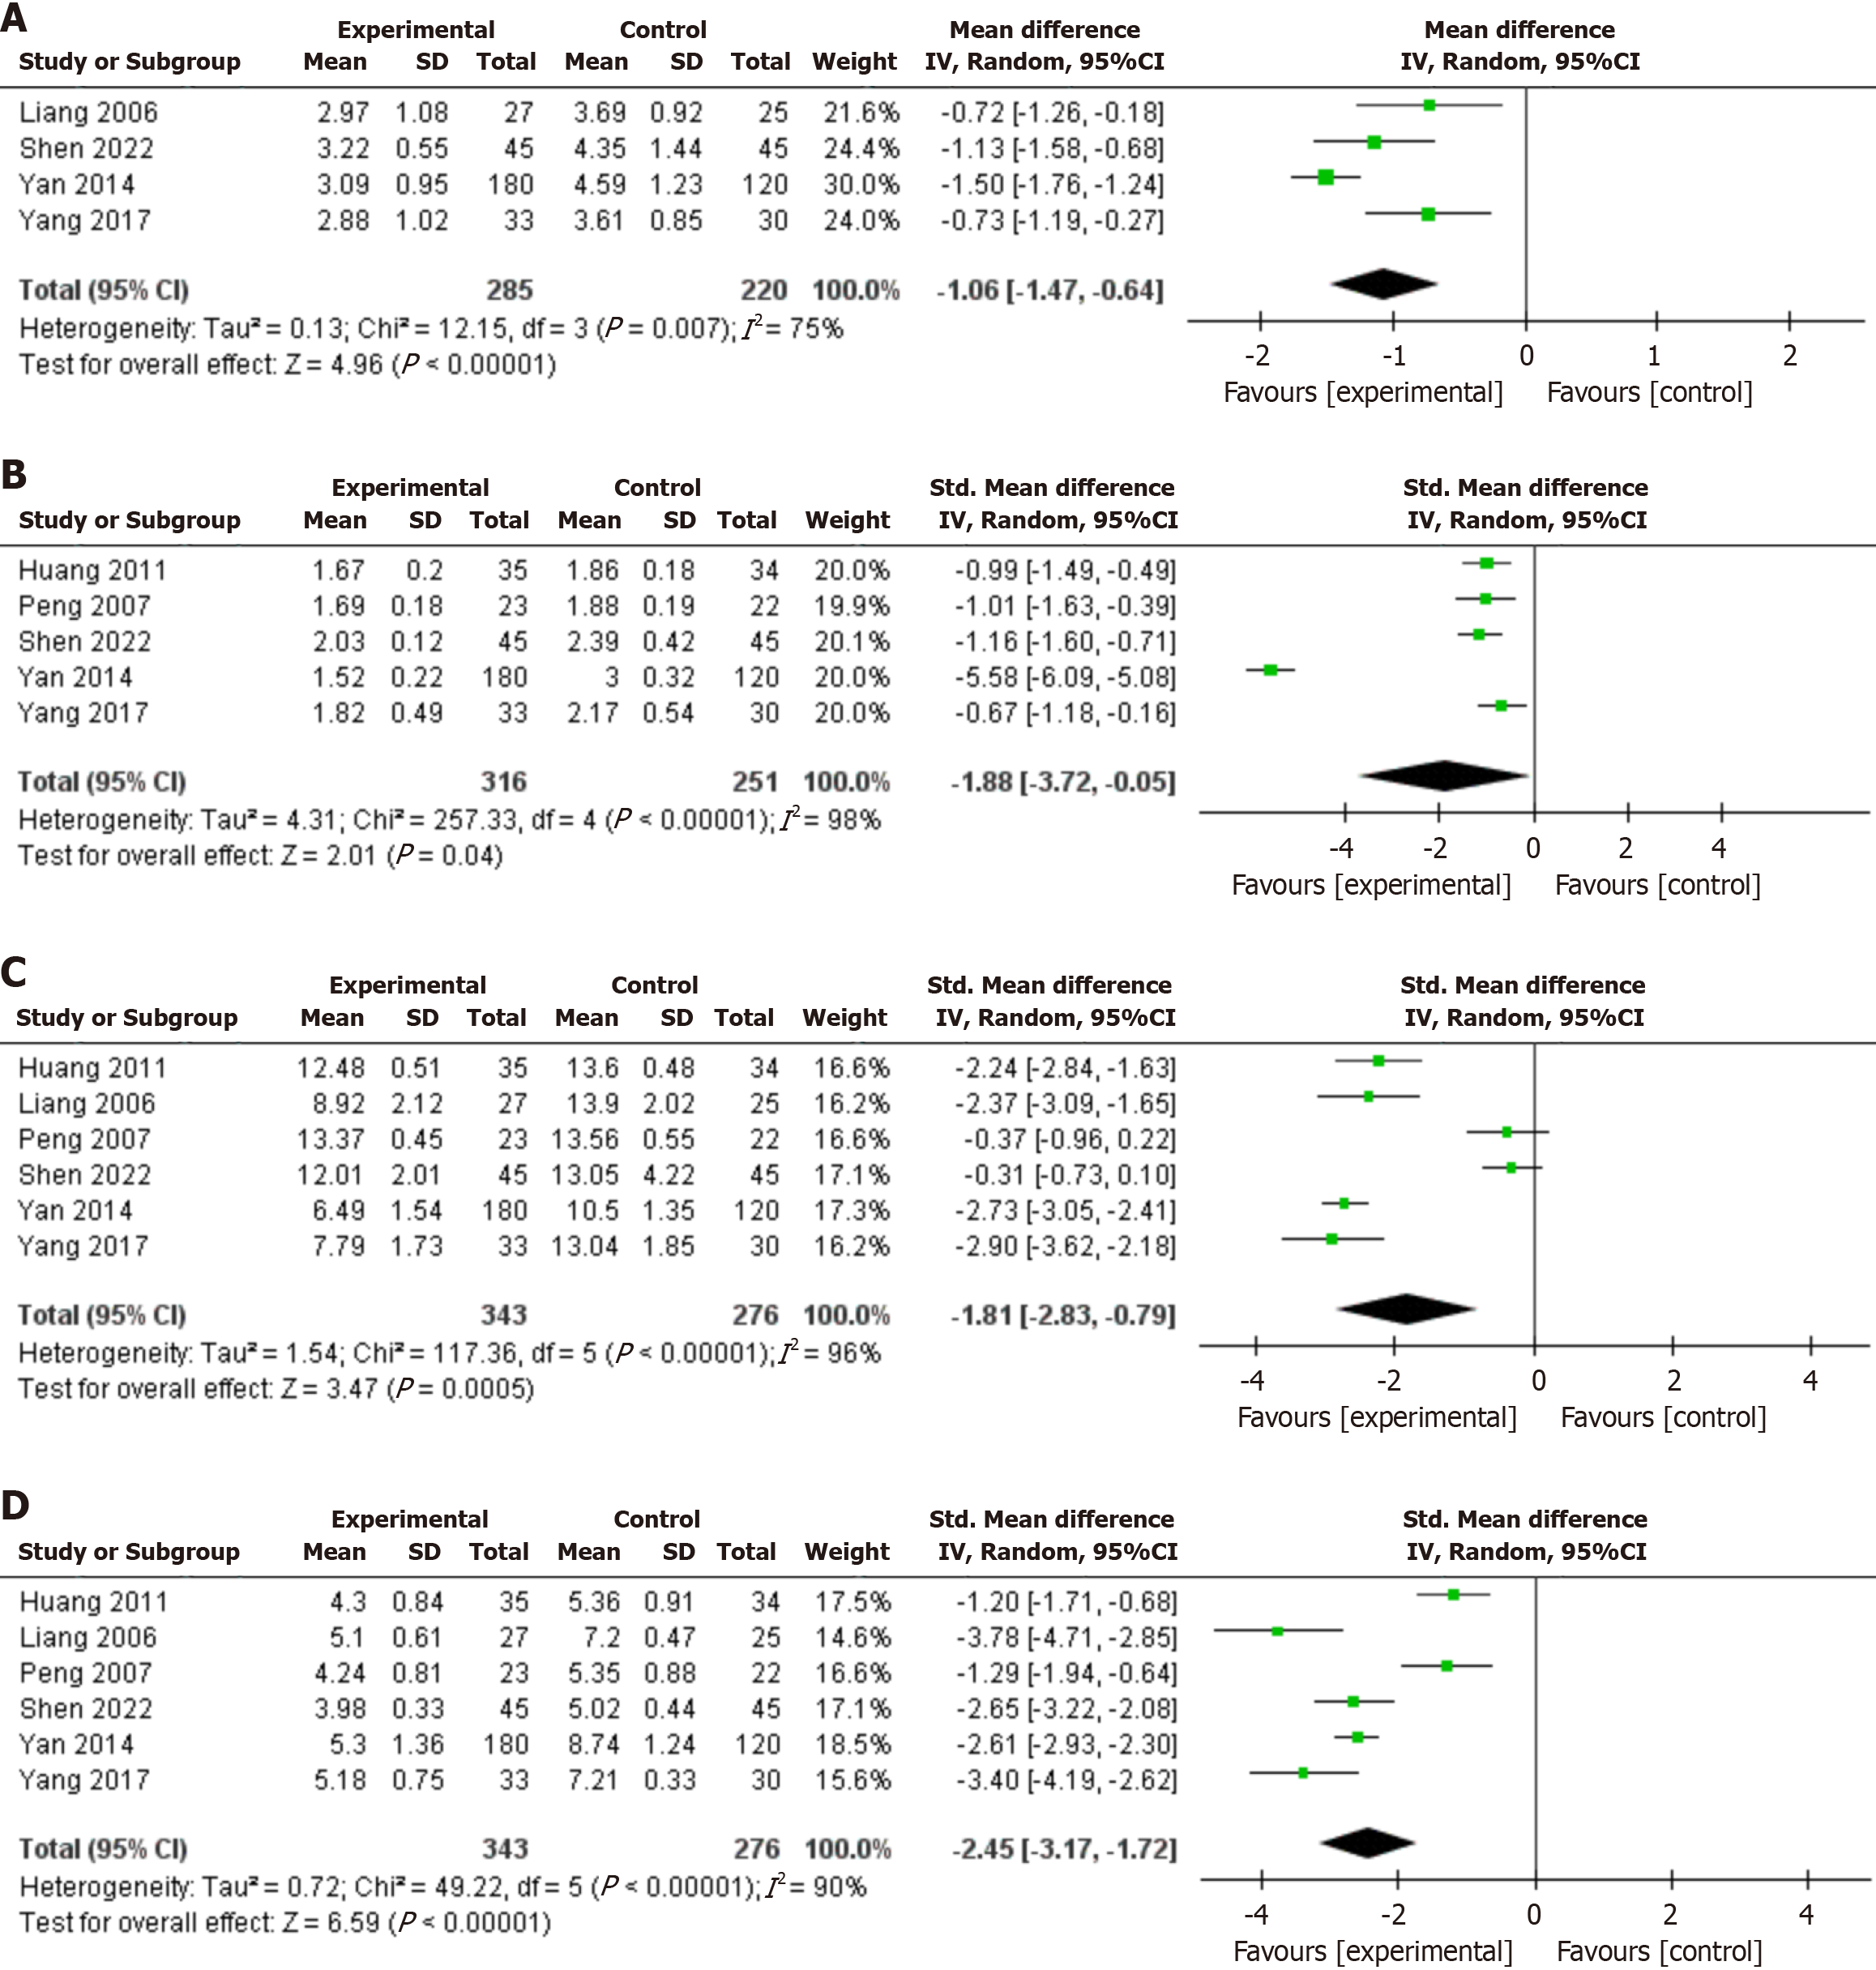
Figure 4 Forest plots for the meta-analysis of renal function.
A: Serum creatinine; B: Blood urea nitrogen; C: Β2-microglobulin; D: Cystatin C; E: Creatinine clearance rate.
Figure 5 Forest plots for the meta-analysis of glucose metabolism.
A: Fasting plasma glucose; B: 2-hour postprandial blood glucose; C: Glycosylated hemoglobin.
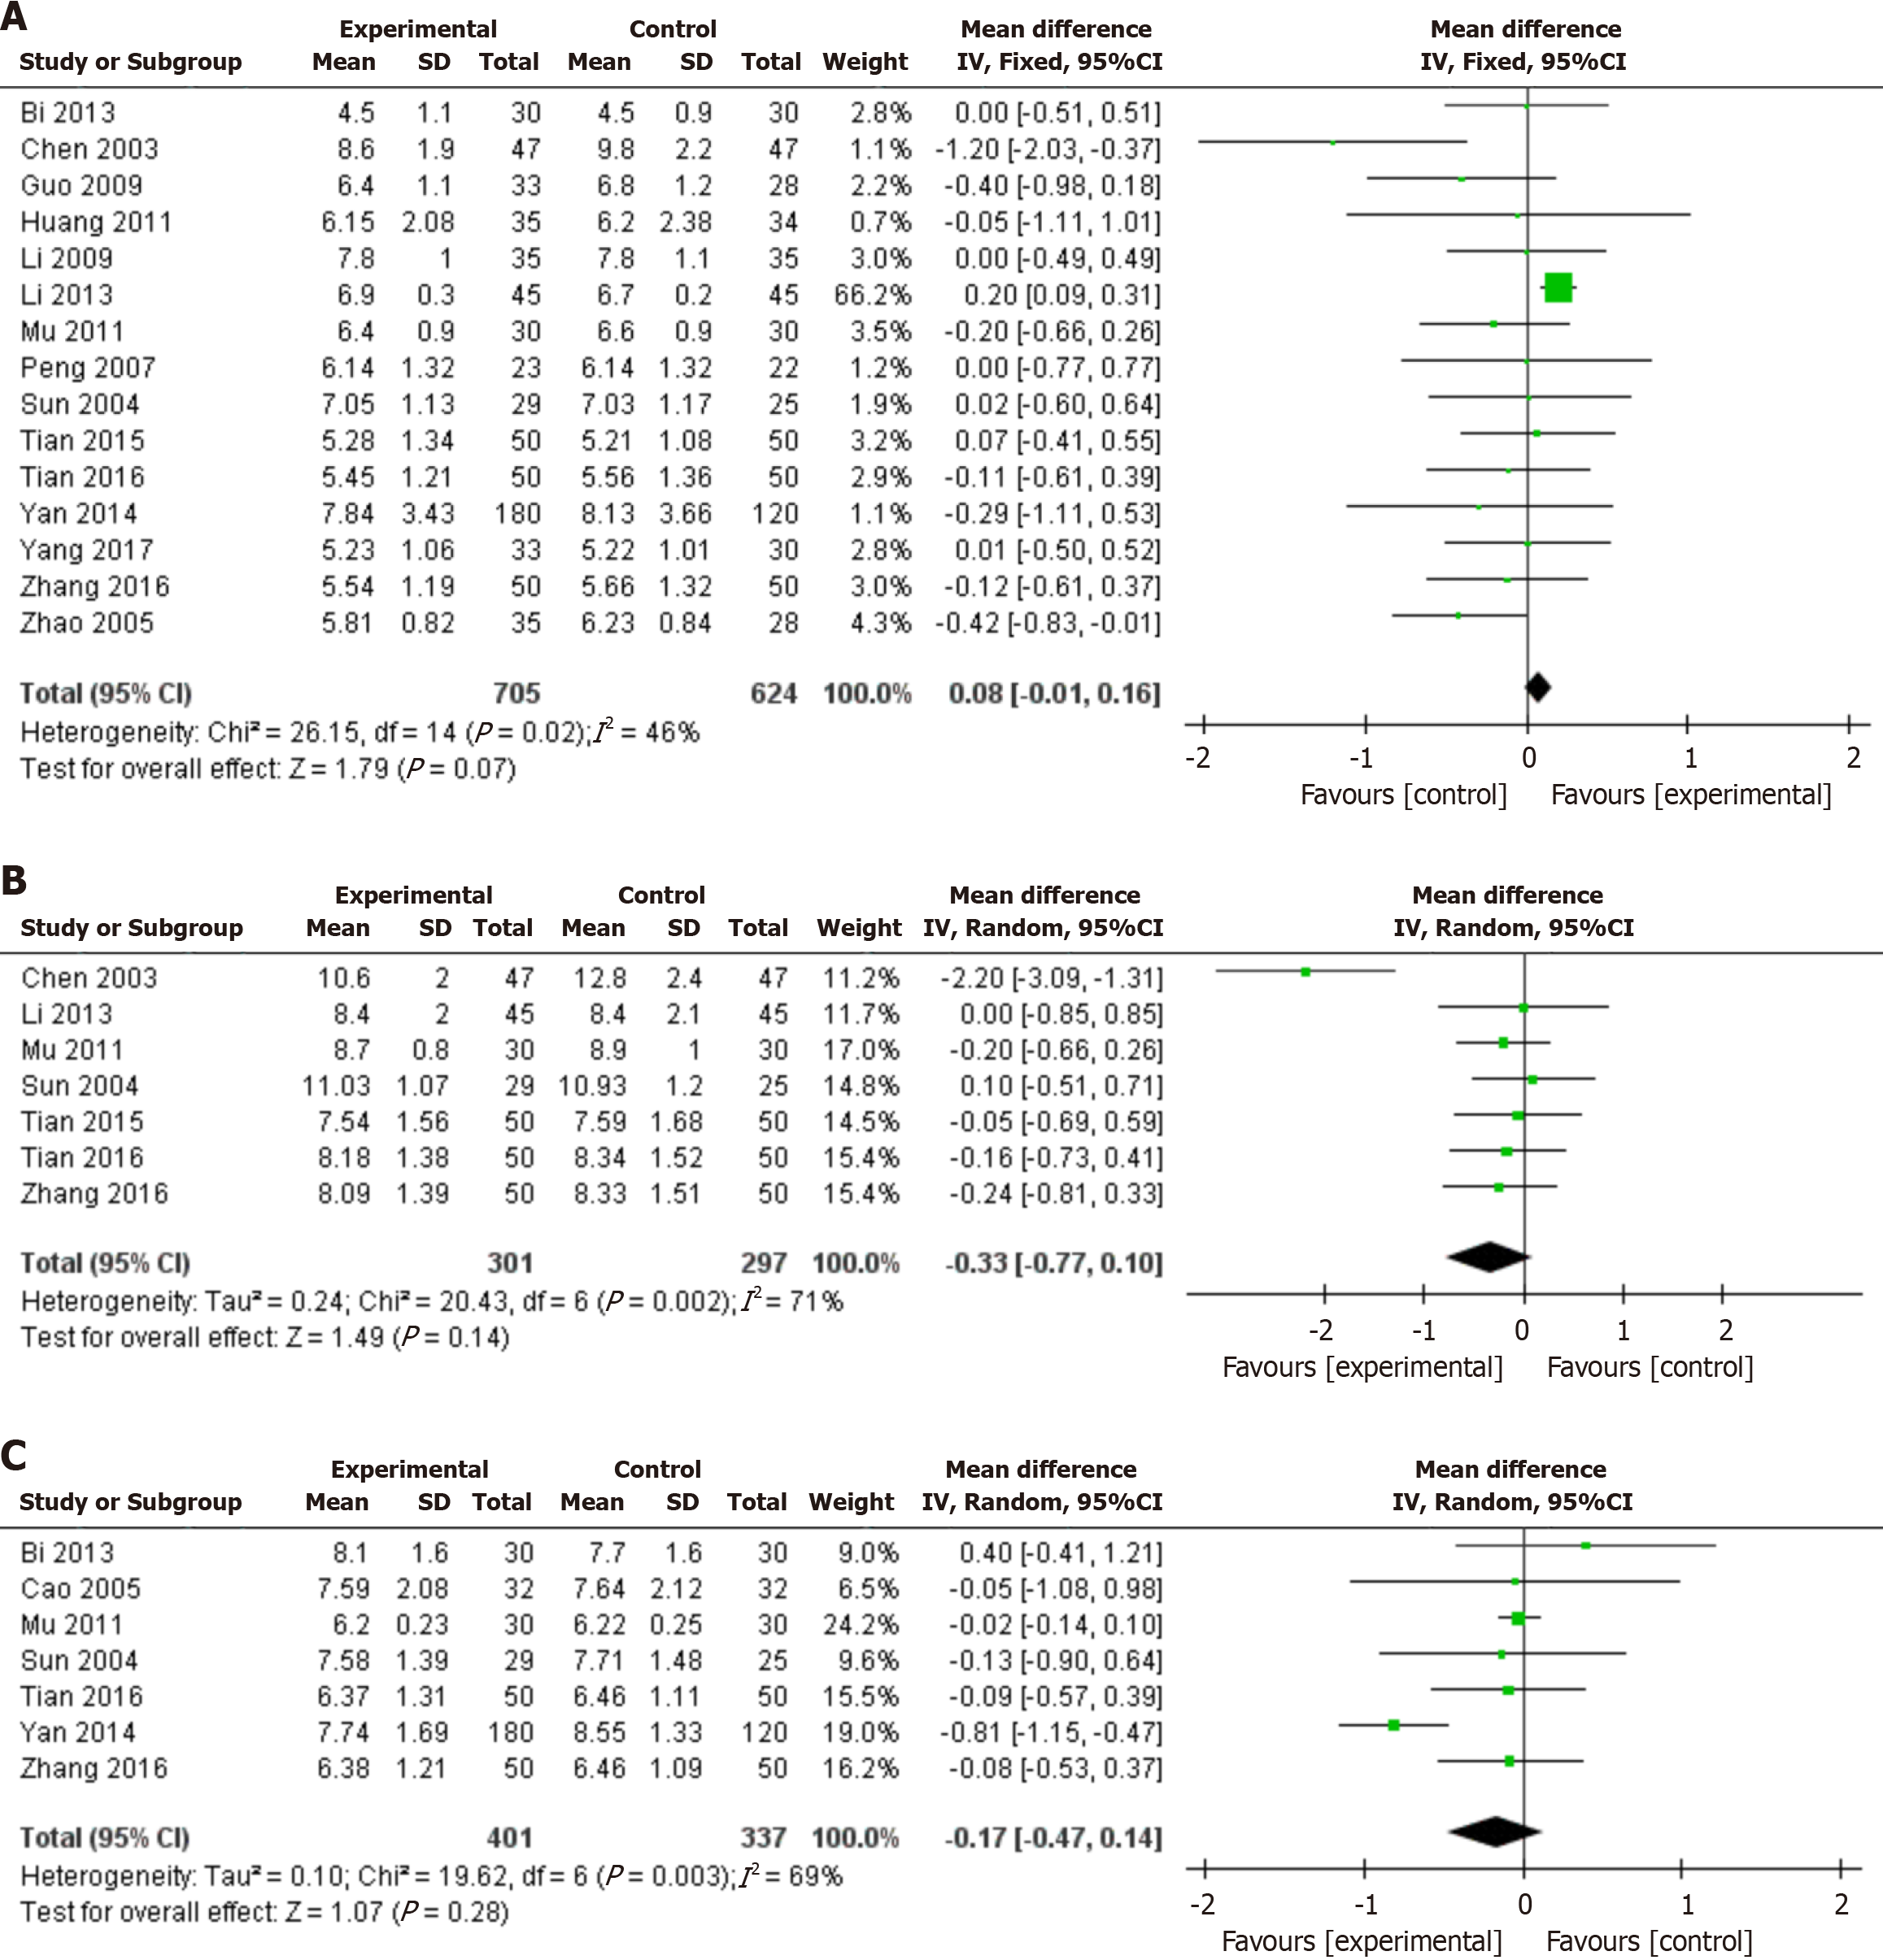
Figure 6 Forest plots for the meta-analysis of lipid metabolism.
A: Total cholesterol; B: Triglycerides; C: Low-density lipoprotein cholesterol; D: High-density lipoprotein cholesterol.
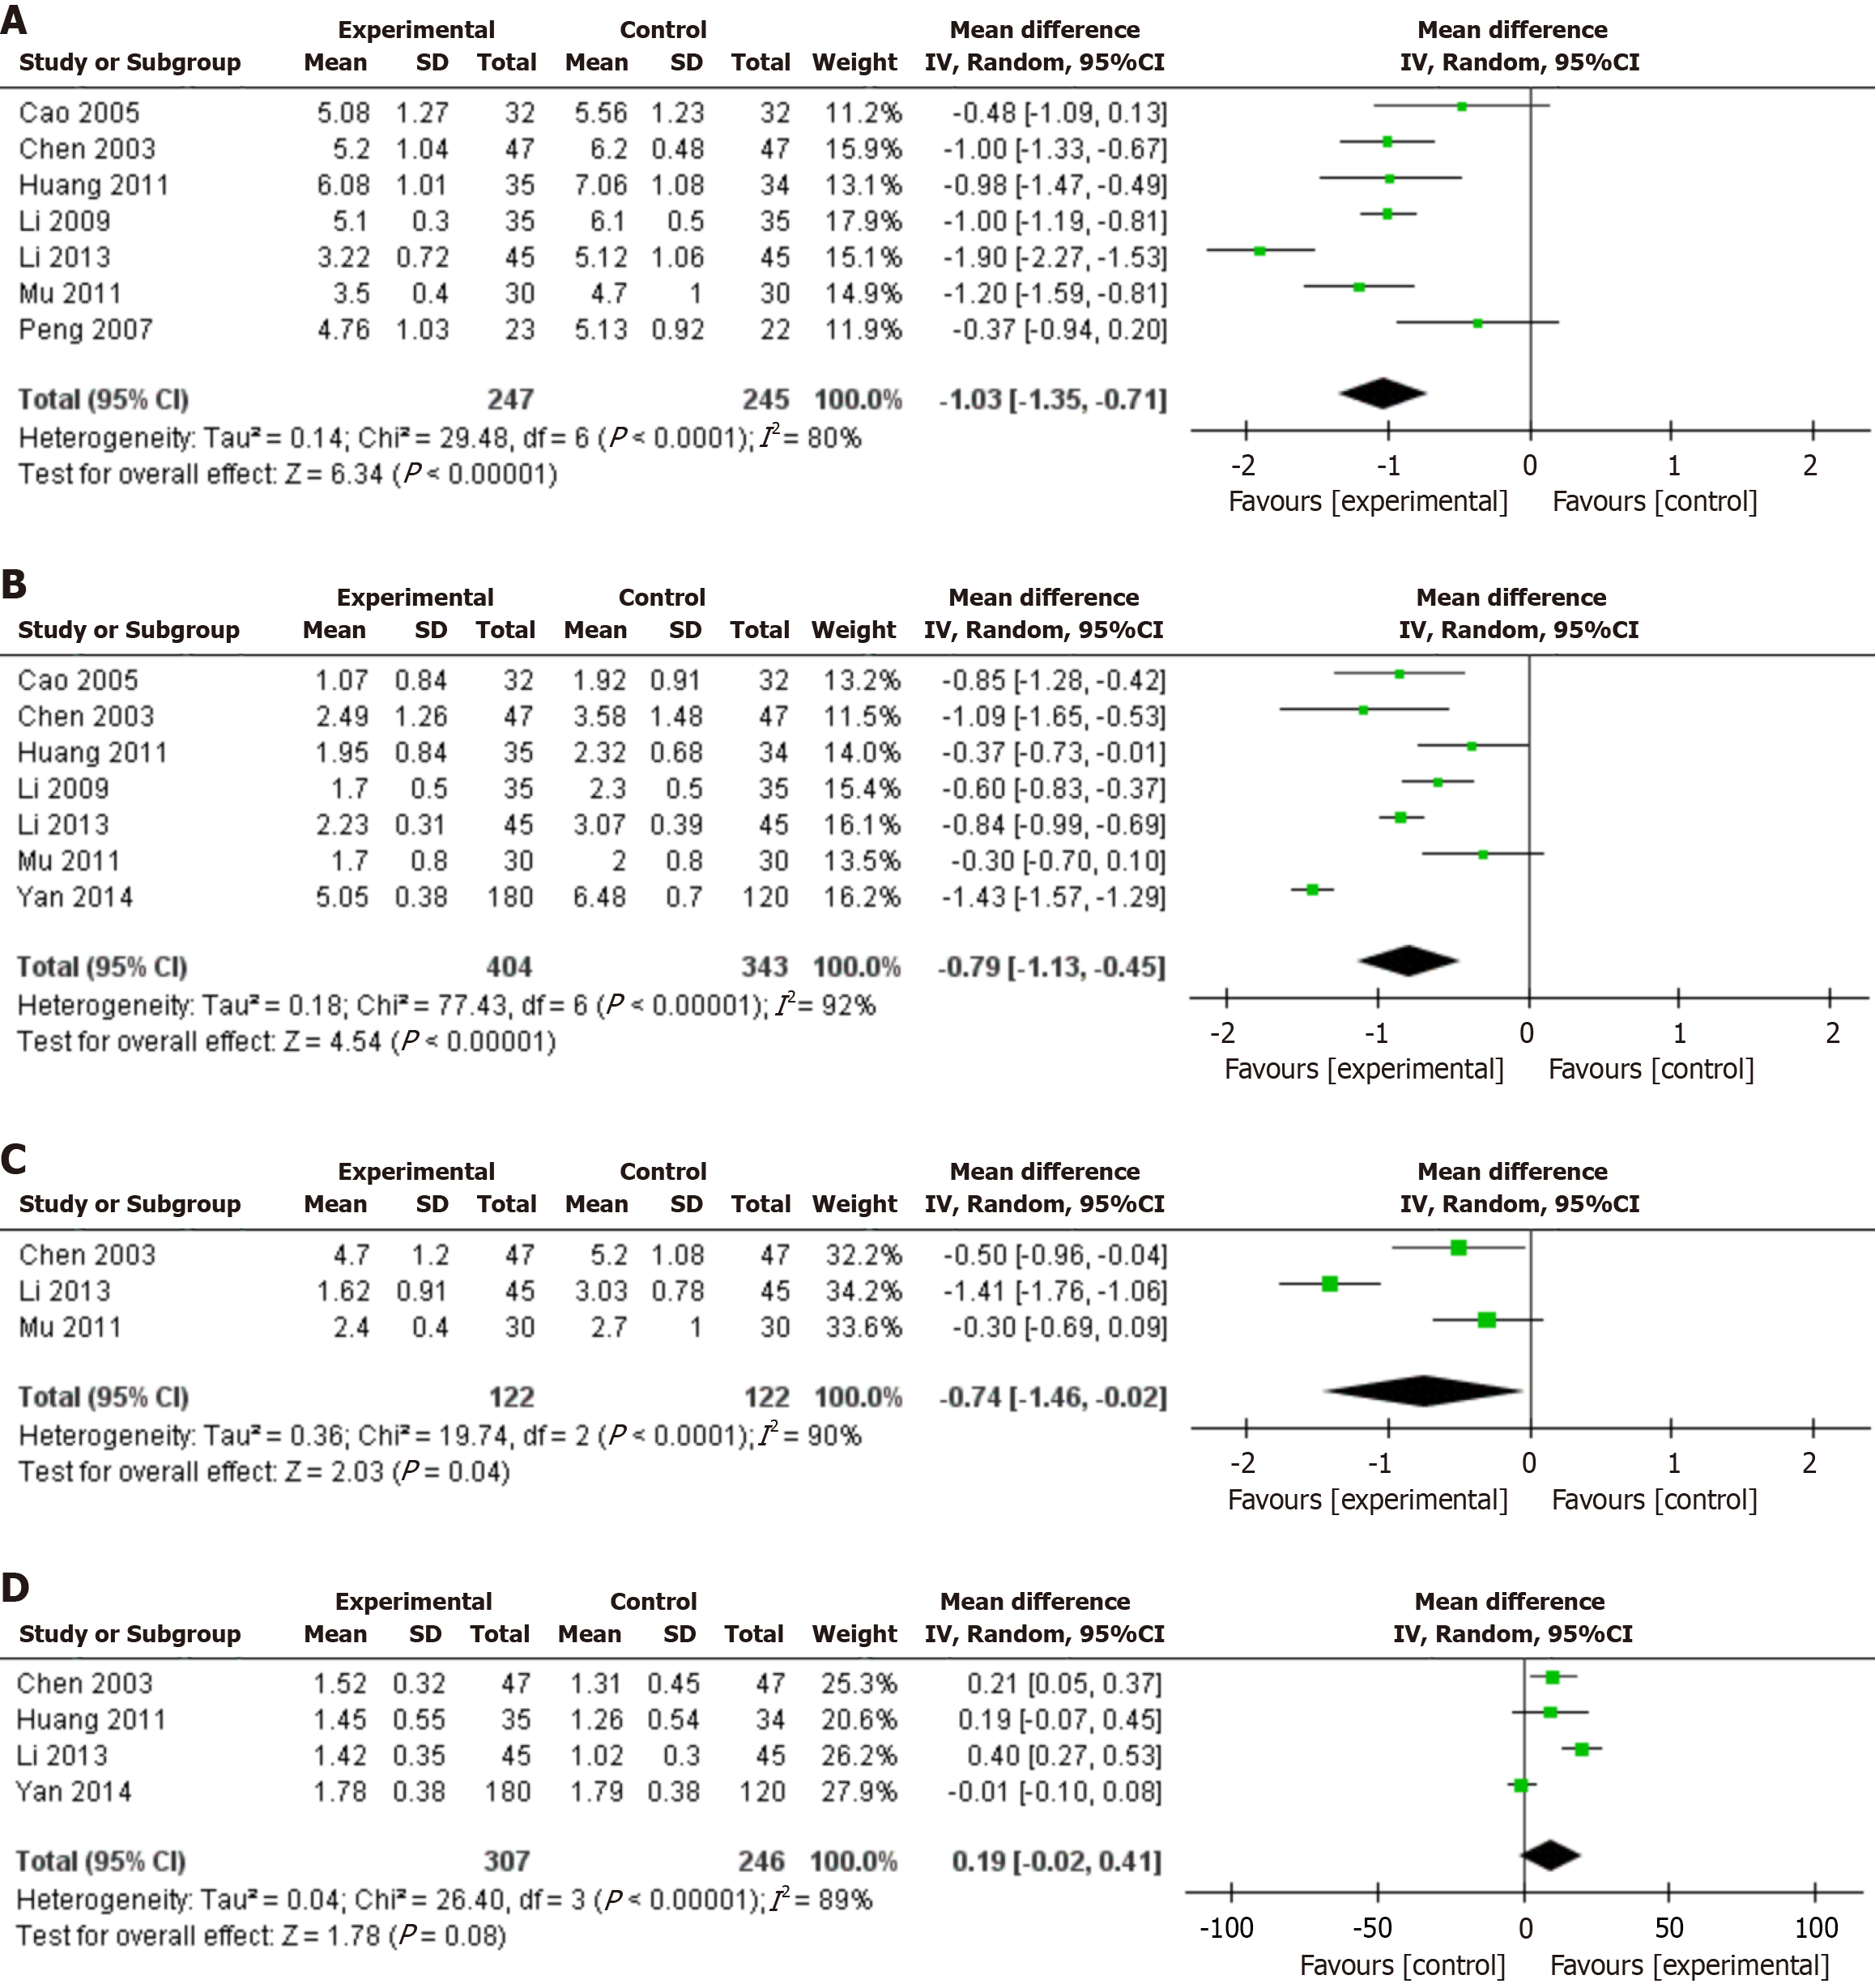
Figure 7 Forest plots for the meta-analysis of hemorheology.
A: Fibrinogen; B: Plasma viscosity; C: Whole blood low shear viscosity; D: Whole blood high shear viscosity.
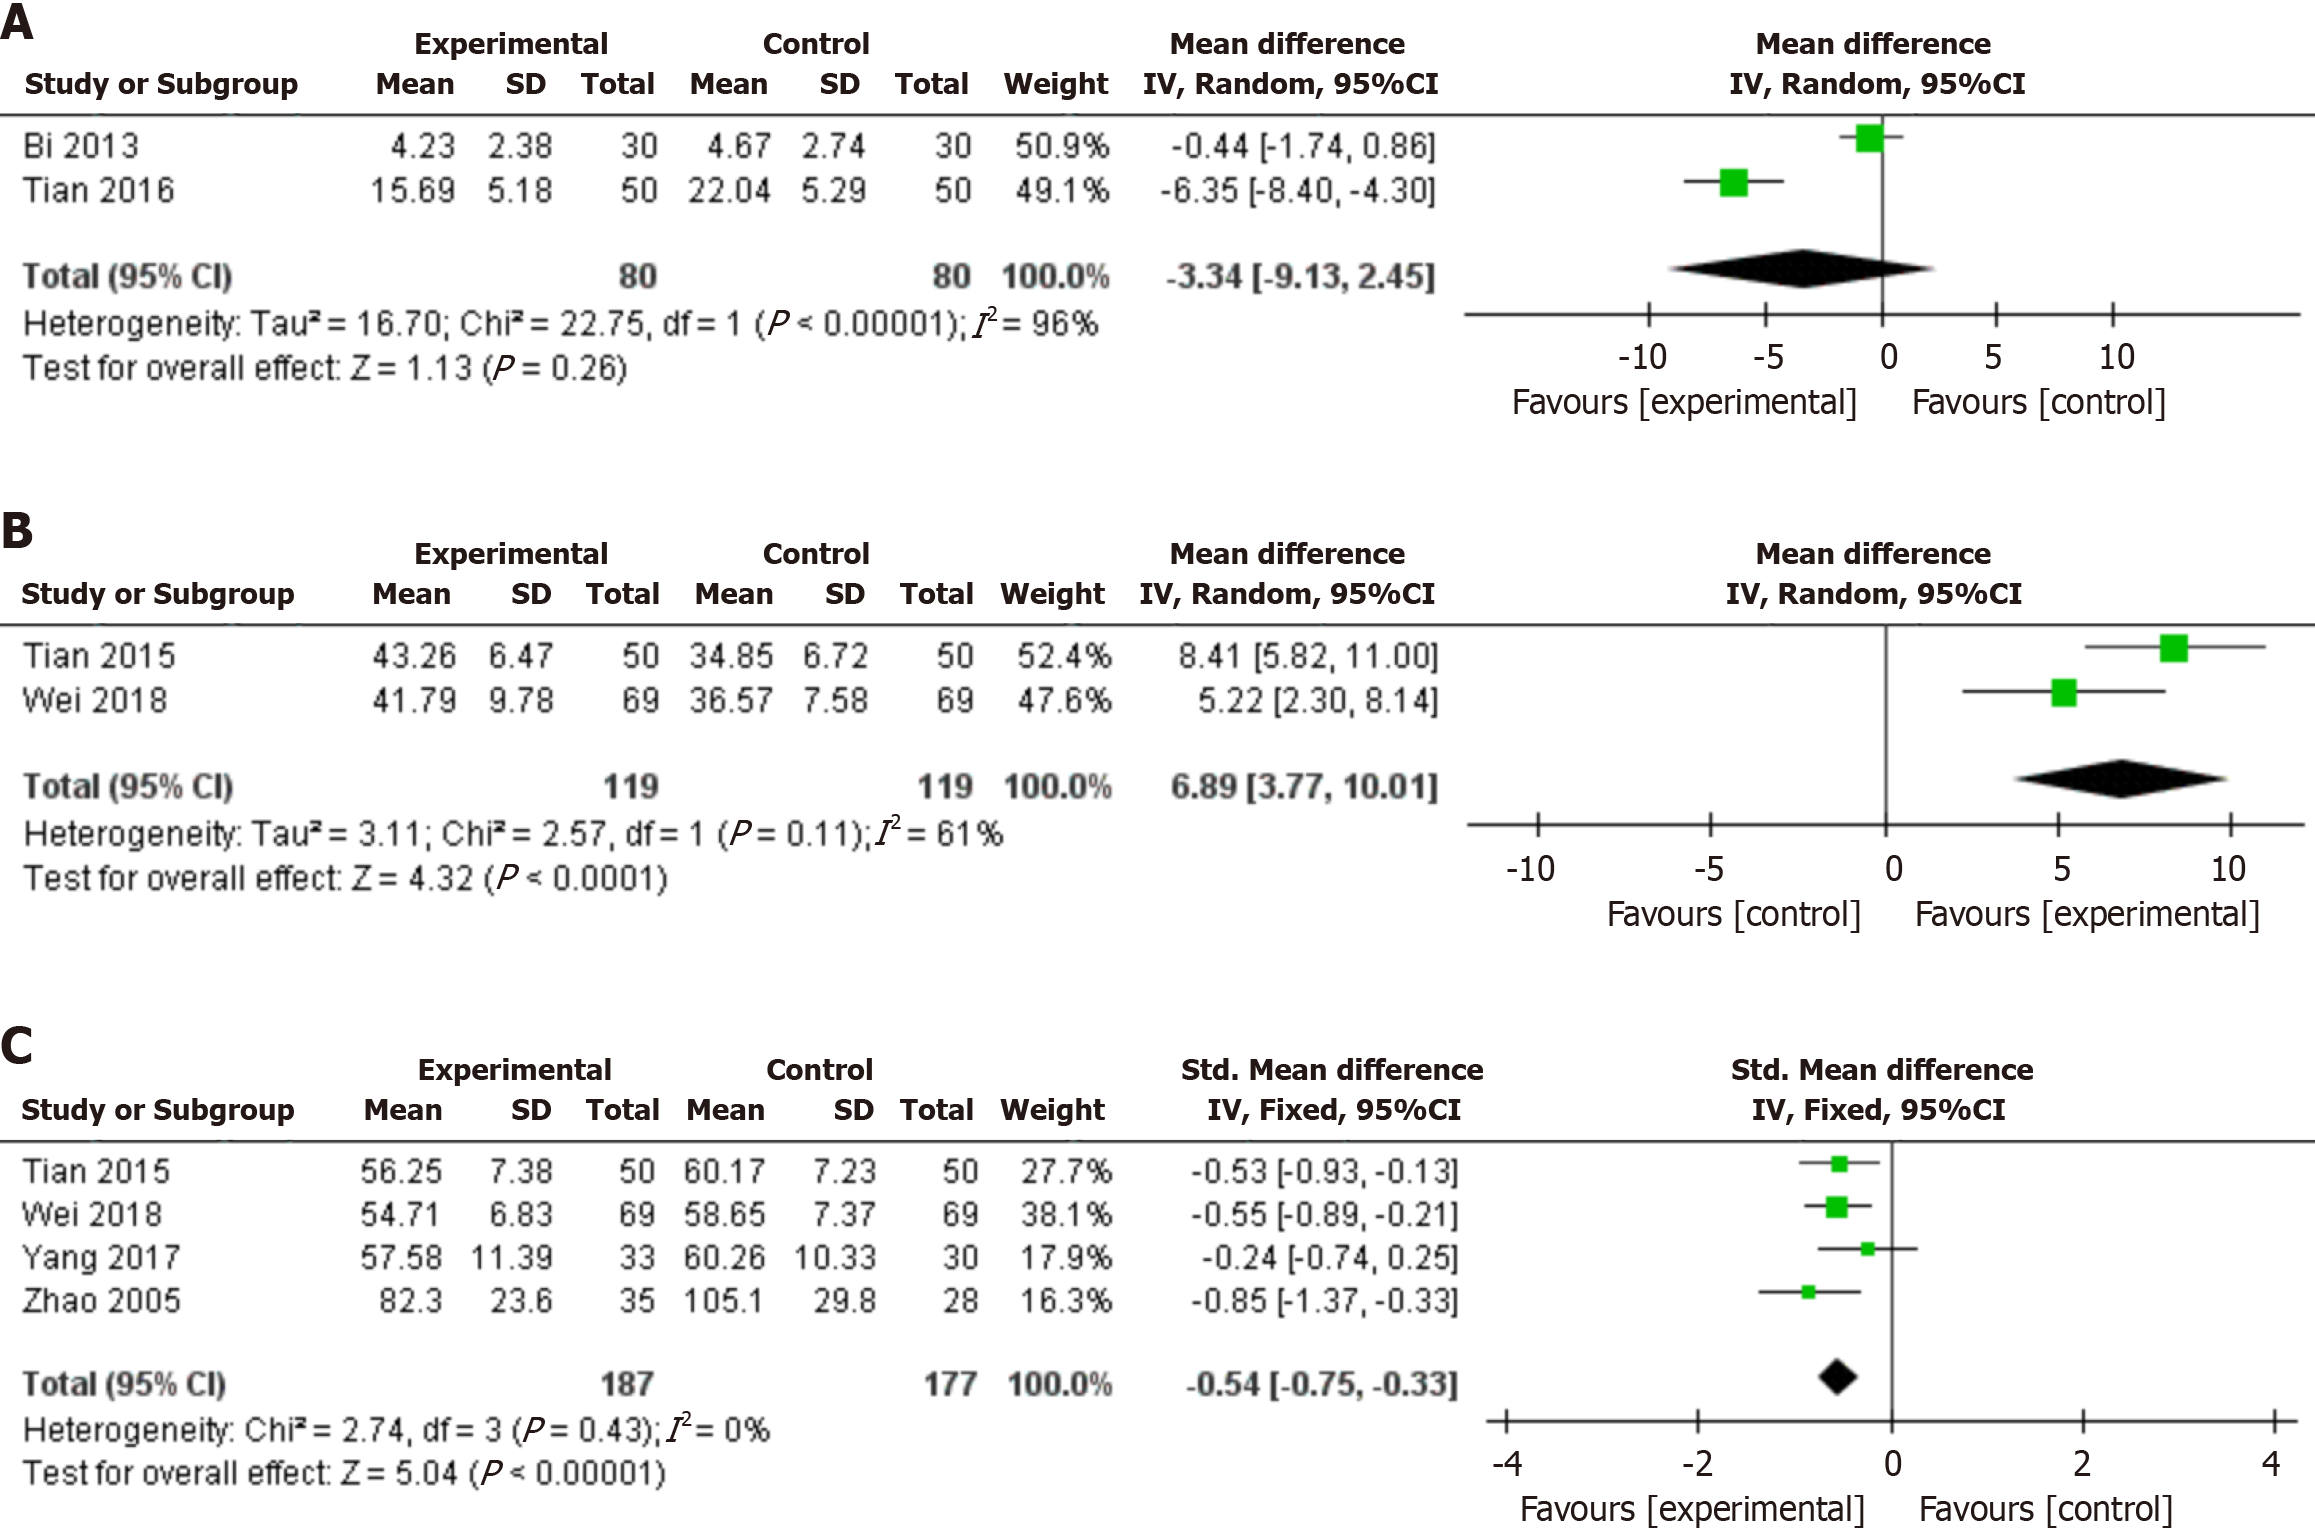
Figure 8 Forest plots for the meta-analysis of inflammation and vascular endothelial function.
A: C-reactive protein; B: Nitric oxide; C: Endothelin-1.
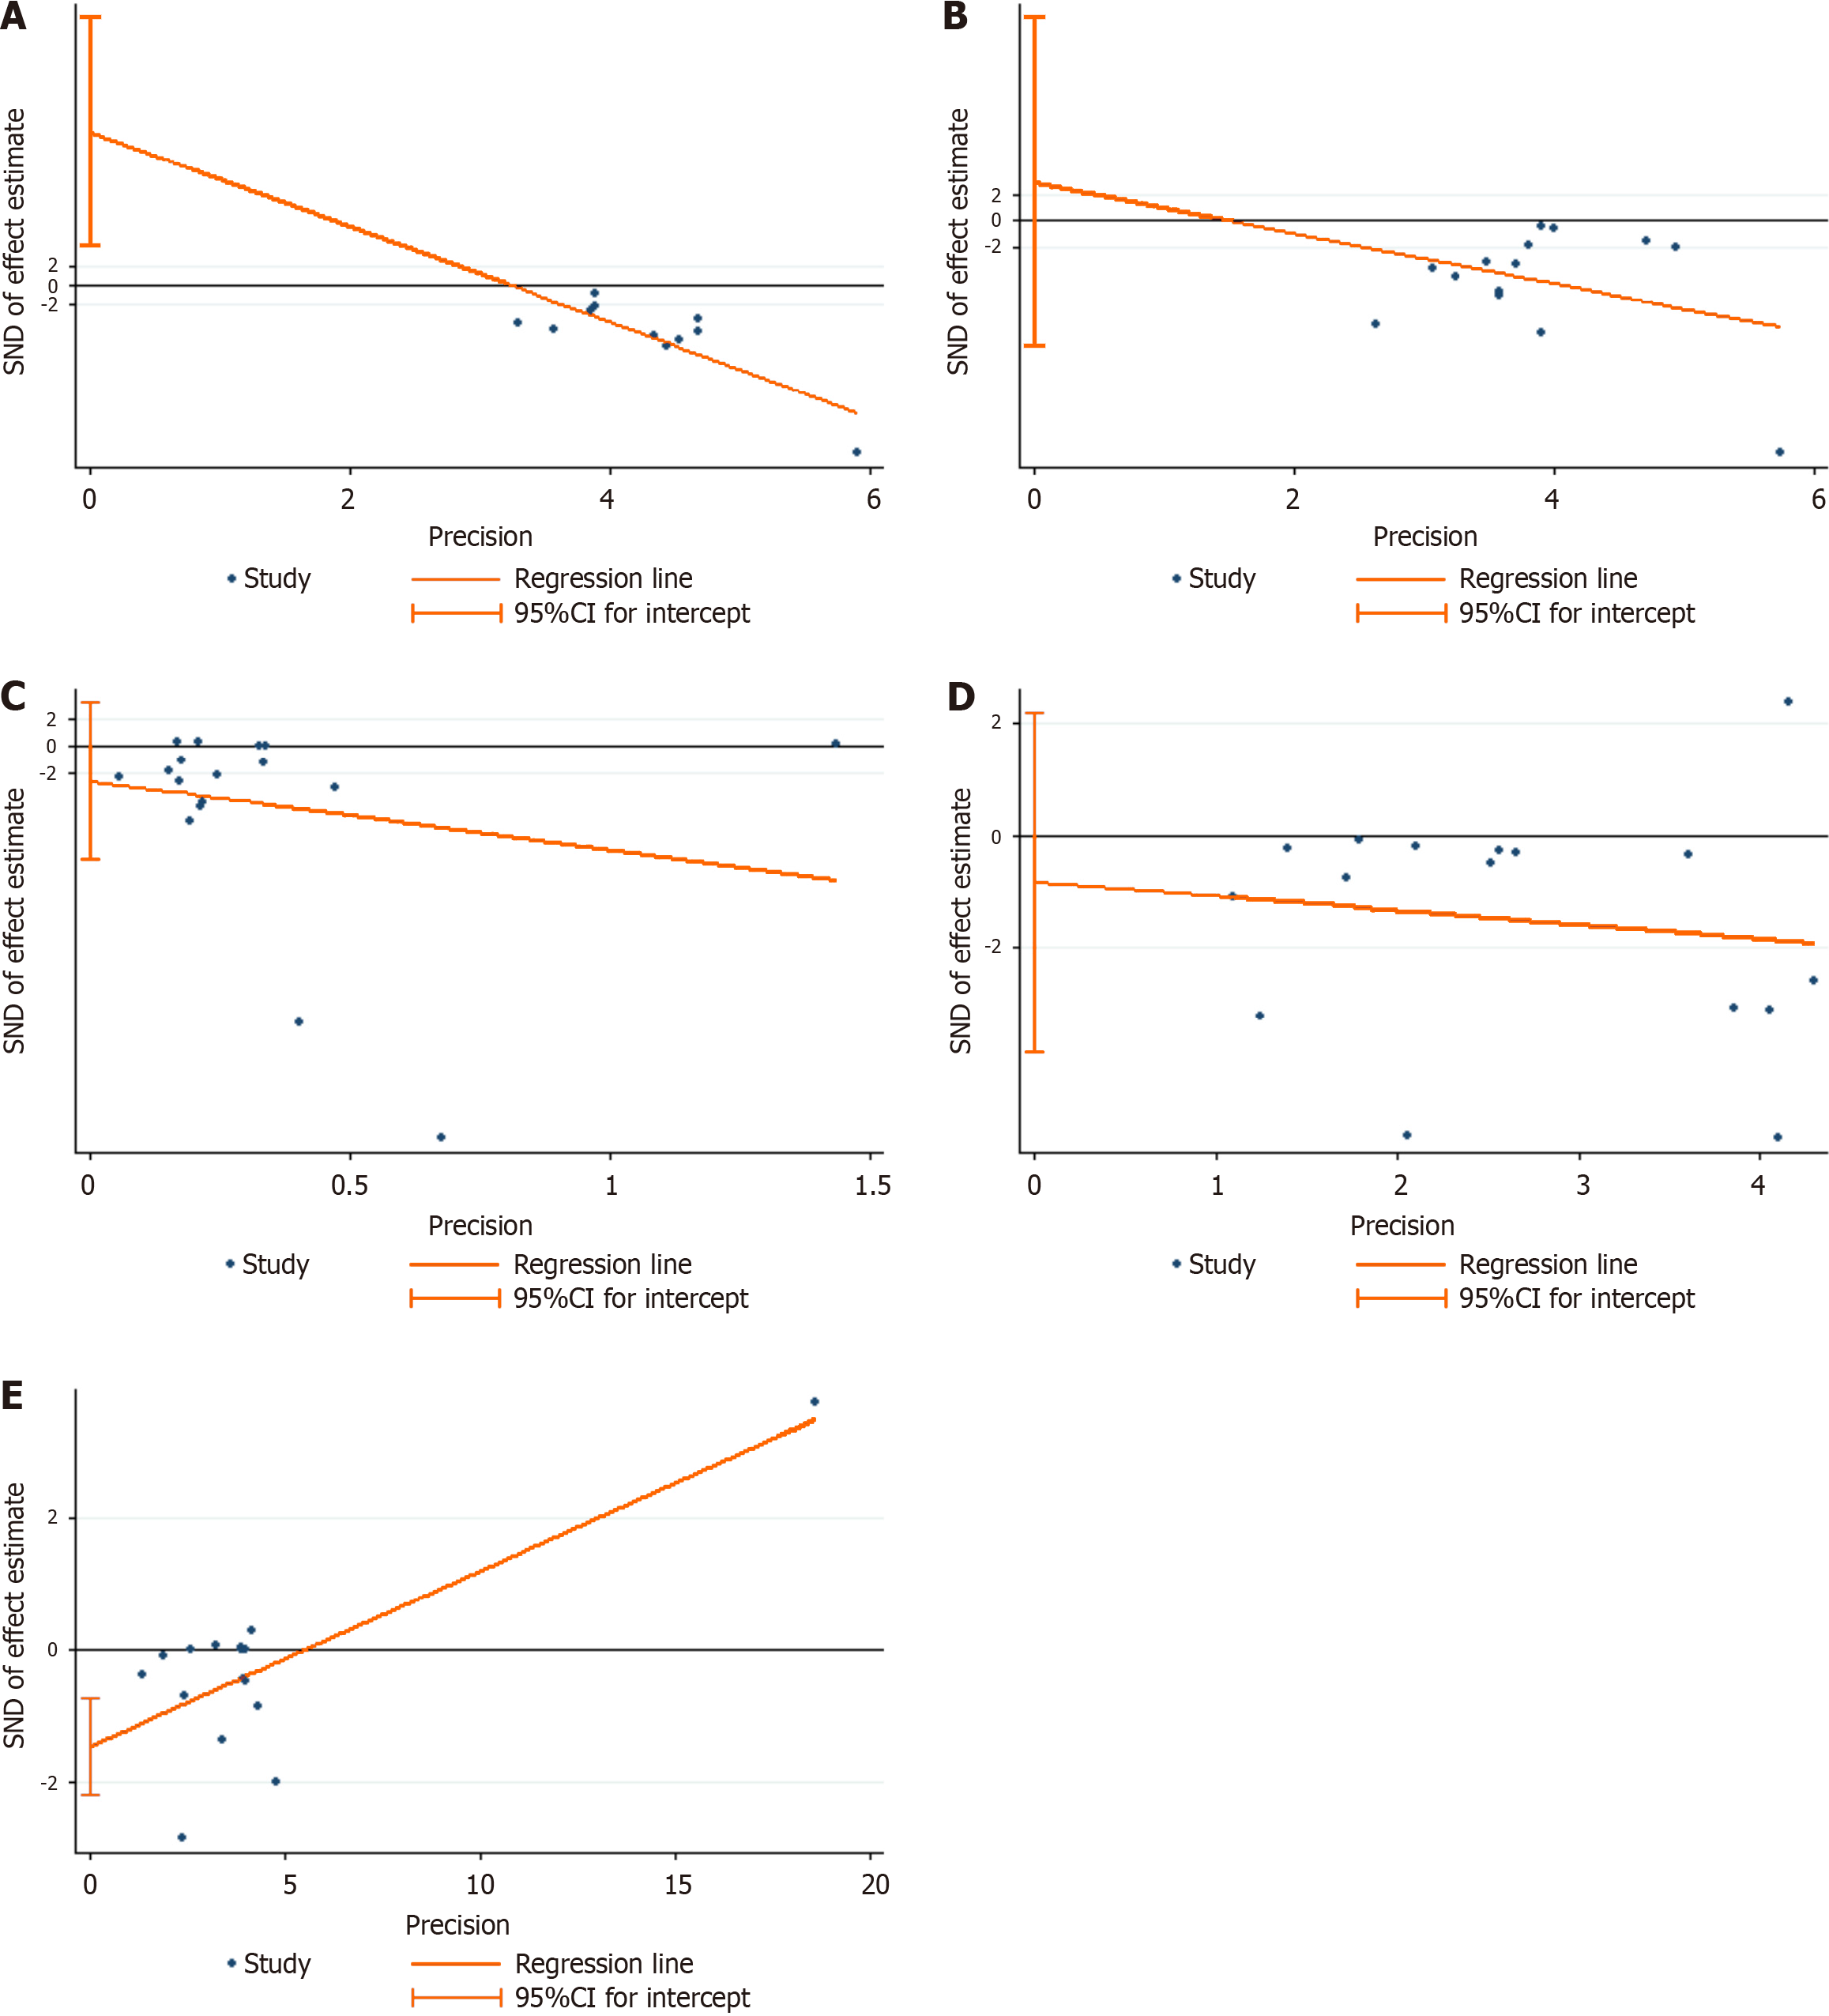
Figure 9 Publication bias analysis.
A: 24-hour urine proteinuria; B: Urinary albumin excretion rate; C: Serum creatinine; D: Blood urea nitrogen; E: Fasting plasma glucose.
- Citation: Wei MY, Jiang YJ, Tang YT, Wang CR, Yin D, Li AJ, Guo JY, Gong YB. Effectiveness and safety of Tongxinluo capsule for diabetic kidney disease: A systematic review and meta-analysis. World J Diabetes 2025; 16(5): 100980
- URL: https://www.wjgnet.com/1948-9358/full/v16/i5/100980.htm
- DOI: https://dx.doi.org/10.4239/wjd.v16.i5.100980


