Copyright
©The Author(s) 2025.
World J Diabetes. Mar 15, 2025; 16(3): 98519
Published online Mar 15, 2025. doi: 10.4239/wjd.v16.i3.98519
Published online Mar 15, 2025. doi: 10.4239/wjd.v16.i3.98519
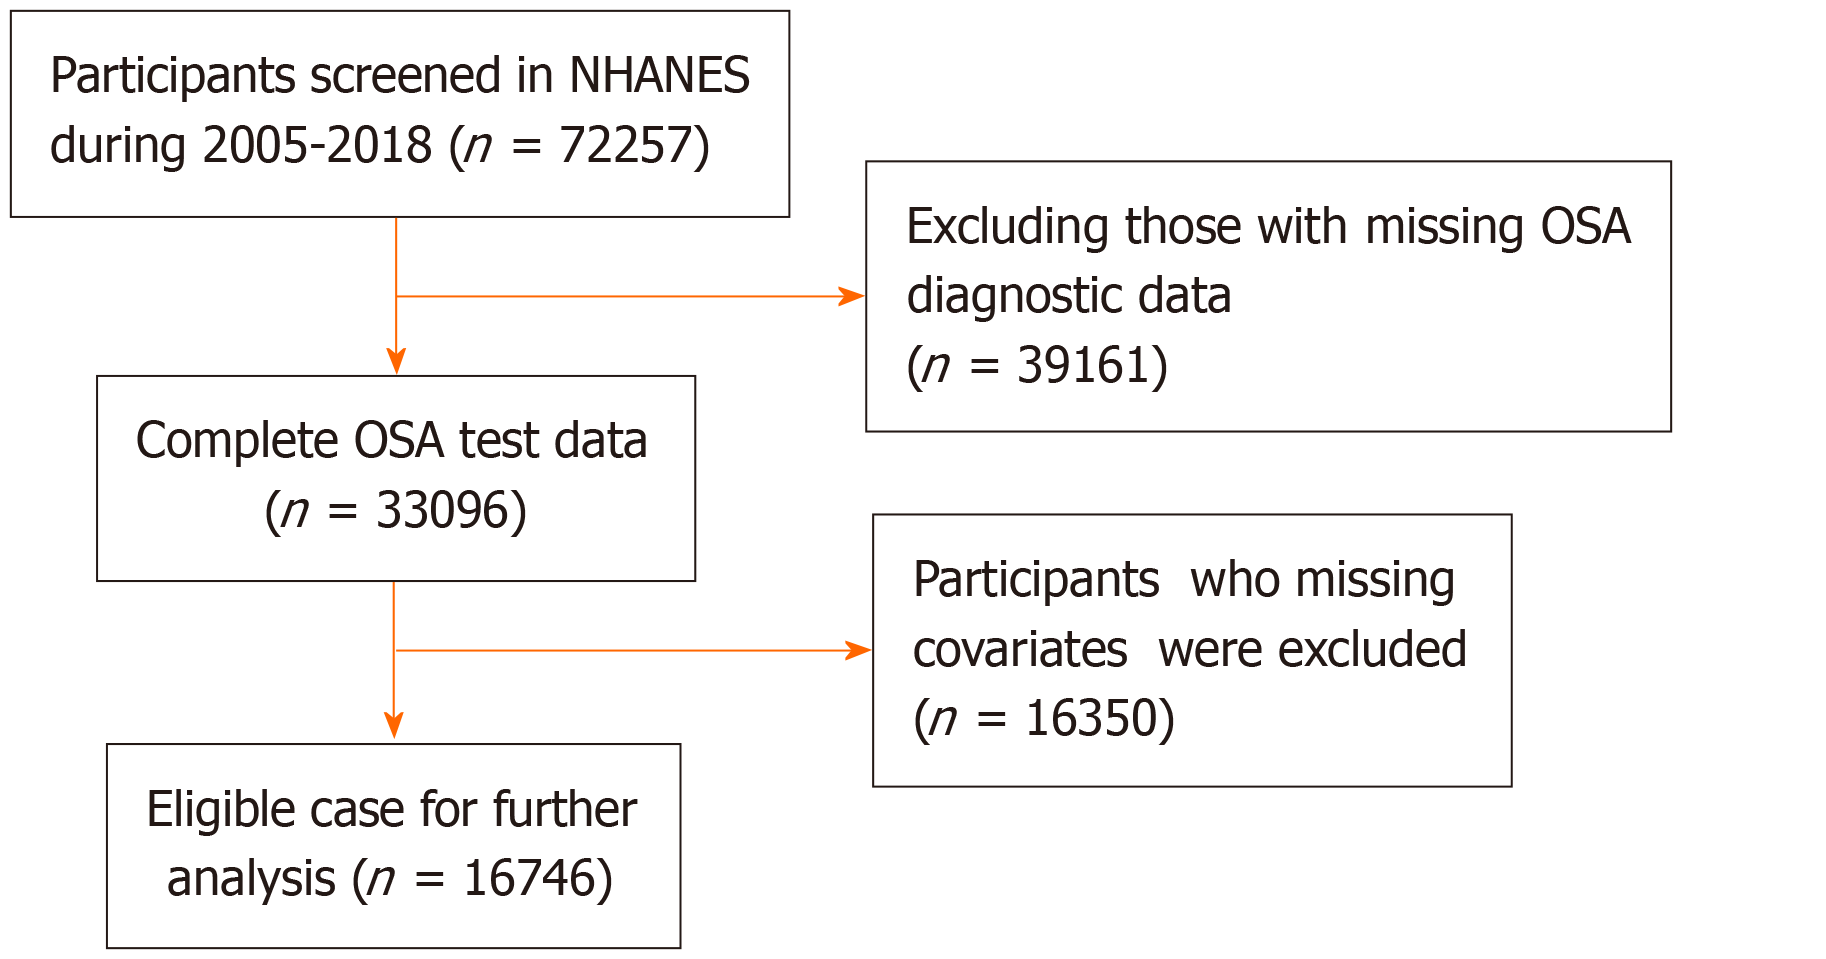
Figure 1 Flow chart of sample selection from National Health and Nutrition Examination Surveys 2005-2018.
NHANES: National Health and Nutrition Examination Surveys; OSA: Obstructive sleep apnea.
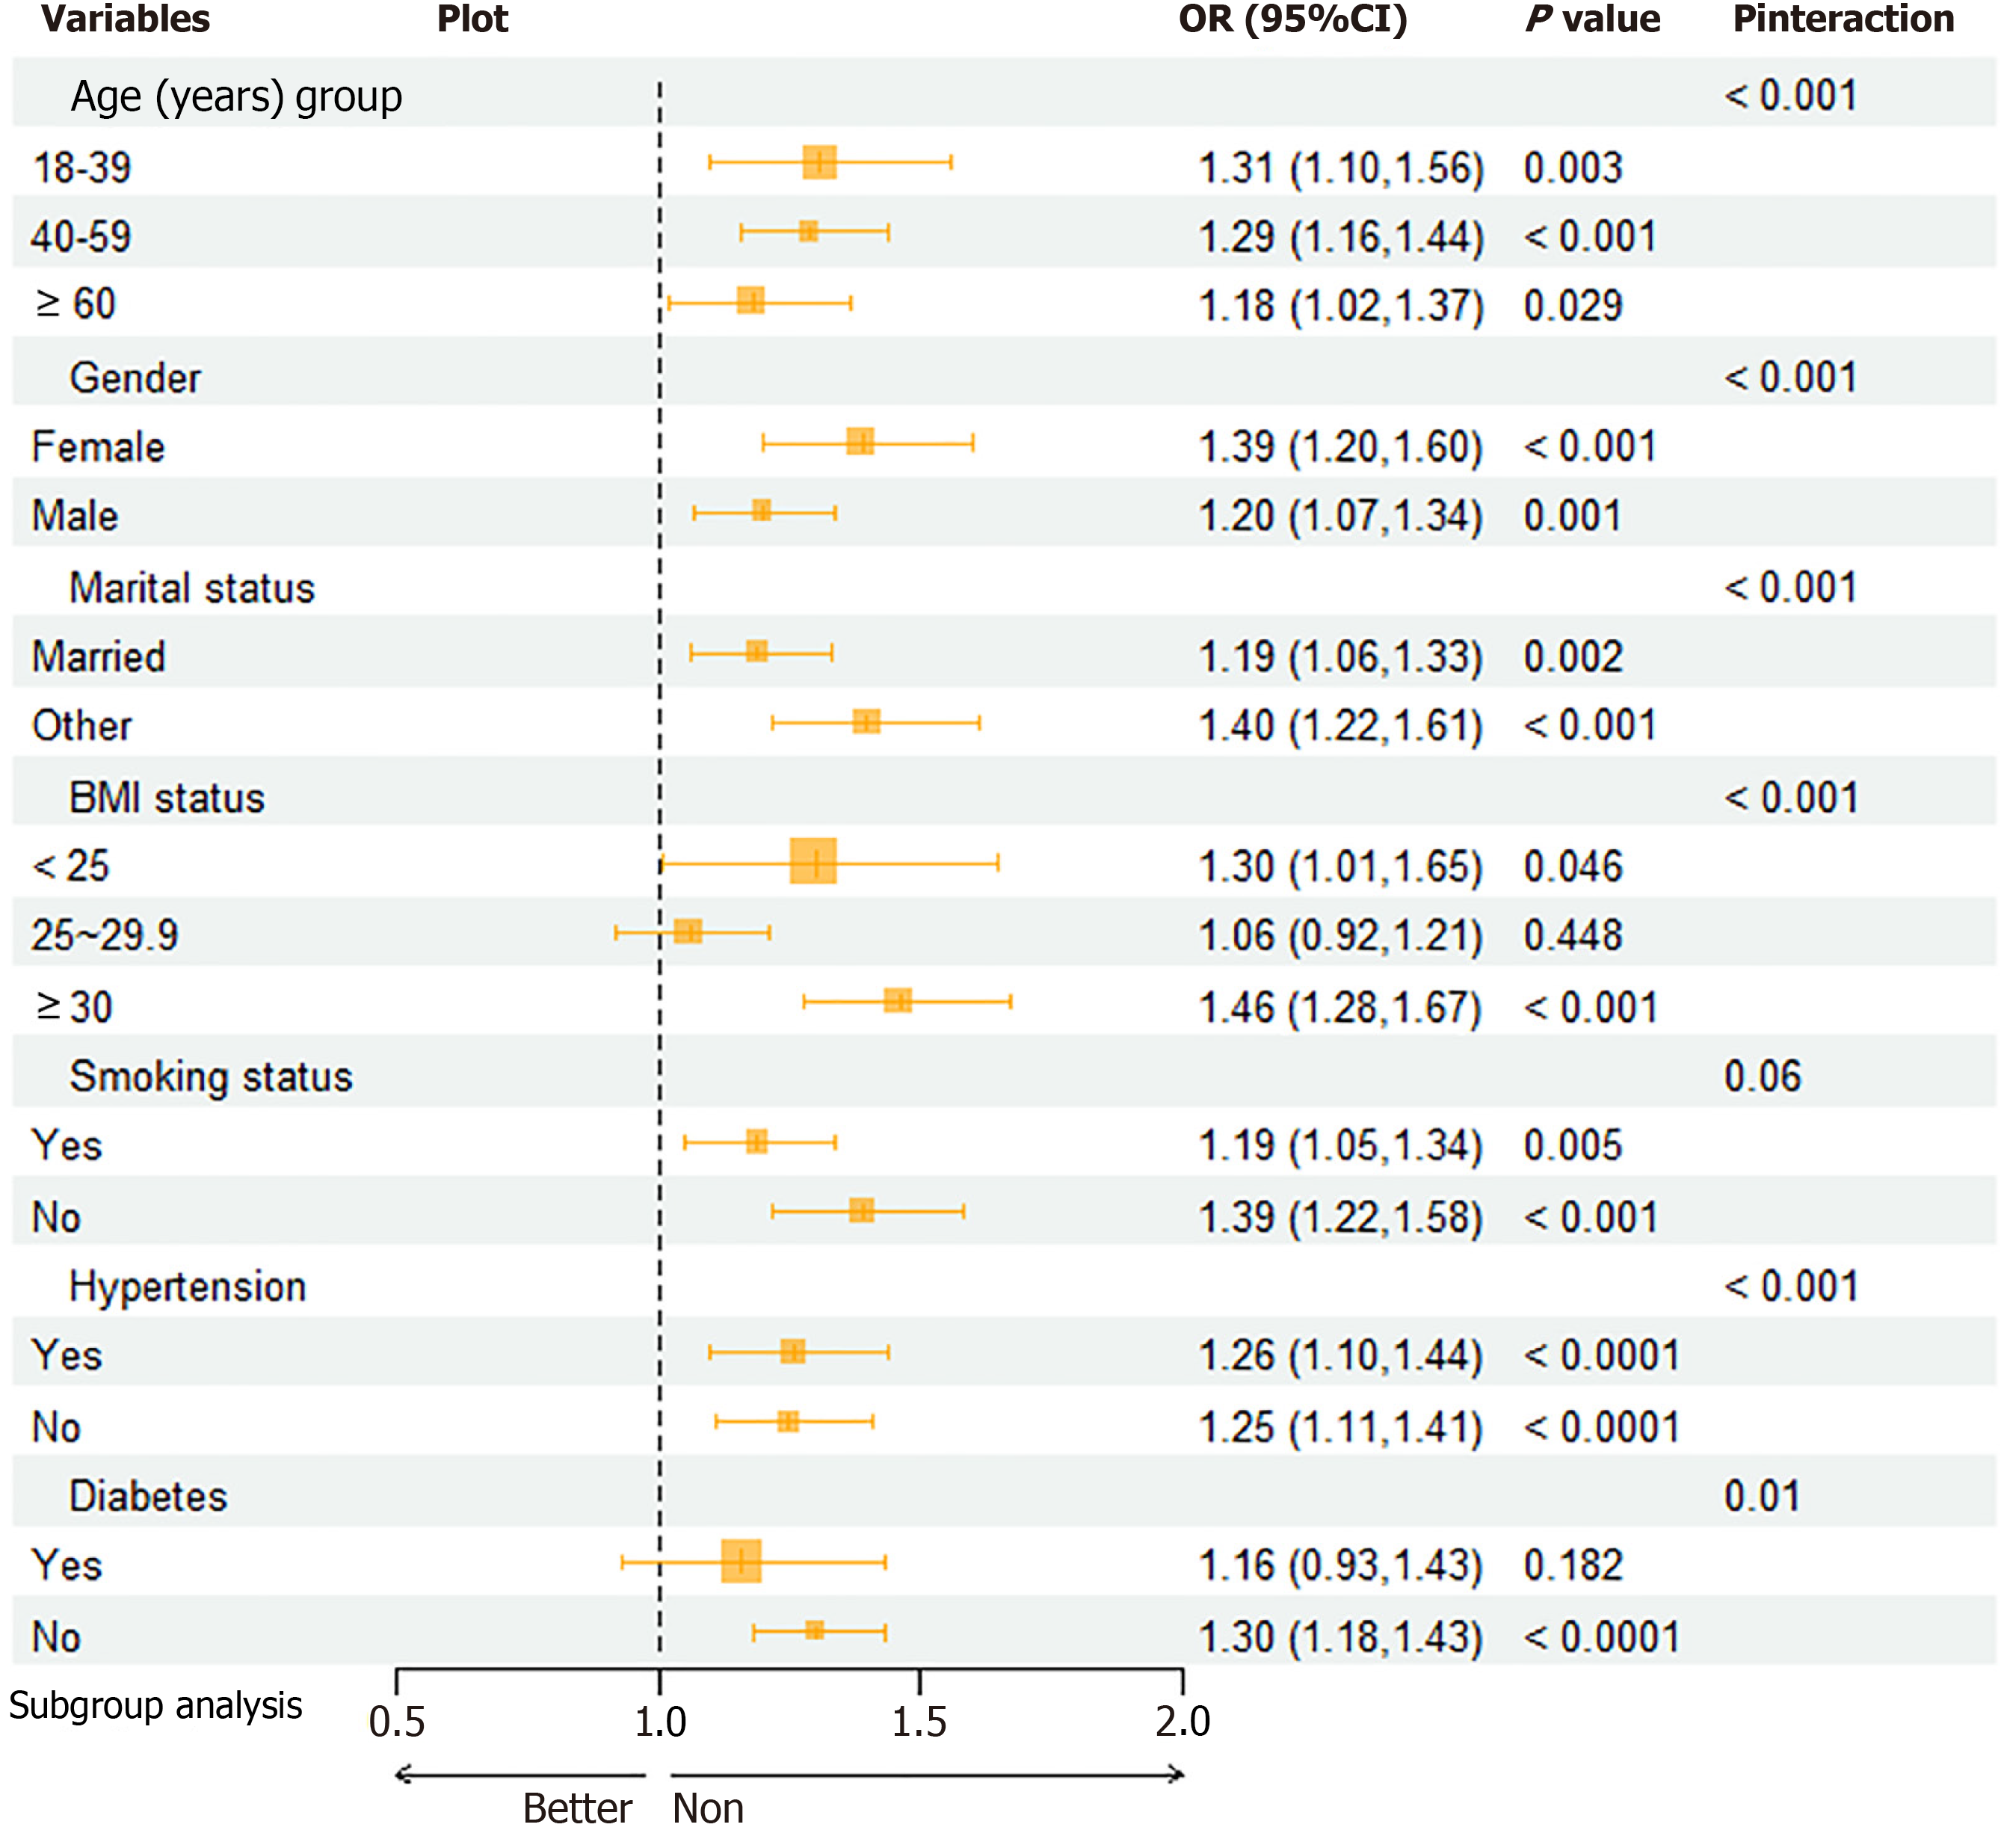
Figure 2 Forest map of association between triglyceride glucose-body mass index and obstructive sleep apnea.
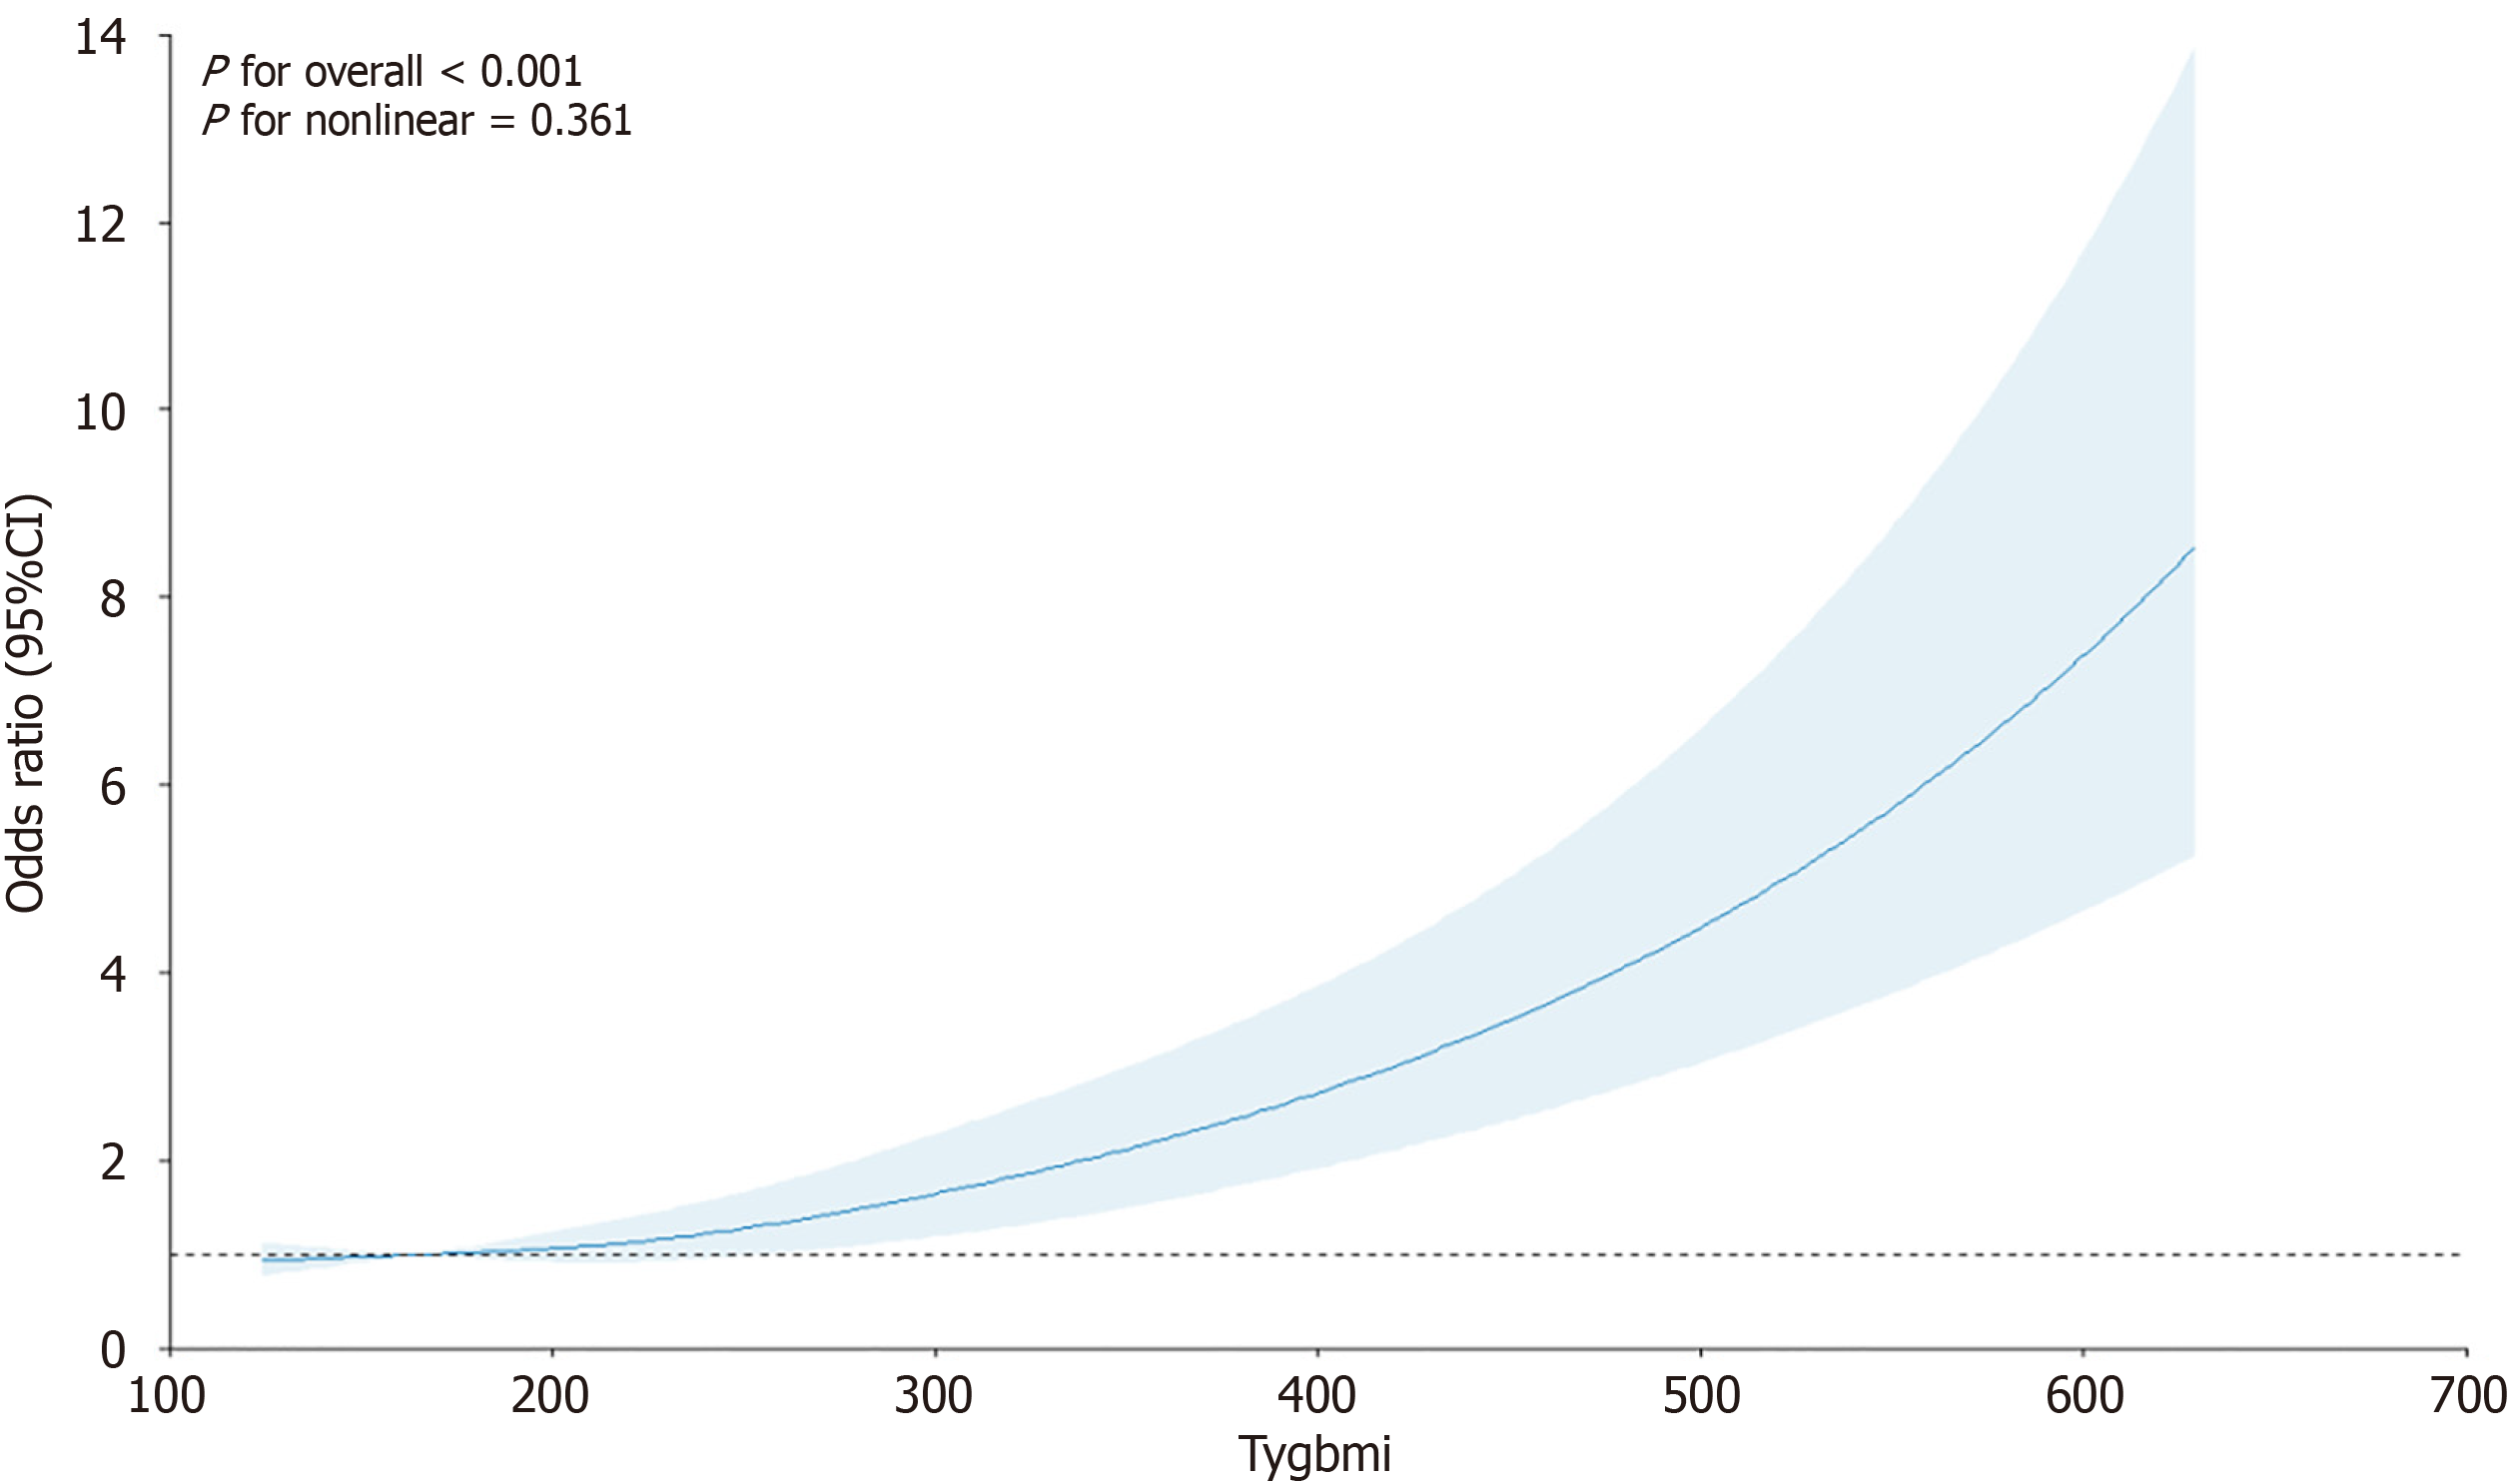
Figure 3 Restricted cubic splines for the association of triglyceride glucose-body mass index and obstructive sleep apnea.
- Citation: Gong L, Su M, Xu JH, Peng ZF, Du L, Chen ZY, Liu YZ, Chan LC, Huang YL, Chen YT, Huang FY, Piao CL. Cross-sectional study of the association between triglyceride glucose-body mass index and obstructive sleep apnea risk. World J Diabetes 2025; 16(3): 98519
- URL: https://www.wjgnet.com/1948-9358/full/v16/i3/98519.htm
- DOI: https://dx.doi.org/10.4239/wjd.v16.i3.98519


