Copyright
©The Author(s) 2024.
World J Diabetes. Sep 15, 2024; 15(9): 1979-2001
Published online Sep 15, 2024. doi: 10.4239/wjd.v15.i9.1979
Published online Sep 15, 2024. doi: 10.4239/wjd.v15.i9.1979
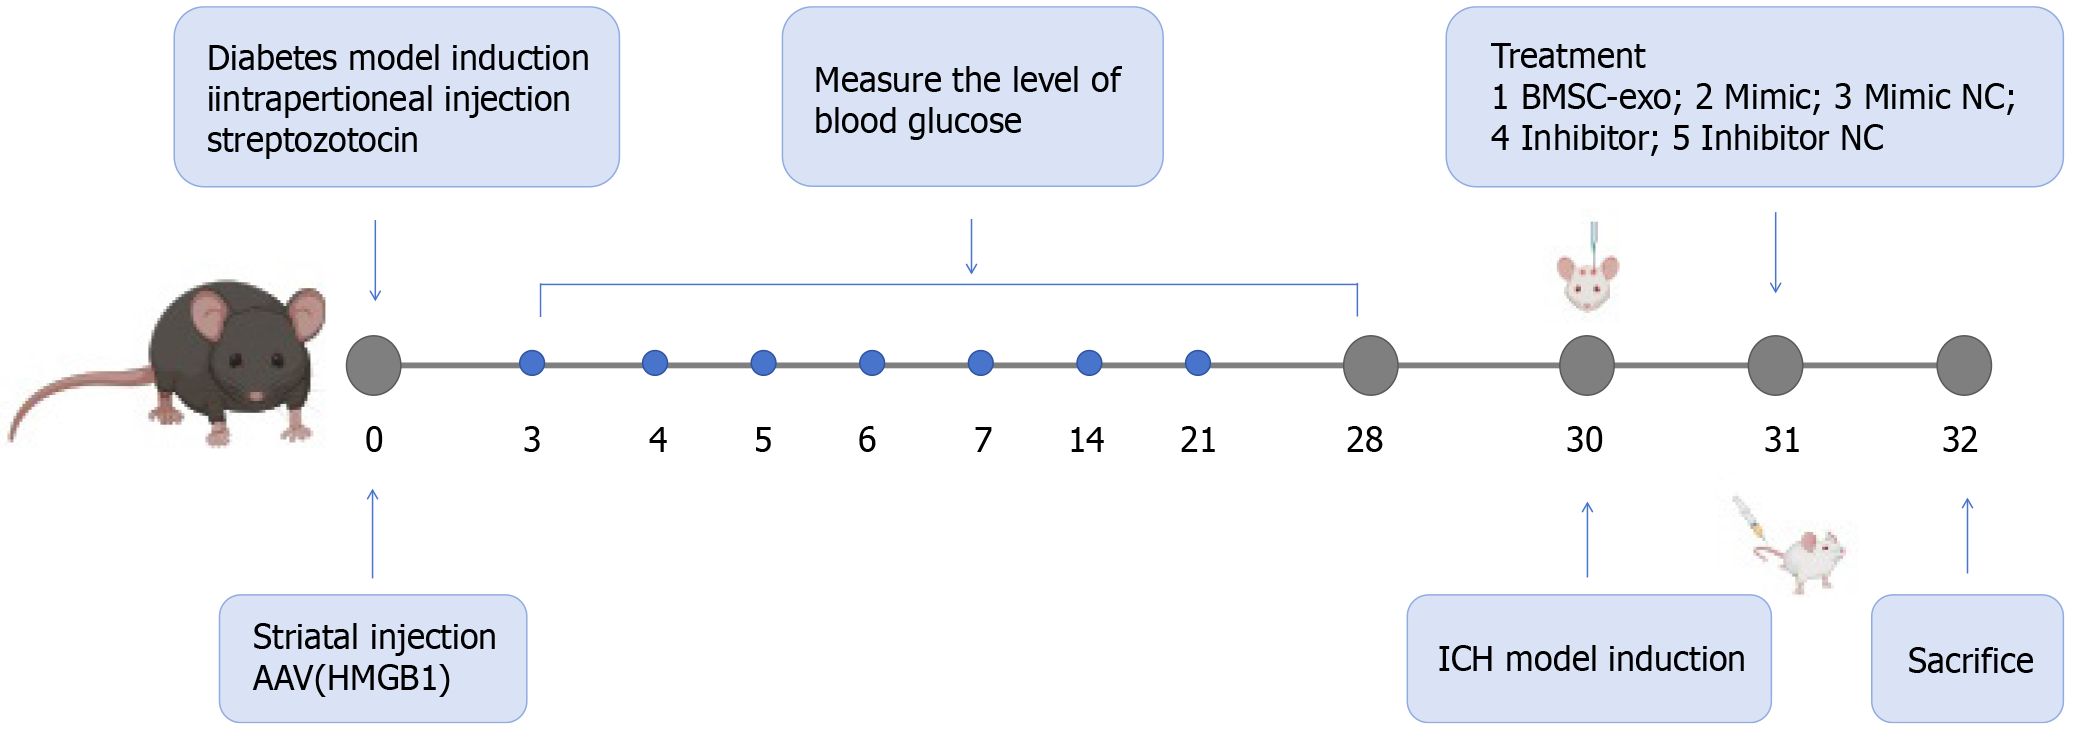
Figure 1 Modeling time point, drug treatment, and grouping of animal models.
HMGB1: High-mobility group box 1; BMSC-exo: Bone marrow mesenchymal stem cell derived exosomes; NC: Negative control; ICH: Intracerebral hemorrhage.
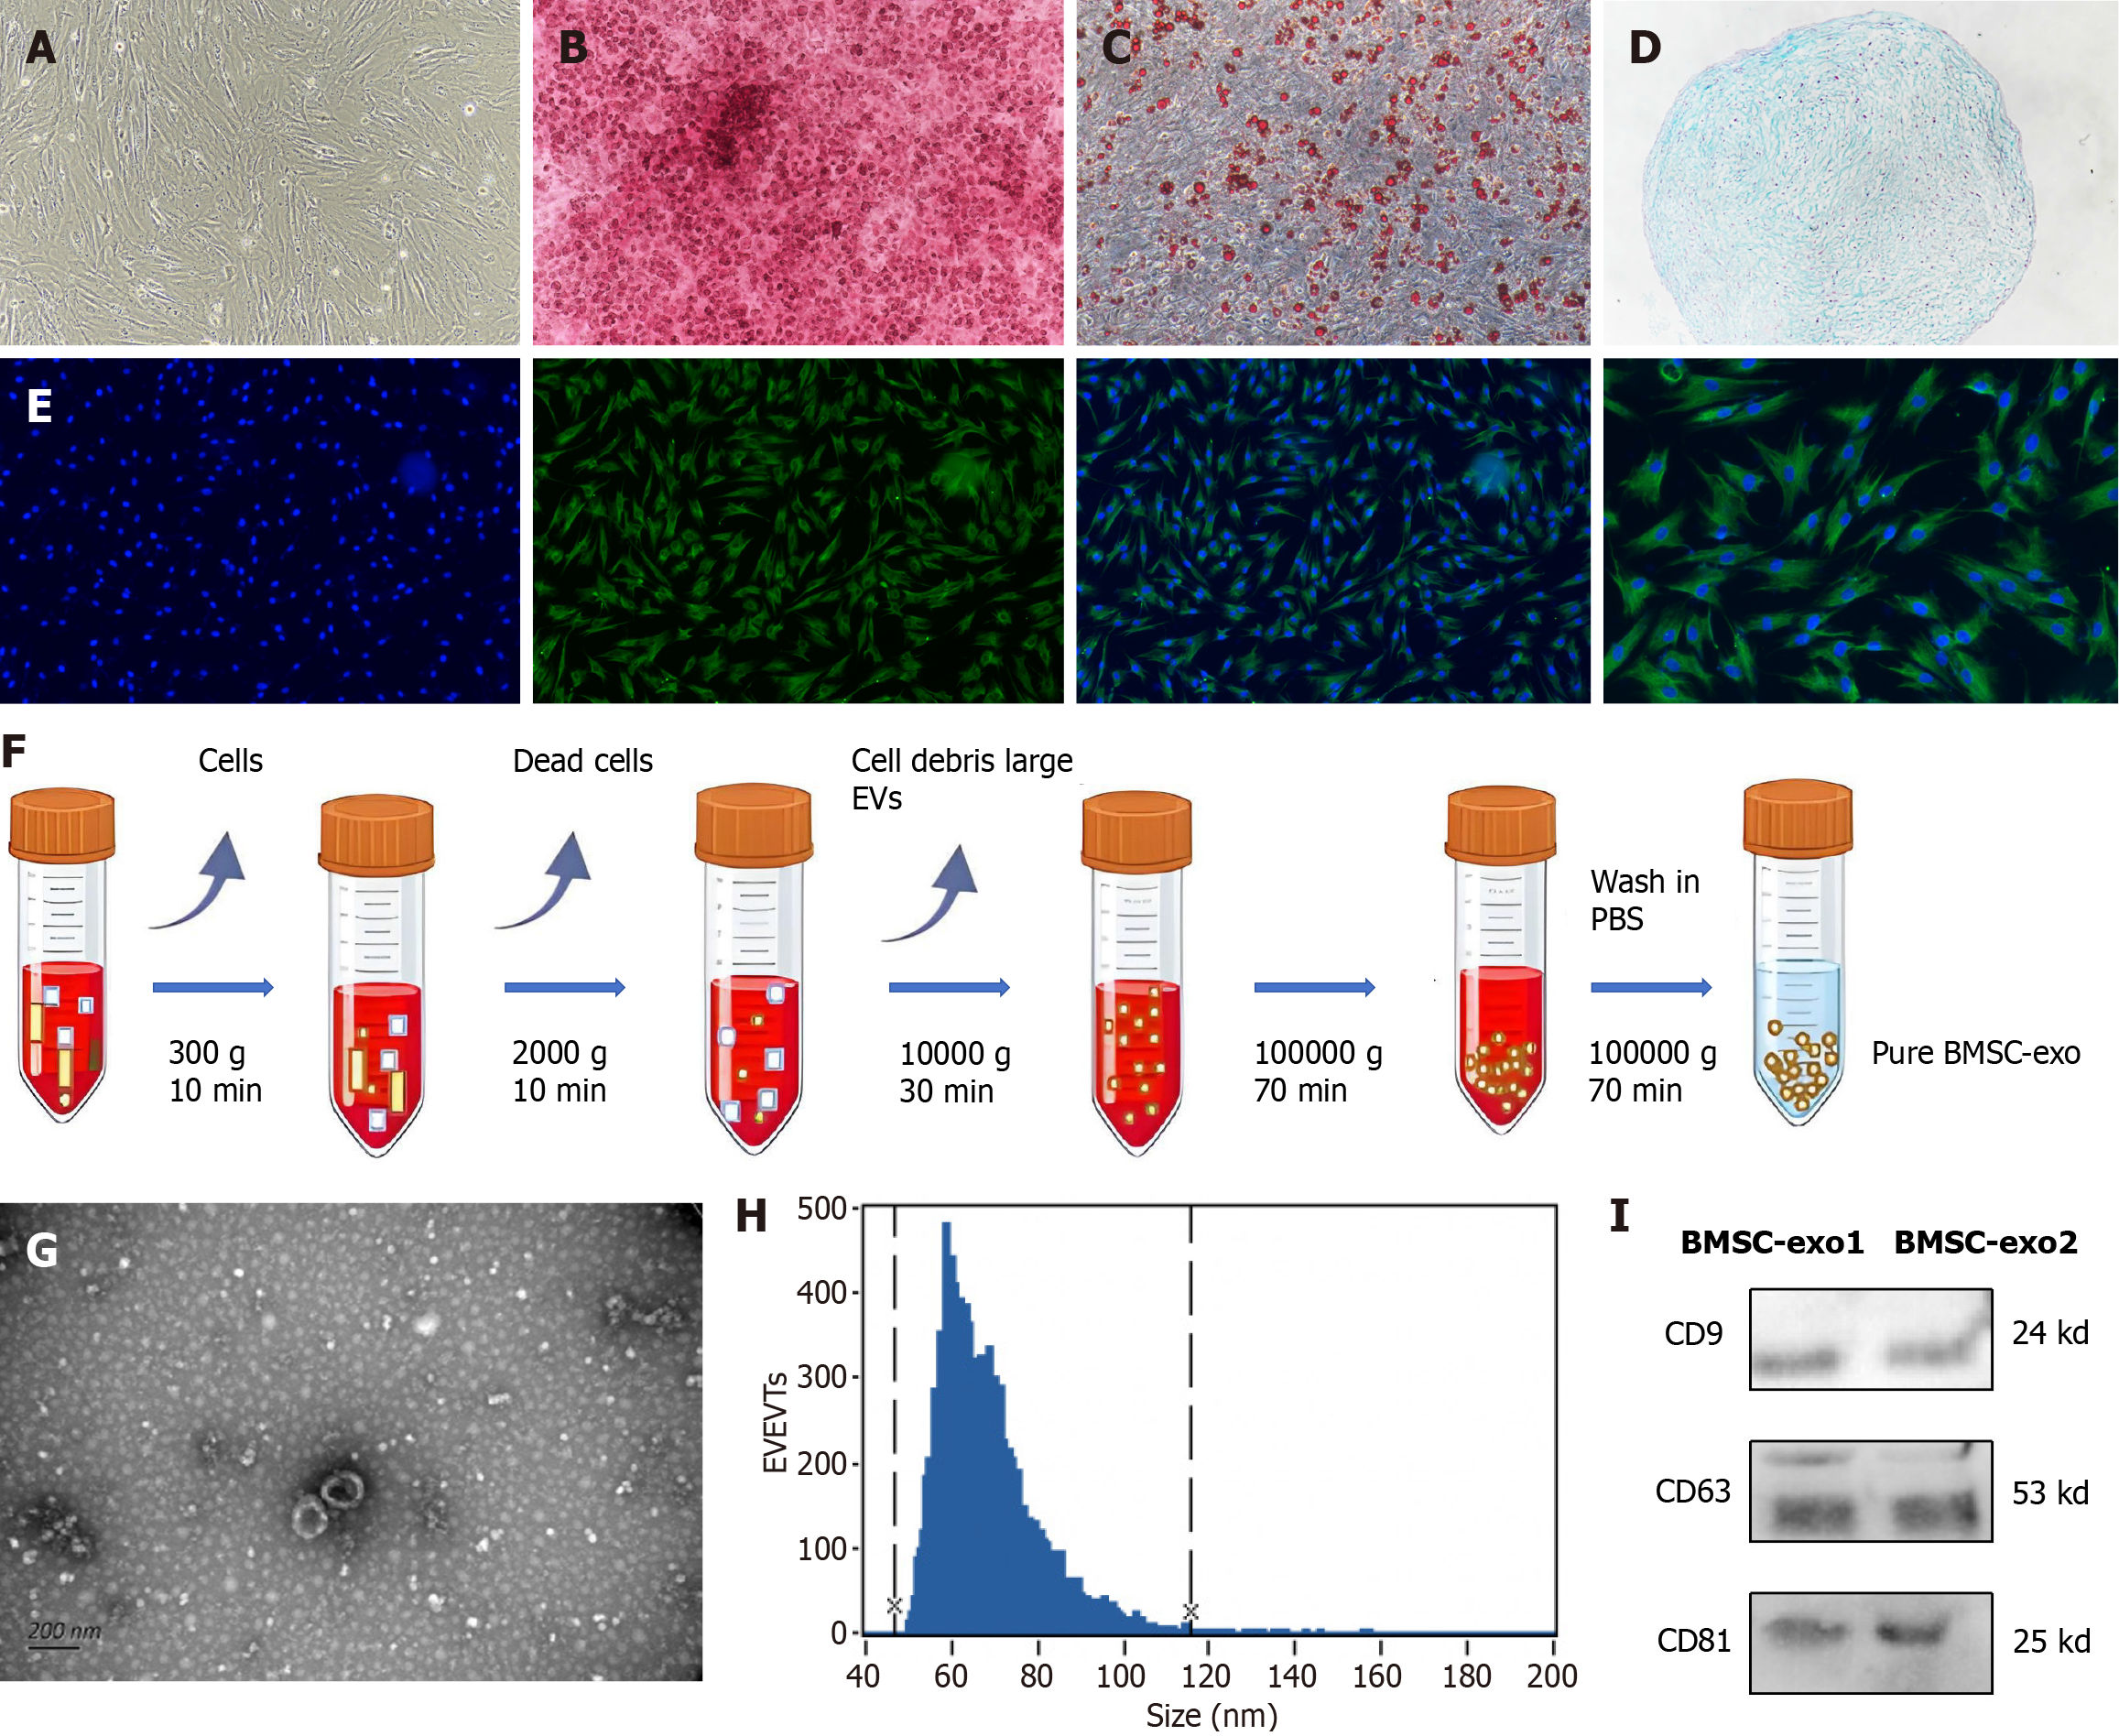
Figure 2 Characterization of bone marrow-derived mesenchymal stem cells and bone marrow-derived mesenchymal stem cell-derived exosomes.
A: Bone marrow-derived mesenchymal stem cells (BMSC) were fusiform. Scale = 50 μm; B: Osteoblast alizarin red, before and after staining. Scale = 50 μm; C: Lipoblast oil red O, before and after staining. Scale = 50 μm; D: Formation of chondrospheres, stained with alcian blue. Scale = 50 μm; E: Cluster of differentiation (CD) 44 immunofluorescence staining. Scale = 50 μm/25 μm; F: Extraction of BMSC-derived exosomes (BMSC-exo) by ultrafast centrifugation; G: BMSC-exo appeared saucer-shaped under electron microscopy. Scale = 200 nm; H: BMSC-exo particle microscopy with 47 nm and 116 nm diameters; I: Western blot analysis of protein expression of exosome markers: CD9; CD63; and CD81. EVs: Extracellular vesicles; PBS: Phosphate buffered saline; BMSC-exo: Bone marrow mesenchymal stem cell derived exosomes.
Figure 3 Bone marrow-derived mesenchymal stem cell-derived exosome attenuated neurological deficits in vivo.
A: Dil-labeled bone marrow-derived mesenchymal stem cell-derived exosomes (BMSC-exo) were injected in the tail vein of mice; B: Microglia (green) were labeled with ionized calcium-binding adaptor molecule 1 to observe the phagocytosis of BMSC-exo (red) by microglia. Scale bar = 50 μm; C: Immunofluorescence staining to observe the location of immunoglobulin G expression. Scale bar = 100 μm; D: Brain slices and hematoma volume were analyzed based on T2 magnetic resonance imaging. Experimental data are expressed as mean ± SD. aP < 0.05, intracerebral hemorrhage (ICH) + diabetes mellitus (DM) group vs ICH + DM + BMSC-exo group, t-test; E: Brain water content analysis. Experimental data are expressed as mean ± SD. aP < 0.01, ICH + DM group vs ICH + DM + BMSC-exo group, t-test; F: Neurological function scores and balance beam scores. Experimental data are expressed as mean ± SD. aP < 0.05, ICH + DM group vs ICH + DM + BMSC-exo group, t-test; G: The blood glucose levels of mice in each group were detected, and it was found that BMSC-exo could not reduce the blood glucose levels after diabetic cerebral hemorrhage in mice. Con: Control; BMSC-exo: Bone marrow mesenchymal stem cell derived exosomes; ICH: Intracerebral hemorrhage; DM: Diabetes mellitus; IgG: Immunoglobulin G.
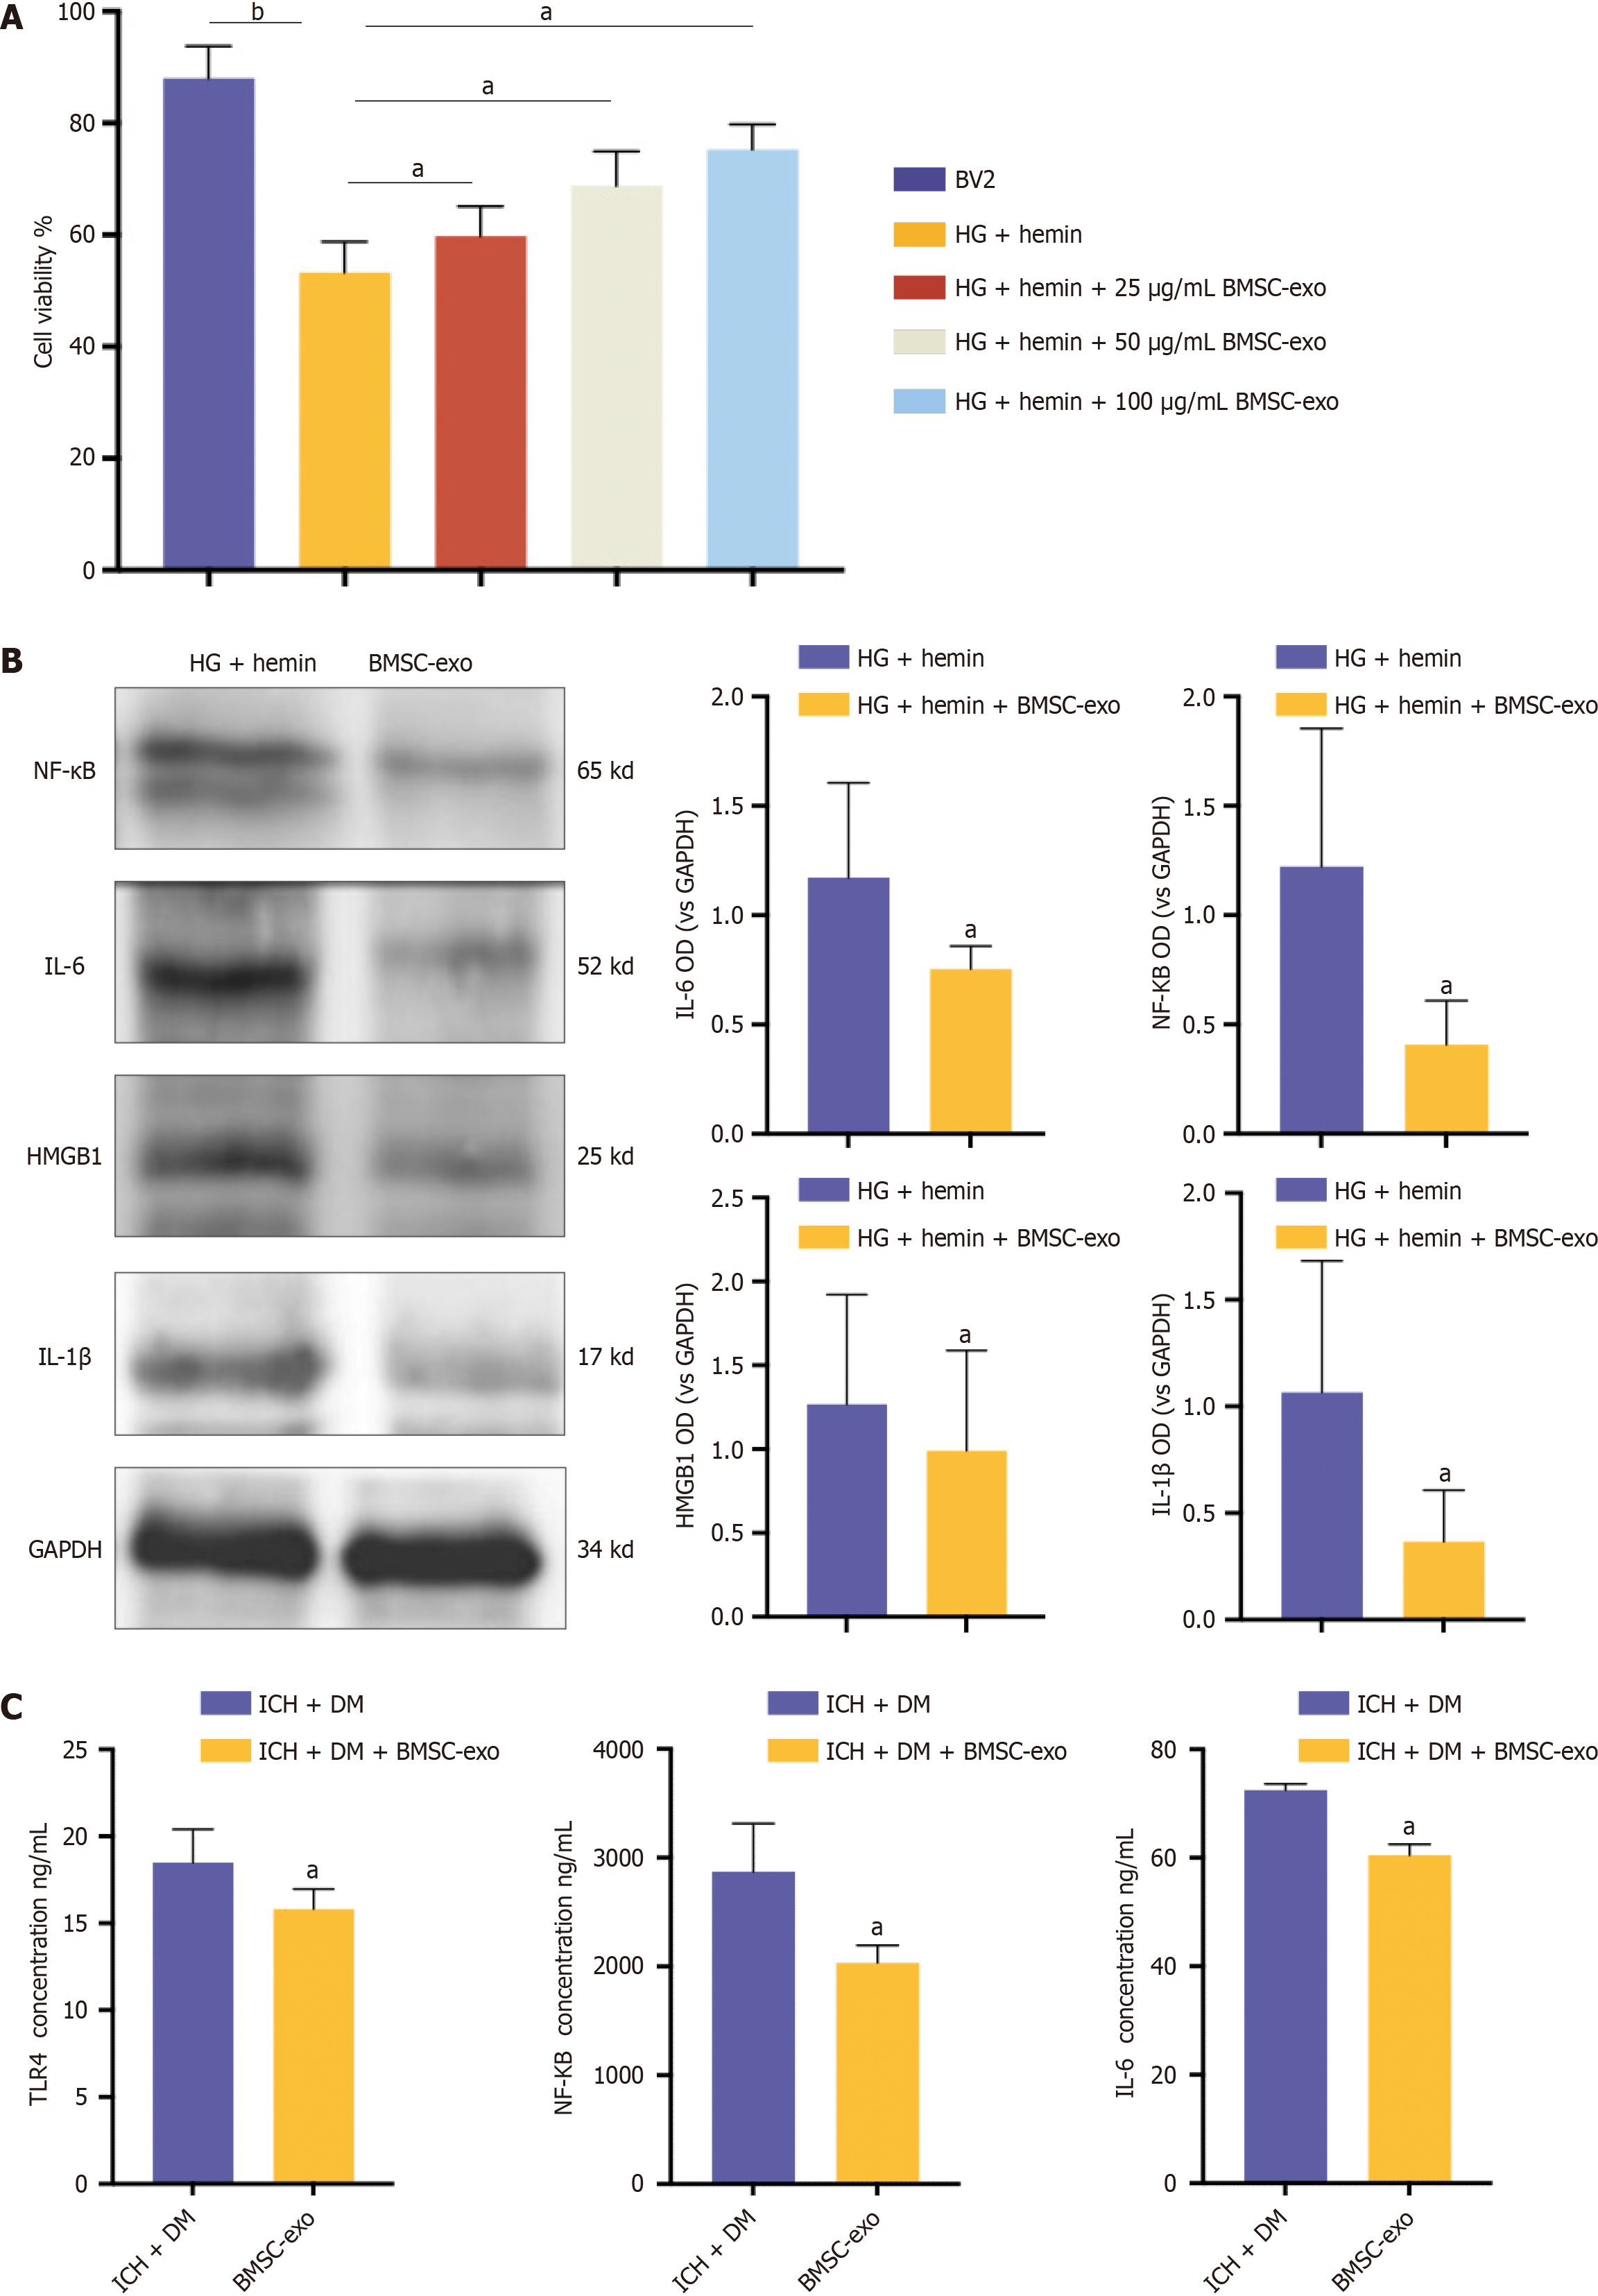
Figure 4 Bone marrow-derived mesenchymal stem cell-derived exosome attenuated neuroinflammation in mice with diabetes and intracerebral hemorrhage.
A: Microglia were treated with different concentrations of bone marrow-derived mesenchymal stem cell-derived exosomes (BMSC-exo), and cell viability was observed using the cell counting kit-8 assay. Experimental data are expressed as mean ± SD. bP < 0.01, BV2 group vs high glucose (HG) + hemin group; aP < 0.05, HG + hemin group vs HG + hemin + 25 μg/mL BMSC-exo group; aP < 0.05, HG + hemin group vs HG + hemin + 50 μg/mL BMSC-exo group; aP < 0.05, HG + hemin group vs HG + hemin + 100 μg/mL BMSC-exo group, t-test; B: Western blot assay was performed to detect the expression levels of nuclear factor kappa B (NF-κB), interleukin (IL) 6, IL-1β, and high-mobility group box 1 (HMGB1) inflammatory factors in the cells. Experimental data are expressed as mean ± SD. aP < 0.05, HG + hemin group vs HG + hemin + BMSC-exo group, t-test; C: Enzyme-linked immunosorbent assay detection of toll-like receptor 4, NF-κB, and IL-6 expression. Experimental data are expressed as mean ± SD. aP < 0.05, Intracerebral hemorrhage (ICH) + diabetes mellitus (DM) group vs ICH + DM + BMSC-exo group, t-test. BMSC-exo: Bone marrow mesenchymal stem cell derived exosomes; HG: High glucose; NF-κB: Nuclear factor kappa B; IL: Interleukin; HMGB1: High-mobility group box 1; TLR: Toll-like receptor; DM: Diabetes mellitus; ICH: Intracerebral hemorrhage.
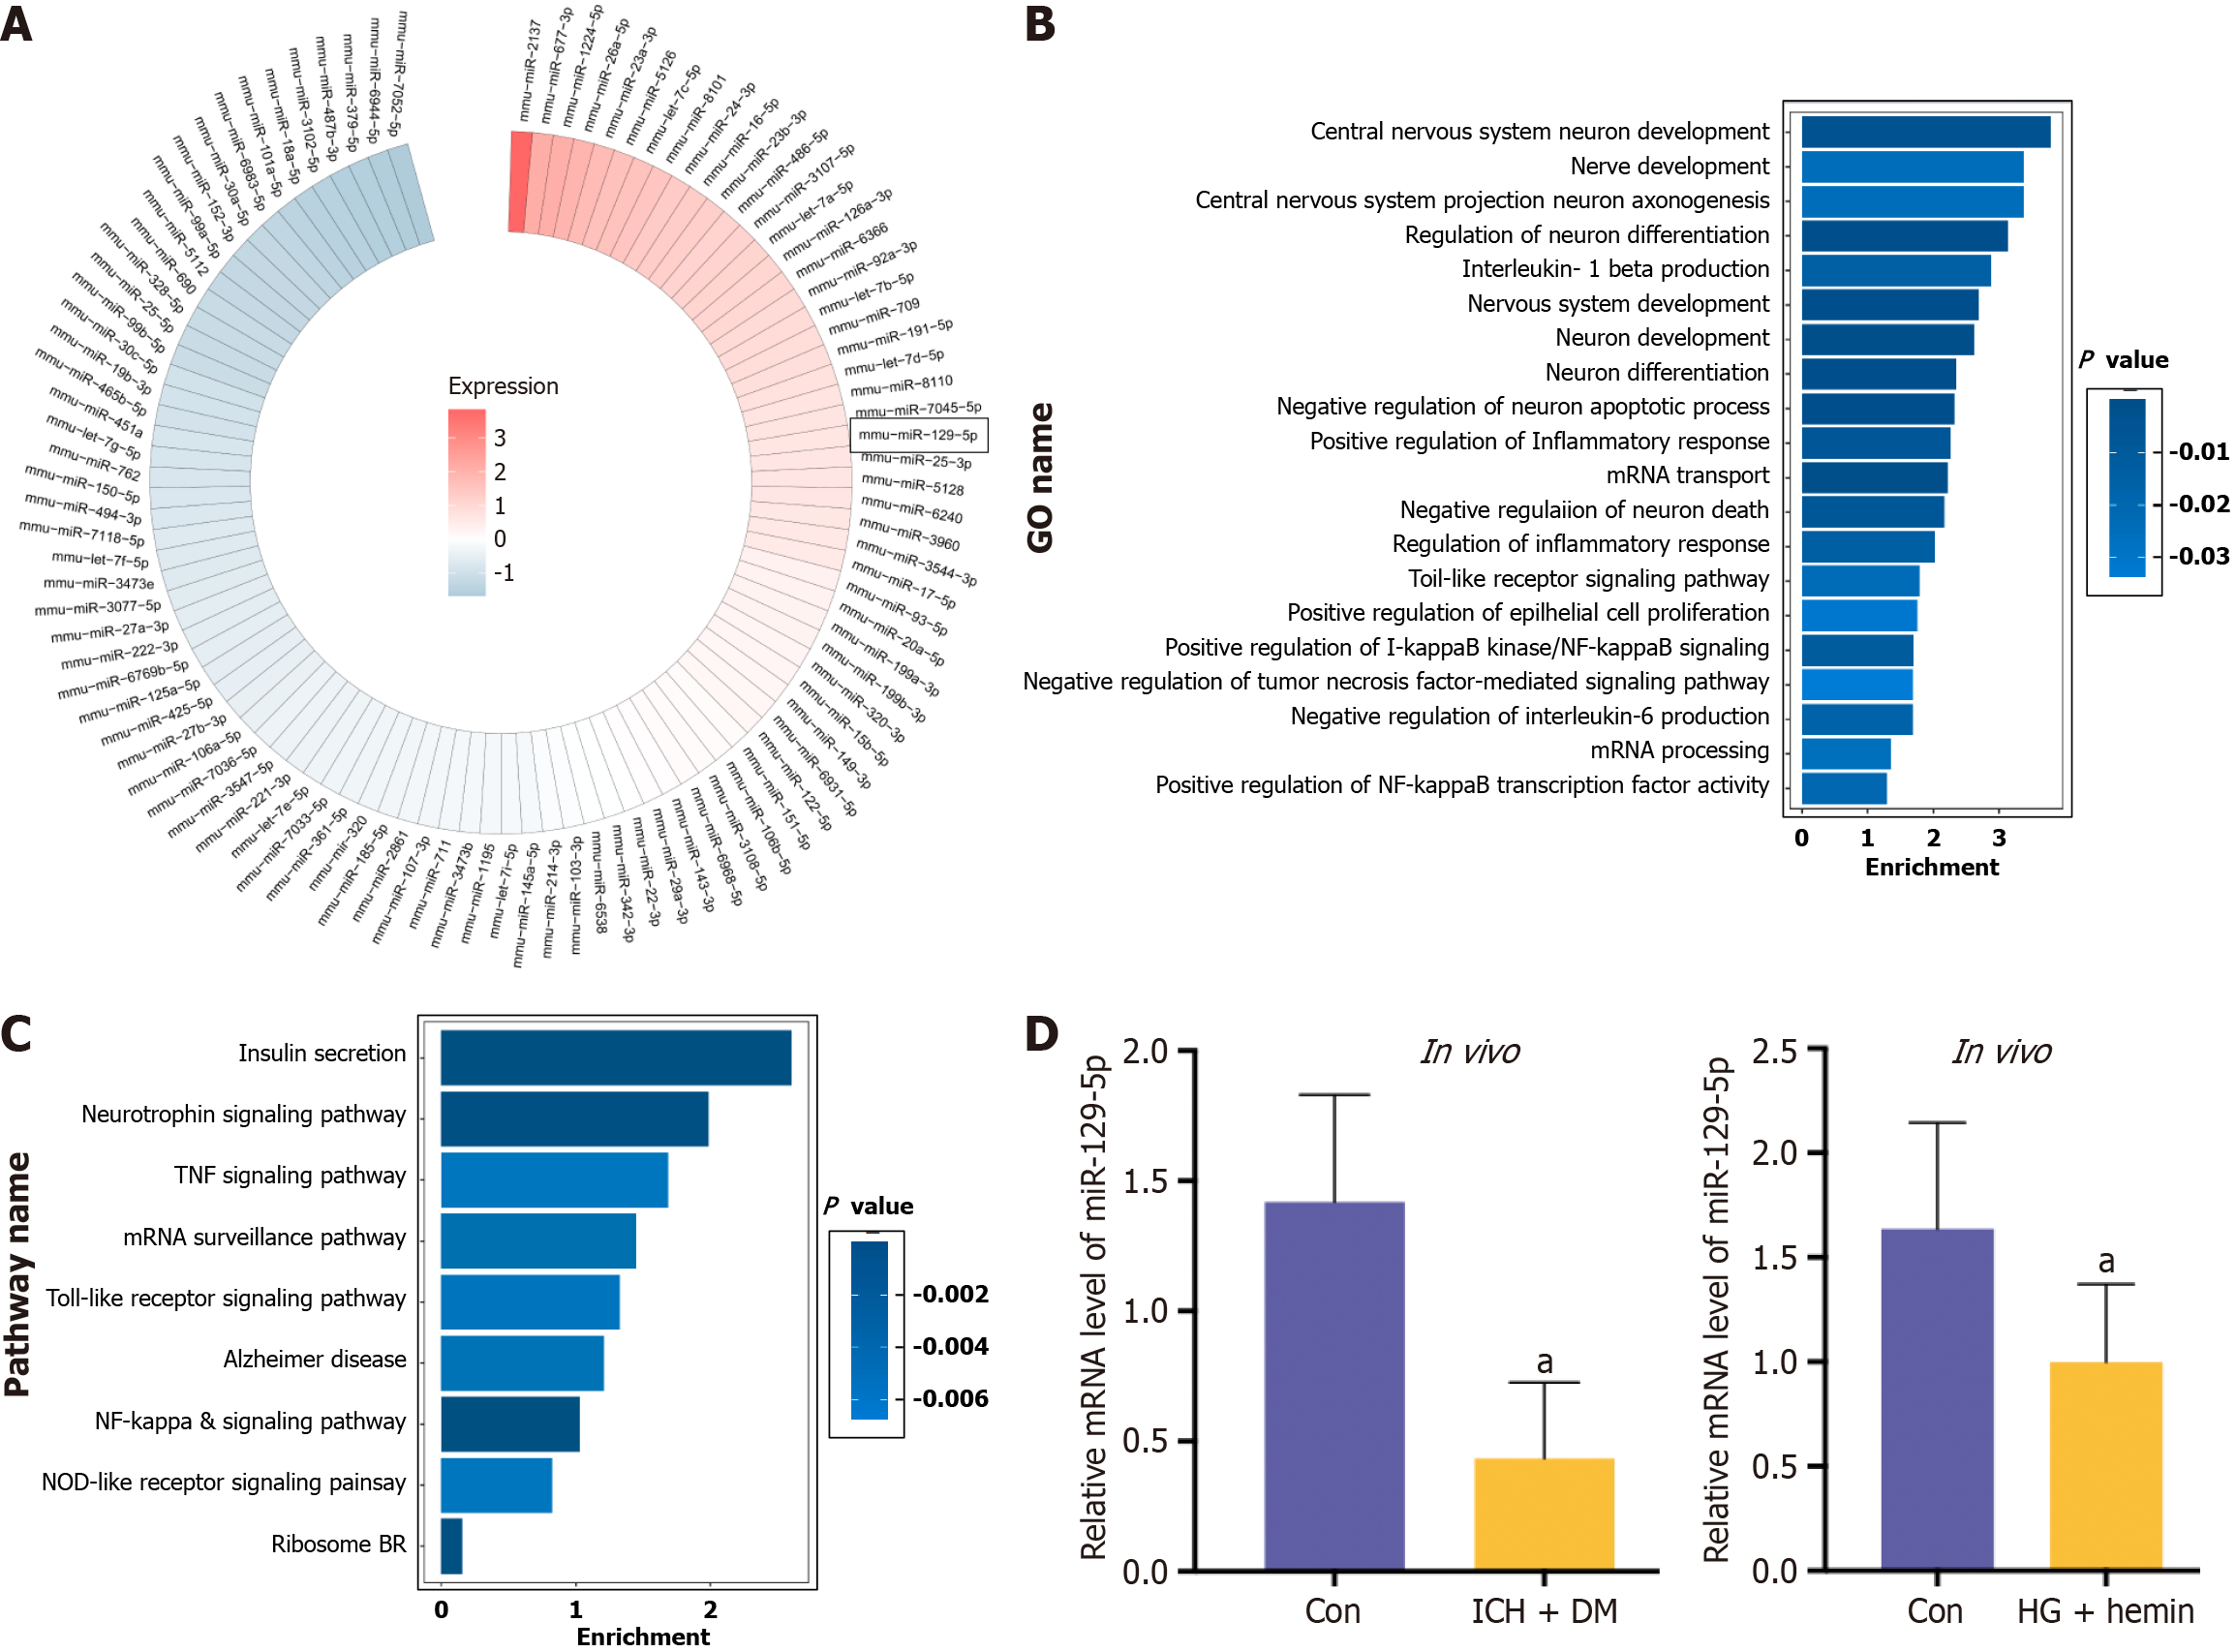
Figure 5 Screening for microRNA.
A: Heat maps showed microRNA content in bone marrow-derived mesenchymal stem cell-derived exosomes; B: Gene Ontology functional enrichment analysis; C: Kyoto Encyclopedia of Genes and Genomes pathway analysis; D: The expression of microRNA-129-5p in the intracerebral hemorrhage + diabetes mellitus mice and high glucose + hemin-treated BV2 was detected by quantitative polymerase chain reaction assay. The experimental data are expressed as mean ± SD. In vivo: aP < 0.05, control group vs intracerebral hemorrhage + diabetes mellitus group, t-test. In vitro: aP < 0.05, control group vs high glucose + hemin group, t-test. GO: Gene Ontology; TNF: Tumor necrosis factor; HG: High glucose; DM: Diabetes mellitus; ICH: Intracerebral hemorrhage.
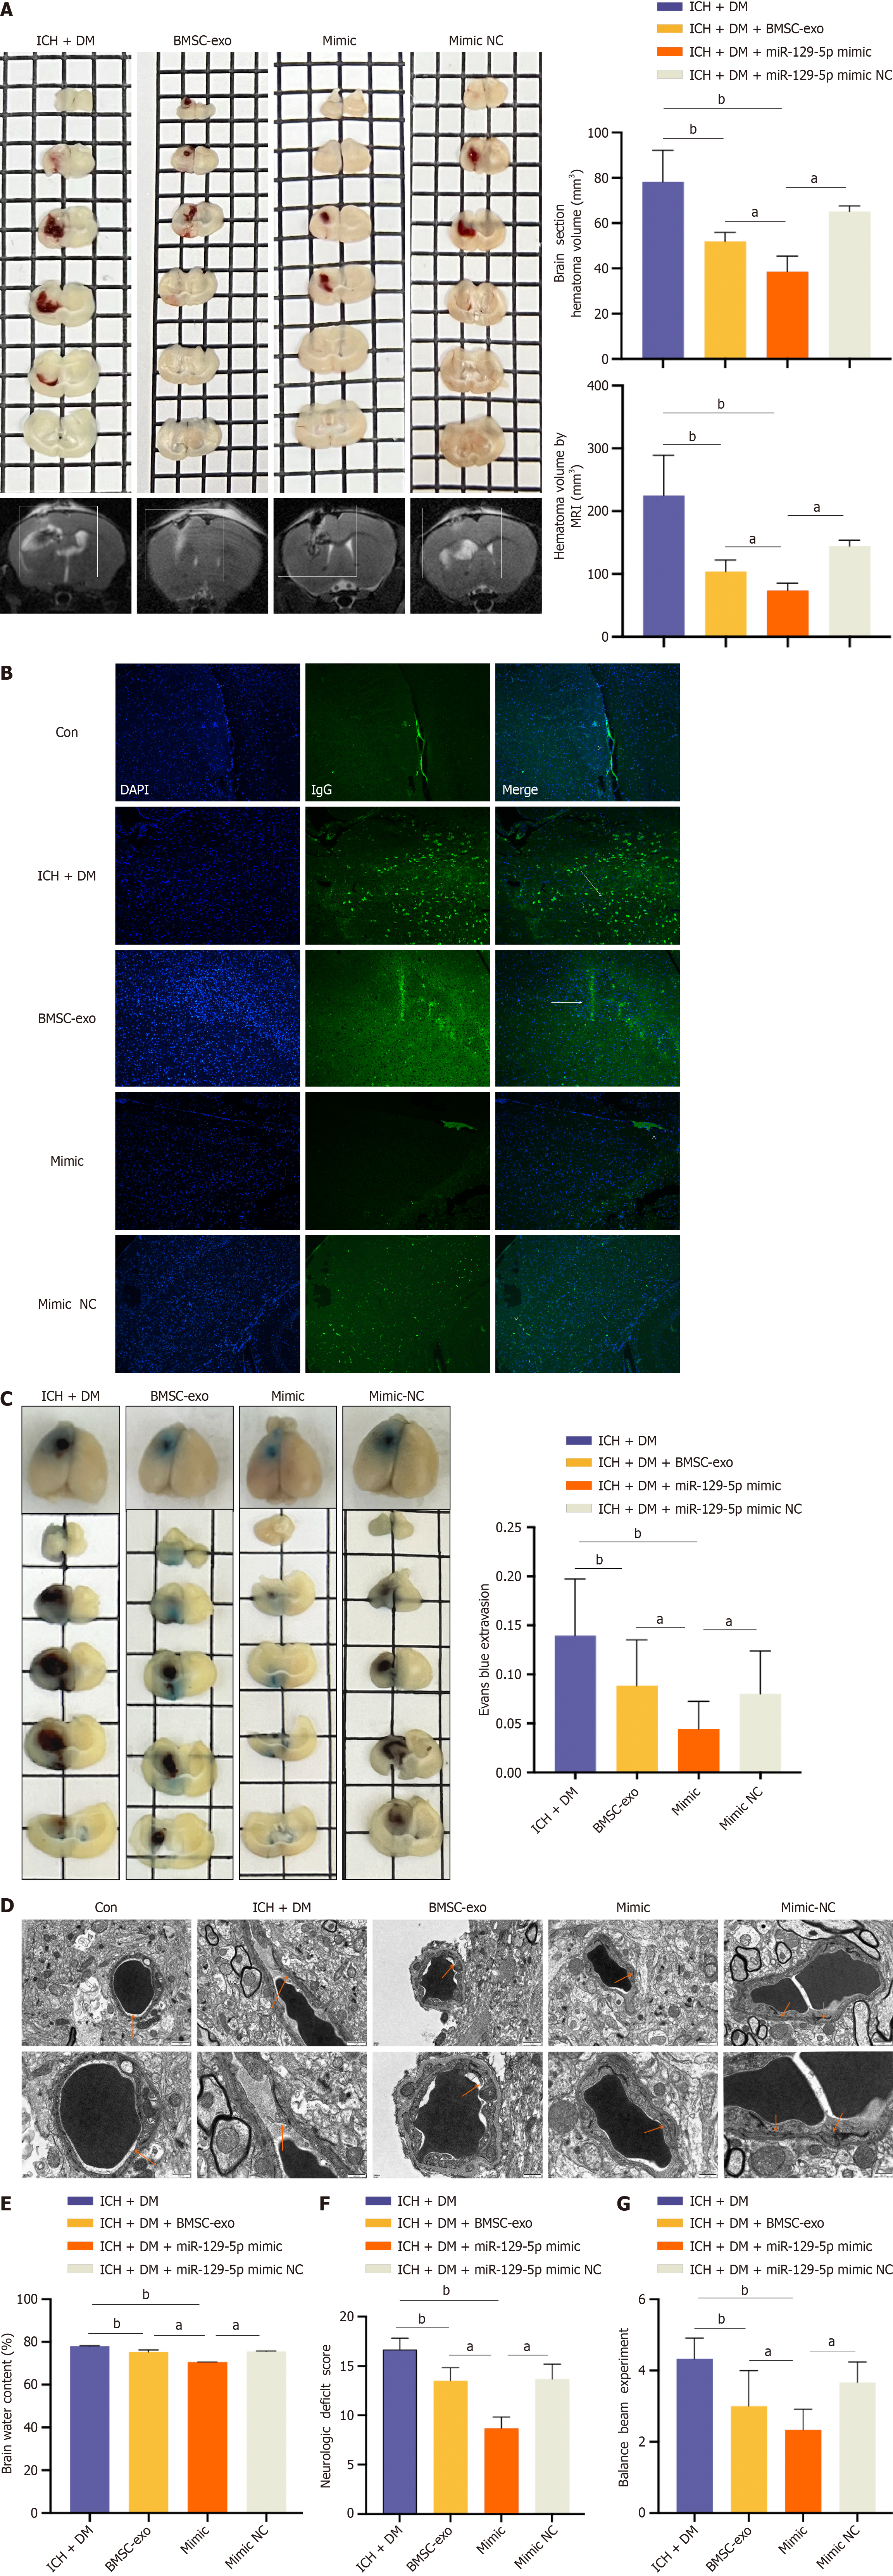
Figure 6 Overexpression of microRNA-129-5p attenuated neurological deficits after intracerebral hemorrhage in mice with diabetes.
A: Brain sections and T2 magnetic resonance imaging to detect intracerebral hematoma volume in mice. Experimental data are expressed as mean ± SD. aP < 0.05, intracerebral hemorrhage (ICH) + diabetes mellitus (DM) + bone marrow-derived mesenchymal stem cell-derived exosomes (BMSC-exo) vs ICH + DM + miR-129-5p mimic group; aP < 0.05, ICH + DM + miR-129-5p mimic group vs ICH + DM + miR-129-5p mimic negative control (NC) group; bP < 0.01, ICH + DM group vs ICH + DM + BMSC-exo group; bP < 0.01, ICH + DM group vs ICH + DM + miR-129-5p mimic group, t-test; B: Immunofluorescence staining to detect the location of immunoglobulin G protein expression; C: Evans blue detection of blood-brain barrier damage. Experimental data are expressed as mean ± SD. aP < 0.05, ICH + DM + BMSC-exo group vs ICH + DM + miR-129-5p mimic group; aP < 0.05, ICH + DM + miR-129-5p mimic group vs ICH + DM + miR-129-5p mimic NC group; bP < 0.01, ICH + DM group vs ICH + DM + BMSC-exo group; bP < 0.01, ICH + DM group vs ICH + DM + miR-129-5p mimic group, t-test; D: Transmission electron microscopic observation of blood-brain barrier damage; E: Dry and wet weight method to measure edema after cerebral hemorrhage in mice. Experimental data are expressed as mean ± SD. aP < 0.05, ICH + DM + BMSC-exo group vs ICH + DM + miR-129-5p mimic group; aP < 0.05, ICH + DM + miR-129-5p mimic group vs ICH + DM + miR-129-5p mimic NC group; bP < 0.01, ICH + DM group vs ICH + DM + BMSC-exo group; bP < 0.01, ICH + DM group vs ICH + DM + miR-129-5p mimic group, t-test; F and G: Neurological score and balance beam test to detect the neurological function of mice after cerebral hemorrhage. Experimental data are expressed as mean ± SD. aP < 0.05, ICH + DM + BMSC-exo group vs ICH + DM + miR-129-5p mimic group; aP < 0.05, ICH + DM + miR-129-5p mimic group vs ICH + DM + miR-129-5p mimic NC group; bP < 0.01, ICH + DM group vs ICH + DM + BMSC-exo group; bP < 0.01, ICH + DM group vs ICH + DM + miR-129-5p mimic group, t-test. DM: Diabetes mellitus; ICH: Intracerebral hemorrhage; BMSC-exo: Bone marrow-derived mesenchymal stem cell-derived exosomes; NC: Negative control.
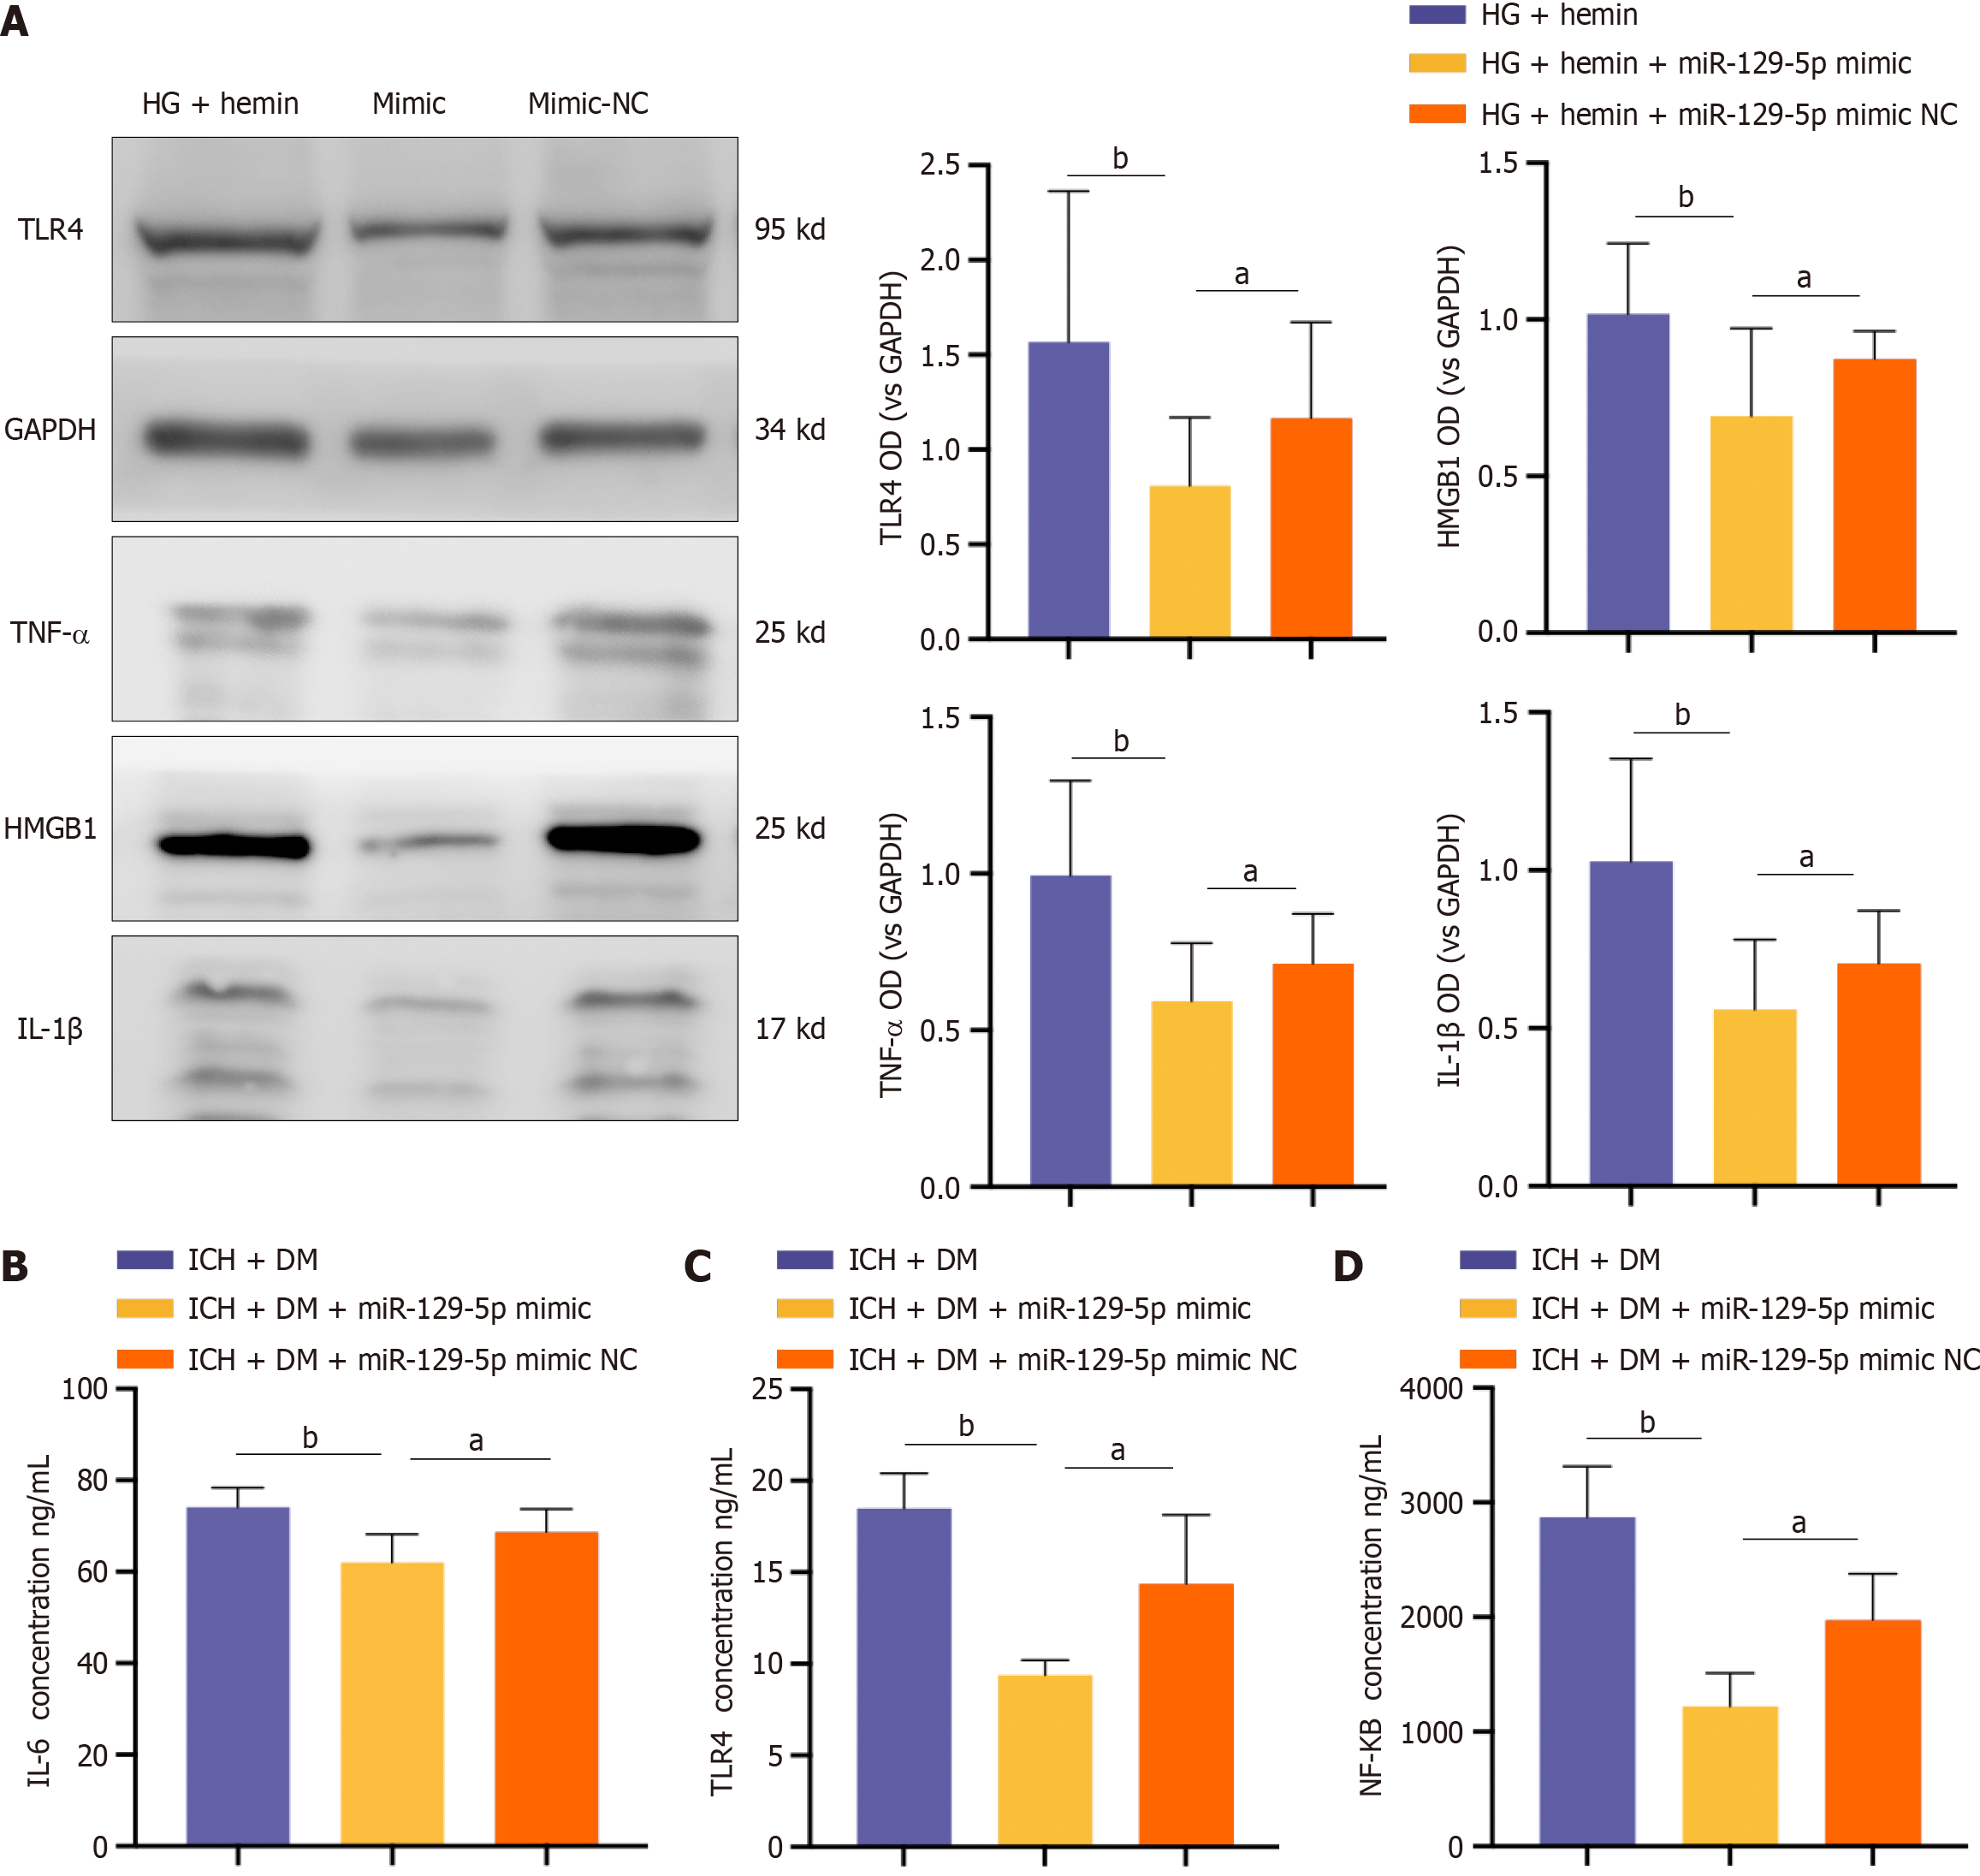
Figure 7 Bone marrow-derived mesenchymal stem cell-derived exosome overexpression of microRNA-129-5p attenuated neuro-inflammation after intracerebral hemorrhage in mice with diabetes.
A: The expression of some inflammatory factors [toll-like receptor (TLR) 4, tumor necrosis factor (TNF)-α, high-mobility group box 1 (HMGB1), and interleukin (IL)-1β] in BV2 cells was detected by western blot. Experimental data are expressed as mean ± SD. aP < 0.05, high glucose (HG) + hemin + miR-129-5p mimic group vs HG + hemin + miR-129-5p mimic negative control (NC) group, t-test; bP < 0.01, HG + hemin group vs HG + hemin + miR-129-5p mimic group; B-D: Levels of inflammatory factors TLR4, IL-6, and nuclear factor kappa B (NF-κB) were detected by enzyme-linked immunosorbent assay. Experimental data are expressed as mean ± SD. aP < 0.05, intracerebral hemorrhage (ICH) + diabetes mellitus (DM) + miR-129-5p mimic group vs ICH + DM + miR-129-5p mimic NC group, t-test; bP < 0.01, ICH + DM group vs ICH + DM + miR-129-5p mimic group. The mimic group in panel A was HG + hemin + microRNA-129-5p mimic; the mimic NC group was HG + hemin + microRNA-129-5p mimic NC. TLR: Toll-like receptor; IL: Interleukin; TNF: Tumor necrosis factor; HMGB1: High-mobility group box 1; DM: Diabetes mellitus; ICH: Intracerebral hemorrhage; NF-κB: Nuclear factor kappa B; NC: Negative control.
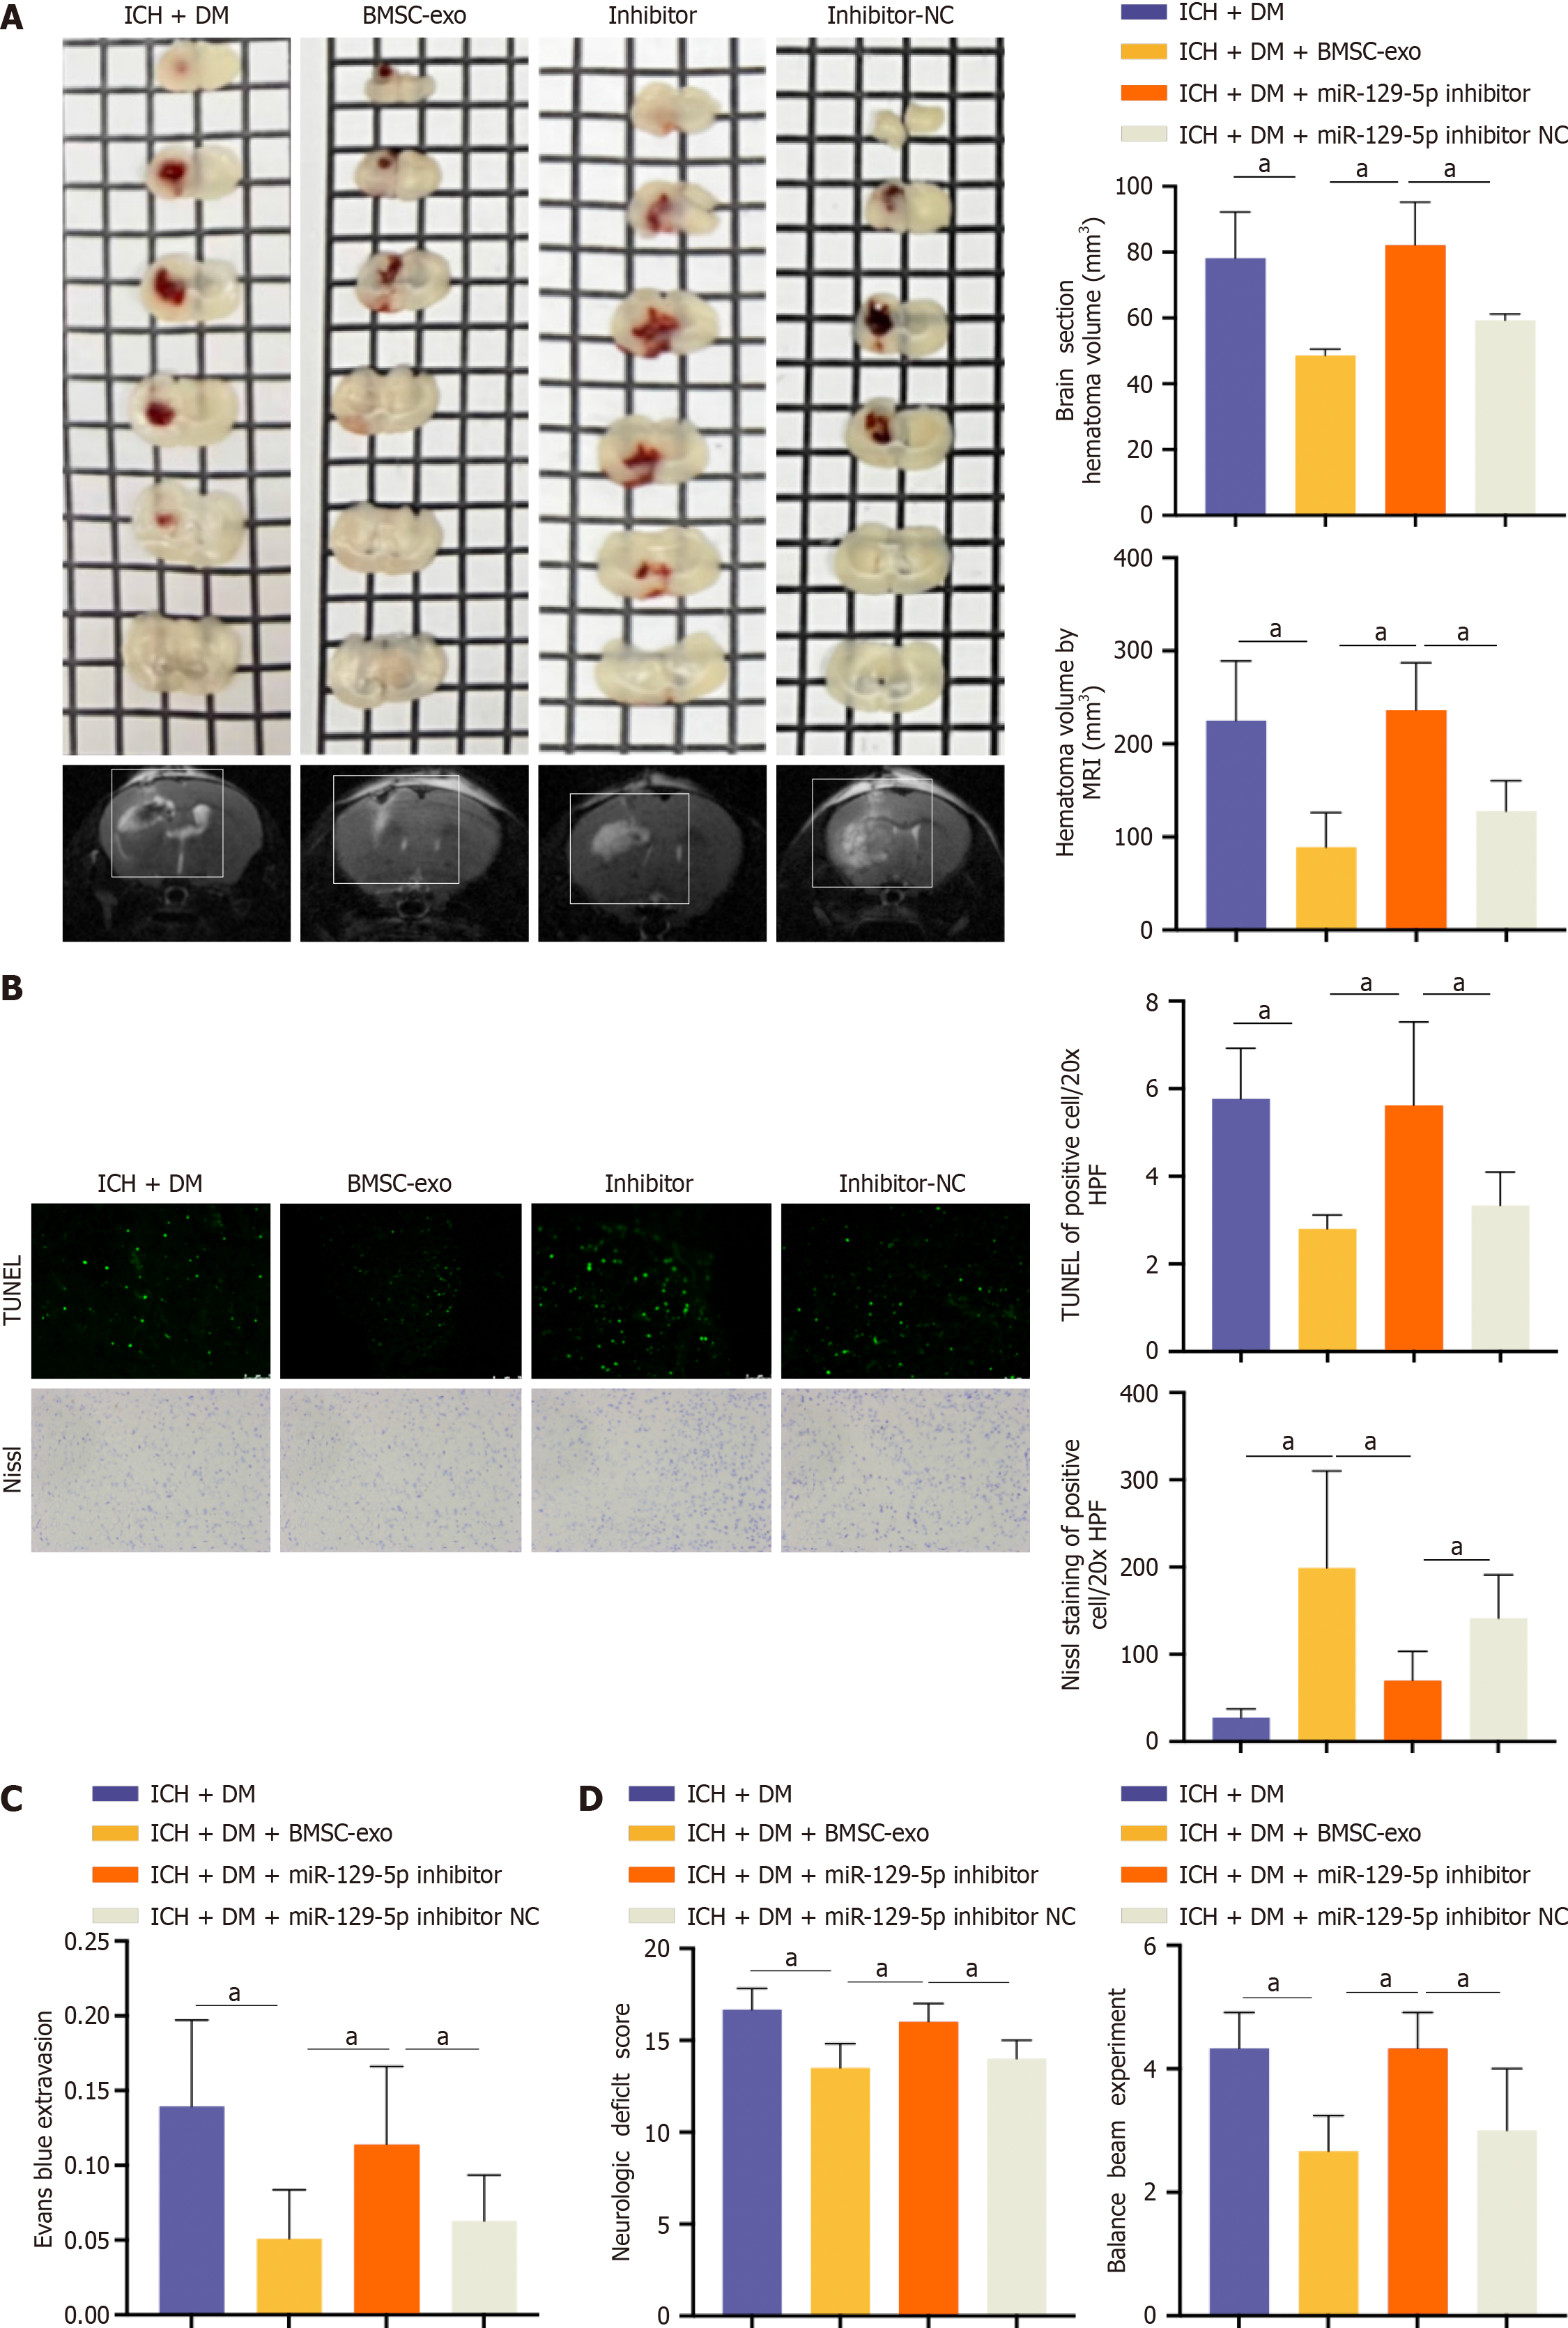
Figure 8 Bone marrow-derived mesenchymal stem cell-derived exosome alleviated neuroinflammation and neurological impairment through microRNA-129-5p following intracerebral hemorrhage in mice with diabetes.
A: The volume of intracerebral hemorrhage (ICH) detected by magnetic resonance imaging in mice. Experimental data are expressed as mean ± SD. aP < 0.05, ICH + diabetes mellitus (DM) group vs ICH + DM + bone marrow-derived mesenchymal stem cell-derived exosomes (BMSC-exo) group; aP < 0.05, ICH + DM + BMSC-exo group vs ICH + DM + miR-129-5p inhibitor group; aP < 0.05, ICH + DM + miR-129-5p inhibitor group vs ICH + DM + miR-129-5p inhibitor negative control (NC) group, t-test; B: Terminal deoxynucleotidyl transferase dUTP nick end labeling and Nissl staining were used to detect neuronal apoptosis and activity. Scale = 50 μm. Experimental data are expressed as mean ± SD. aP < 0.05, ICH + DM group vs ICH + DM + BMSC-exo group; aP < 0.05, ICH + DM + BMSC-exo group vs ICH + DM + miR-129-5p inhibitor group; aP < 0.05, ICH + DM + miR-129-5p inhibitor group vs ICH + DM + miR-129-5p inhibitor NC group, t-test; C: Blood-brain barrier injury was detected by Evans blue. Experimental data are expressed as mean ± SD. aP < 0.05, ICH + DM group vs ICH + DM + BMSC-exo group; aP < 0.05, ICH + DM + BMSC-exo group vs ICH + DM + miR-129-5p inhibitor group; aP < 0.05, ICH + DM + miR-129-5p inhibitor group vs ICH + DM + miR-129-5p inhibitor NC group, t-test; D: Nervous system score and balance beam test were used to detect the neurological function of the mice after ICH. The experimental data are expressed as mean ± SD. aP < 0.05, ICH + DM group vs ICH + DM + BMSC-exo group; aP < 0.05, ICH + DM + BMSC-exo group vs ICH + DM + miR-129-5p inhibitor group; aP < 0.05, ICH + DM + miR-129-5p inhibitor group vs ICH + DM + miR-129-5p inhibitor NC group, t-test. BMSC-exo: Bone marrow-derived mesenchymal stem cell-derived exosome; NC: Negative control; DM: Diabetes mellitus; ICH: Intracerebral hemorrhage.
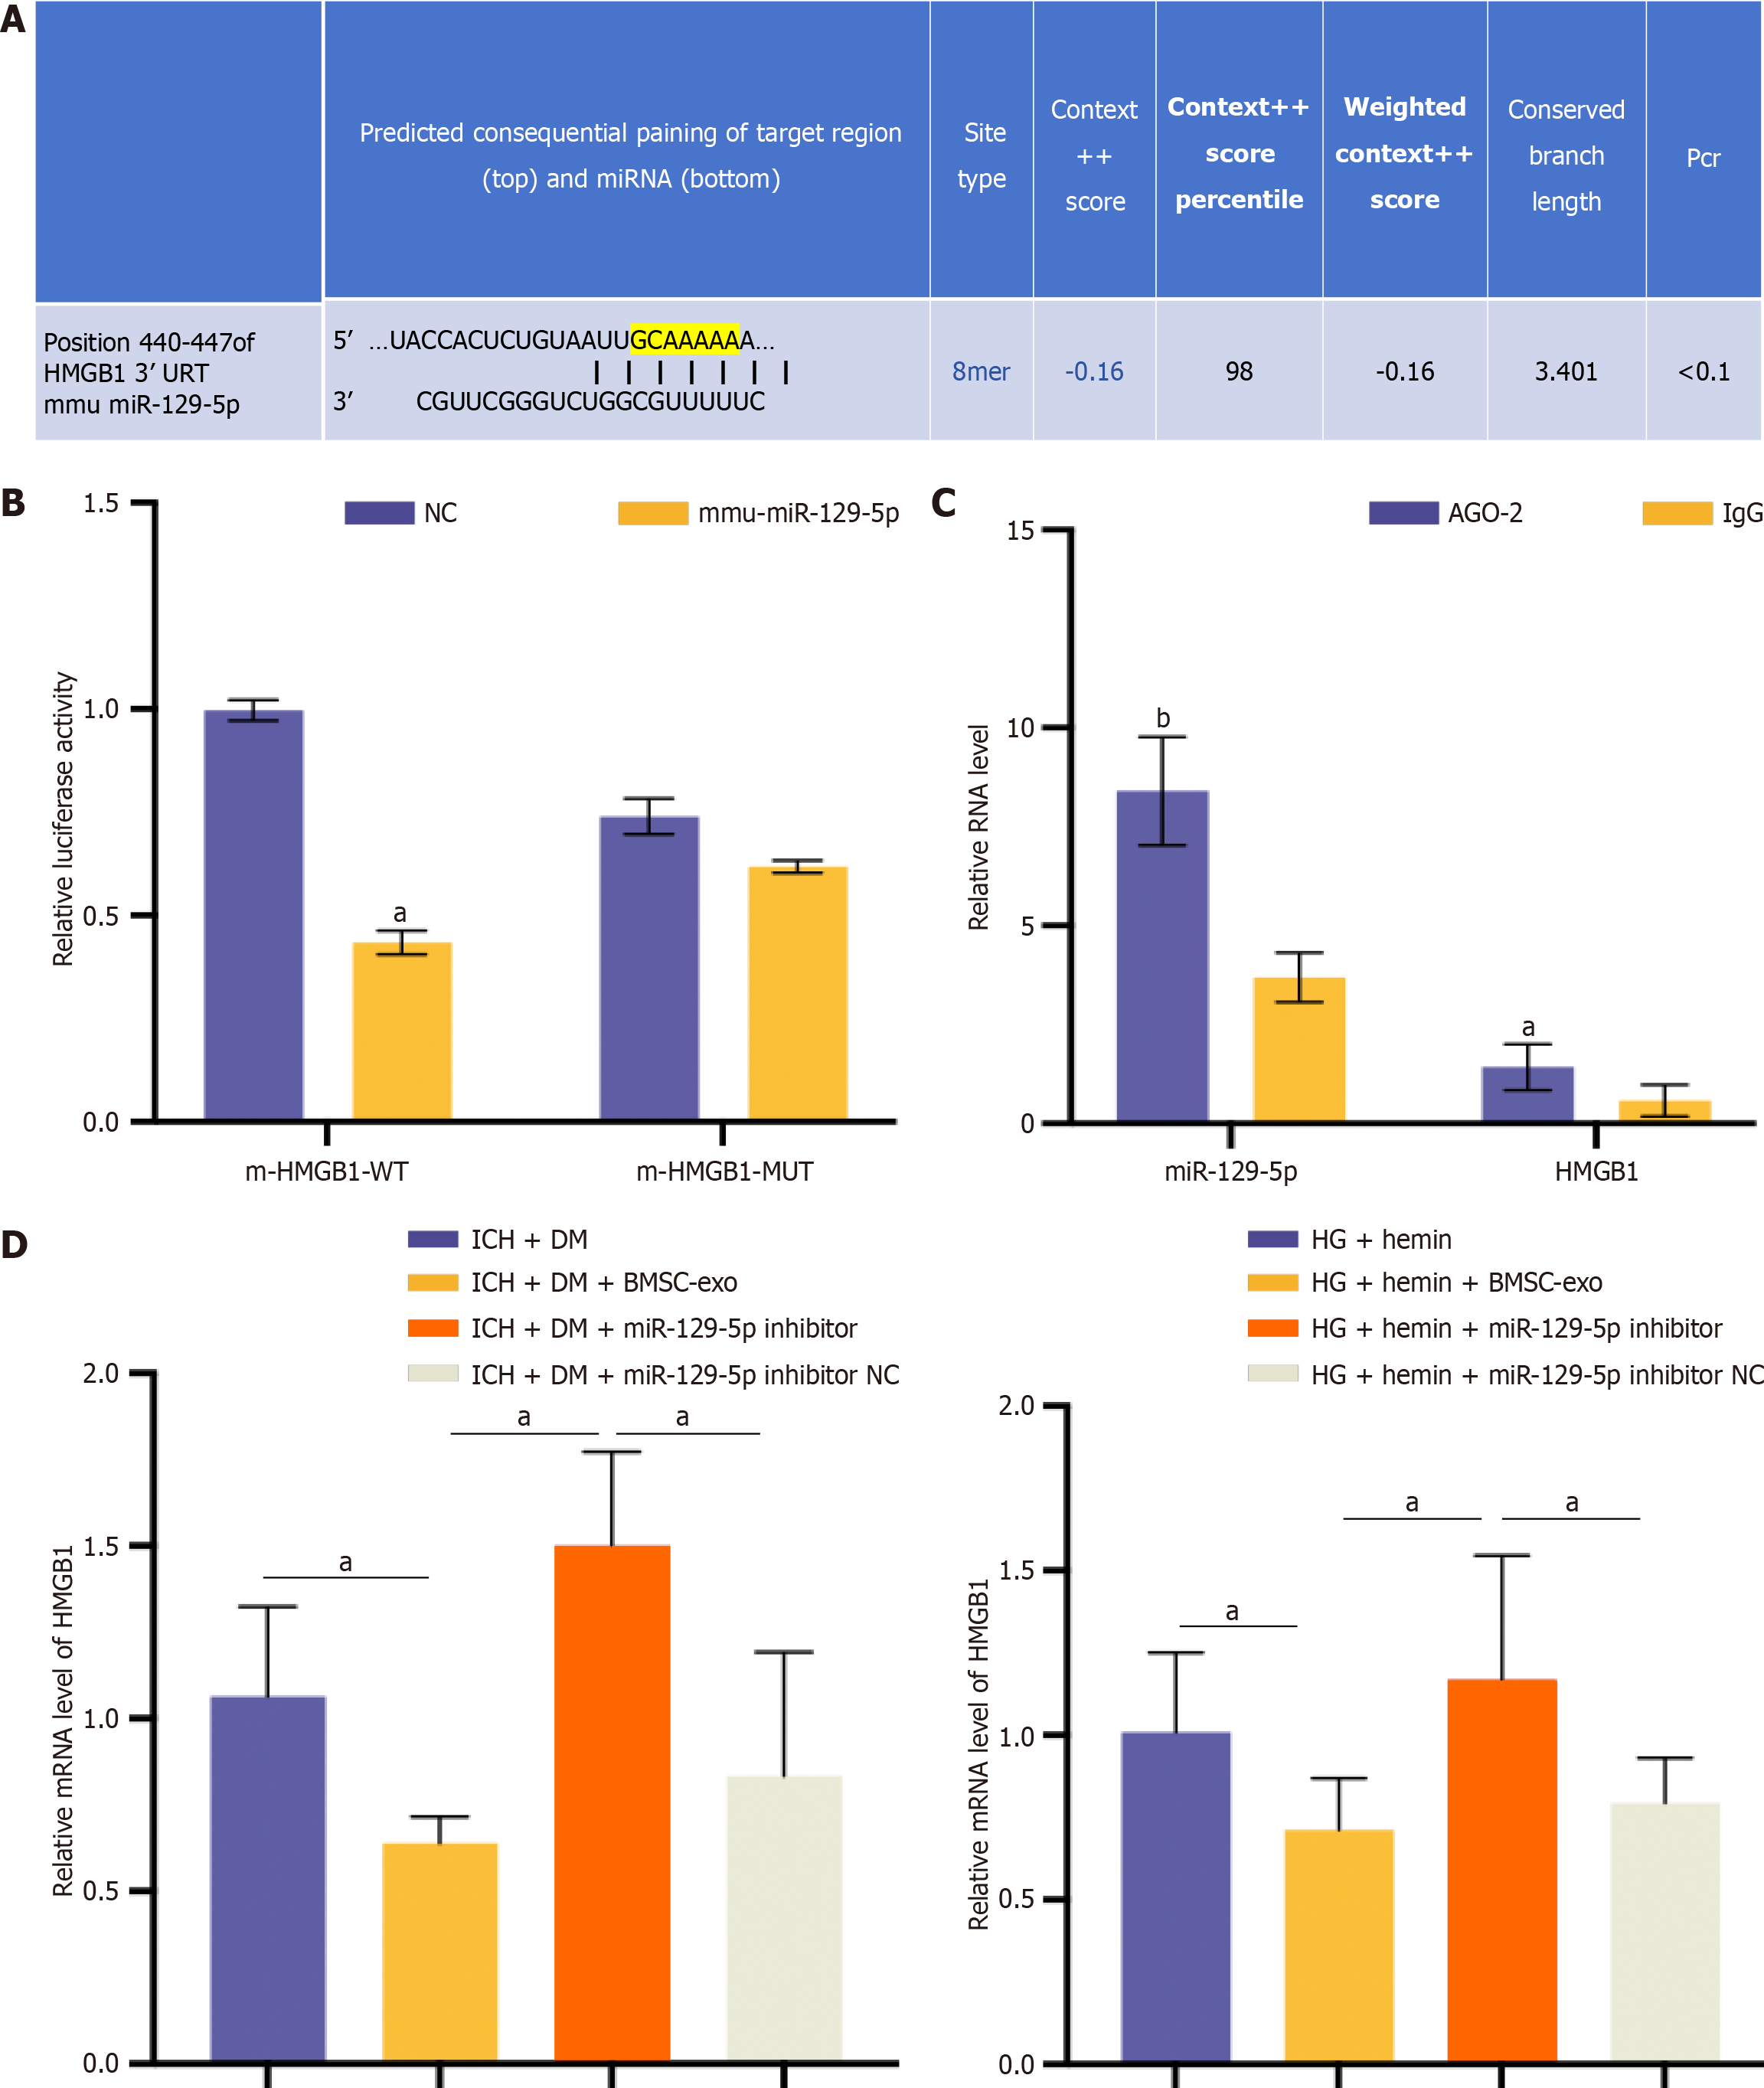
Figure 9 MicroRNA-129-5p targeted and regulated high mobility group box 1 expression.
A: Bioinformatic analysis of binding sites of microRNA (miR-129-5p) and high mobility group box 1 (HMGB1) 3’ untranslated region; B: A dual luciferase reporter gene assay was used to verify the specific binding of miR-129-5p and HMGB1. Experimental data are expressed as mean ± SD. aP < 0.05, negative control (NC) group vs mmu-miR-129-5p group, t-test; C: RNA binding protein immunoprecipitation assay verified the specific binding of miR-129-5p and HMGB1. Experimental data are expressed as mean ± SD. aP < 0.05, AGO-2 vs immunoglobulin G (IgG) (HMGB1 group); bP < 0.01, AGO-2 vs IgG (miR-129-5p group), t-test; D: The expression of HMGB1 was detected by quantitative polymerase chain reaction in vitro and in vivo, and the experimental data are expressed as mean ± SD. In vivo: aP < 0.05, intracerebral hemorrhage (ICH) + diabetes mellitus (DM) group vs ICH + DM + bone marrow-derived mesenchymal stem cell-derived exosomes (BMSC-exo) group; aP < 0.05, ICH +DM + BMSC-exo group vs ICH + DM + miR-129-5p inhibitor group; aP < 0.05, ICH + DM + miR-129-5p inhibitor group vs ICH +DM + miR-129-5p inhibitor NC group, t-test. In vitro: aP < 0.05, high glucose (HG) + hemin group vs HG + hemin + BMSC-exo group; aP < 0.05, HG + hemin + BMSC-exo group vs HG + hemin + miR-129-5p inhibitor group; aP < 0.05, HG + hemin + miR-129-5p inhibitor group vs HG + hemin + miR-129-5p inhibitor NC group, t-test. BMSC-exo: Bone marrow-derived mesenchymal stem cell-derived exosomes; HG: High glucose; NC: Negative control; ICH: Intracerebral hemorrhage; DM: Diabetes mellitus; HMGB1: High-mobility group box 1; DM: Diabetes mellitus; ICH: Intracerebral hemorrhage; IgG: Immunoglobulin G.
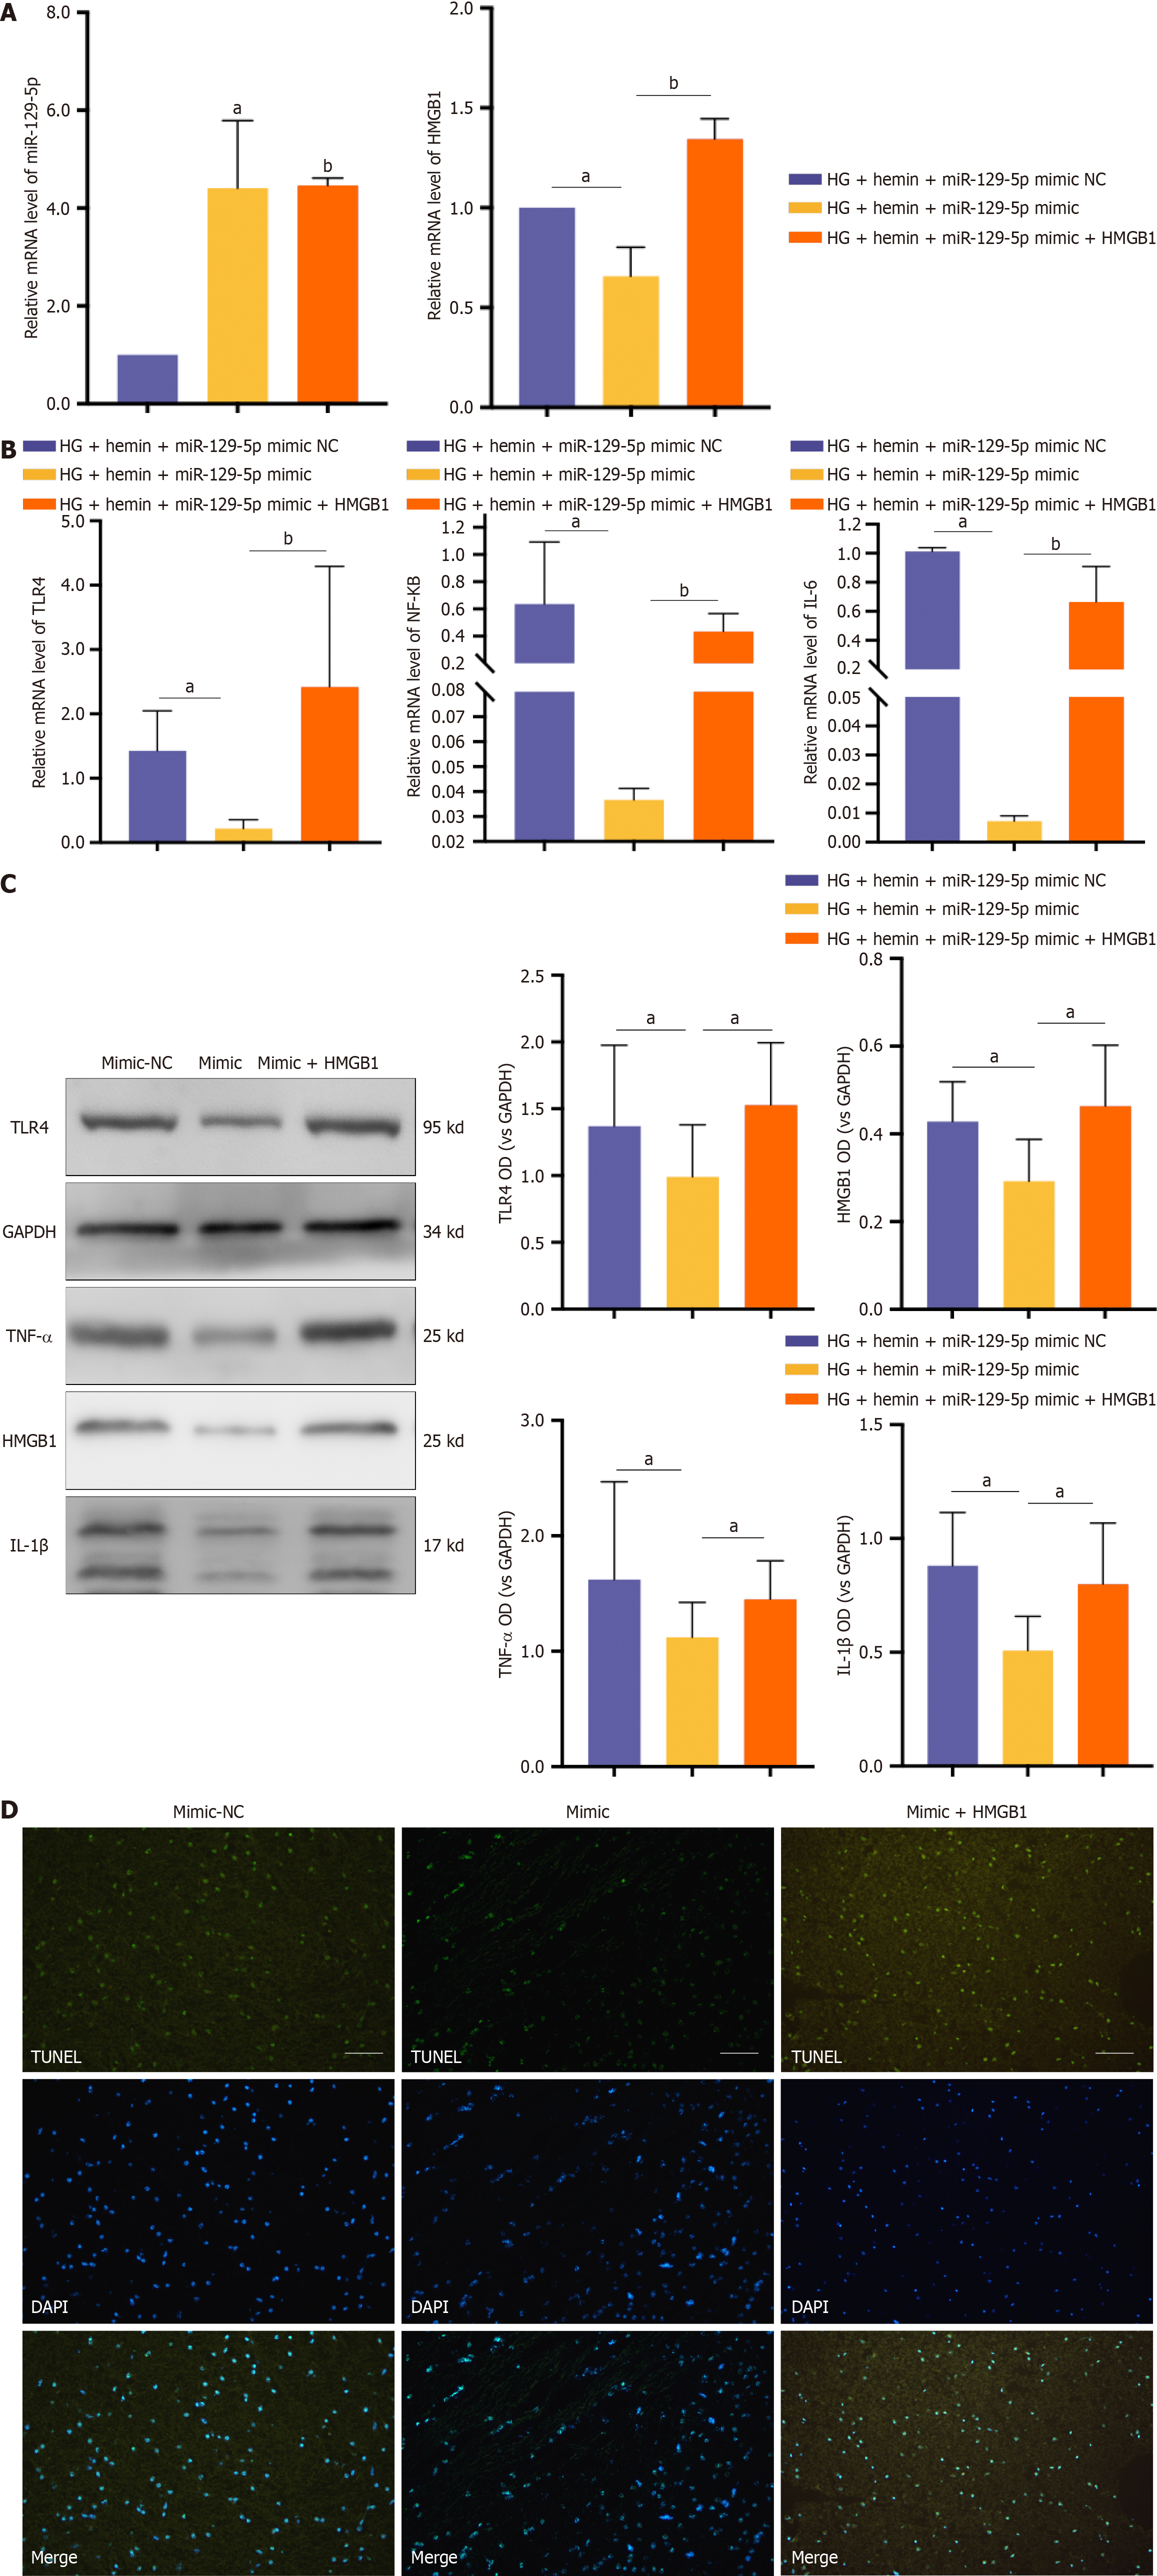
Figure 10 Bone marrow-derived mesenchymal stem cell-derived exosome attenuated neuroinflammation after intracerebral hemorrhage in mice with diabetes by targeting the expression of high-mobility group box 1 in microglia through microRNA-129-5p.
A: Quantitative polymerase chain reaction detected the expression levels of miR-129-5p and high-mobility group box 1 (HMGB1). The experimental data are expressed as mean ± SD. aP < 0.05, high glucose (HG) + hemin + miR-129-5p mimic negative control (NC) group vs HG + hemin + miR-129-5p mimic group; bP < 0.01, HG + hemin + miR-129-5p mimic group vs HG + hemin + miR-129-5p mimic + HMGB1 group, t-test; B: Quantitative polymerase chain reaction detected the expression levels of nuclear factor kappa B (NF-κB), interleukin (IL) 6, and toll-like receptor 4 inflammatory factors. The experimental data are expressed as mean ± SD. aP < 0.01, HG + hemin + miR-129-5p mimic NC group vs HG + hemin + miR-129-5p mimic group; bP < 0.001, HG + hemin + miR-129-5p mimic group vs HG + hemin + miR-129-5p mimic + HMGB1 group, t-test; C: Western blot detected the expression level of inflammatory factors, and the experimental data are expressed as mean ± SD. aP < 0.05, HG + hemin + miR-129-5p mimic NC group vs HG + hemin + miR-129-5p mimic group, t-test; D: Terminal deoxynucleotidyl transferase dUTP nick end labeling of neuronal apoptosis. The mimic NC group was HG + hemin + miR-129-5p mimic NC, the mimic group was HG + hemin + miR-129-5p mimic, and the mimic + HMGB1 group was HG + hemin + miR-129-5p mimic + HMGB1 in Panels B and D. HG: High glucose; NC: Negative control; HMGB1: High-mobility group box 1; TLR4: Toll-like receptor 4; IL: Interleukin; NF-κB: Nuclear factor kappa B; TNF: Tumor necrosis factor.
- Citation: Wang YY, Li K, Wang JJ, Hua W, Liu Q, Sun YL, Qi JP, Song YJ. Bone marrow-derived mesenchymal stem cell-derived exosome-loaded miR-129-5p targets high-mobility group box 1 attenuates neurological-impairment after diabetic cerebral hemorrhage. World J Diabetes 2024; 15(9): 1979-2001
- URL: https://www.wjgnet.com/1948-9358/full/v15/i9/1979.htm
- DOI: https://dx.doi.org/10.4239/wjd.v15.i9.1979


