Copyright
©The Author(s) 2024.
World J Diabetes. Sep 15, 2024; 15(9): 1962-1978
Published online Sep 15, 2024. doi: 10.4239/wjd.v15.i9.1962
Published online Sep 15, 2024. doi: 10.4239/wjd.v15.i9.1962
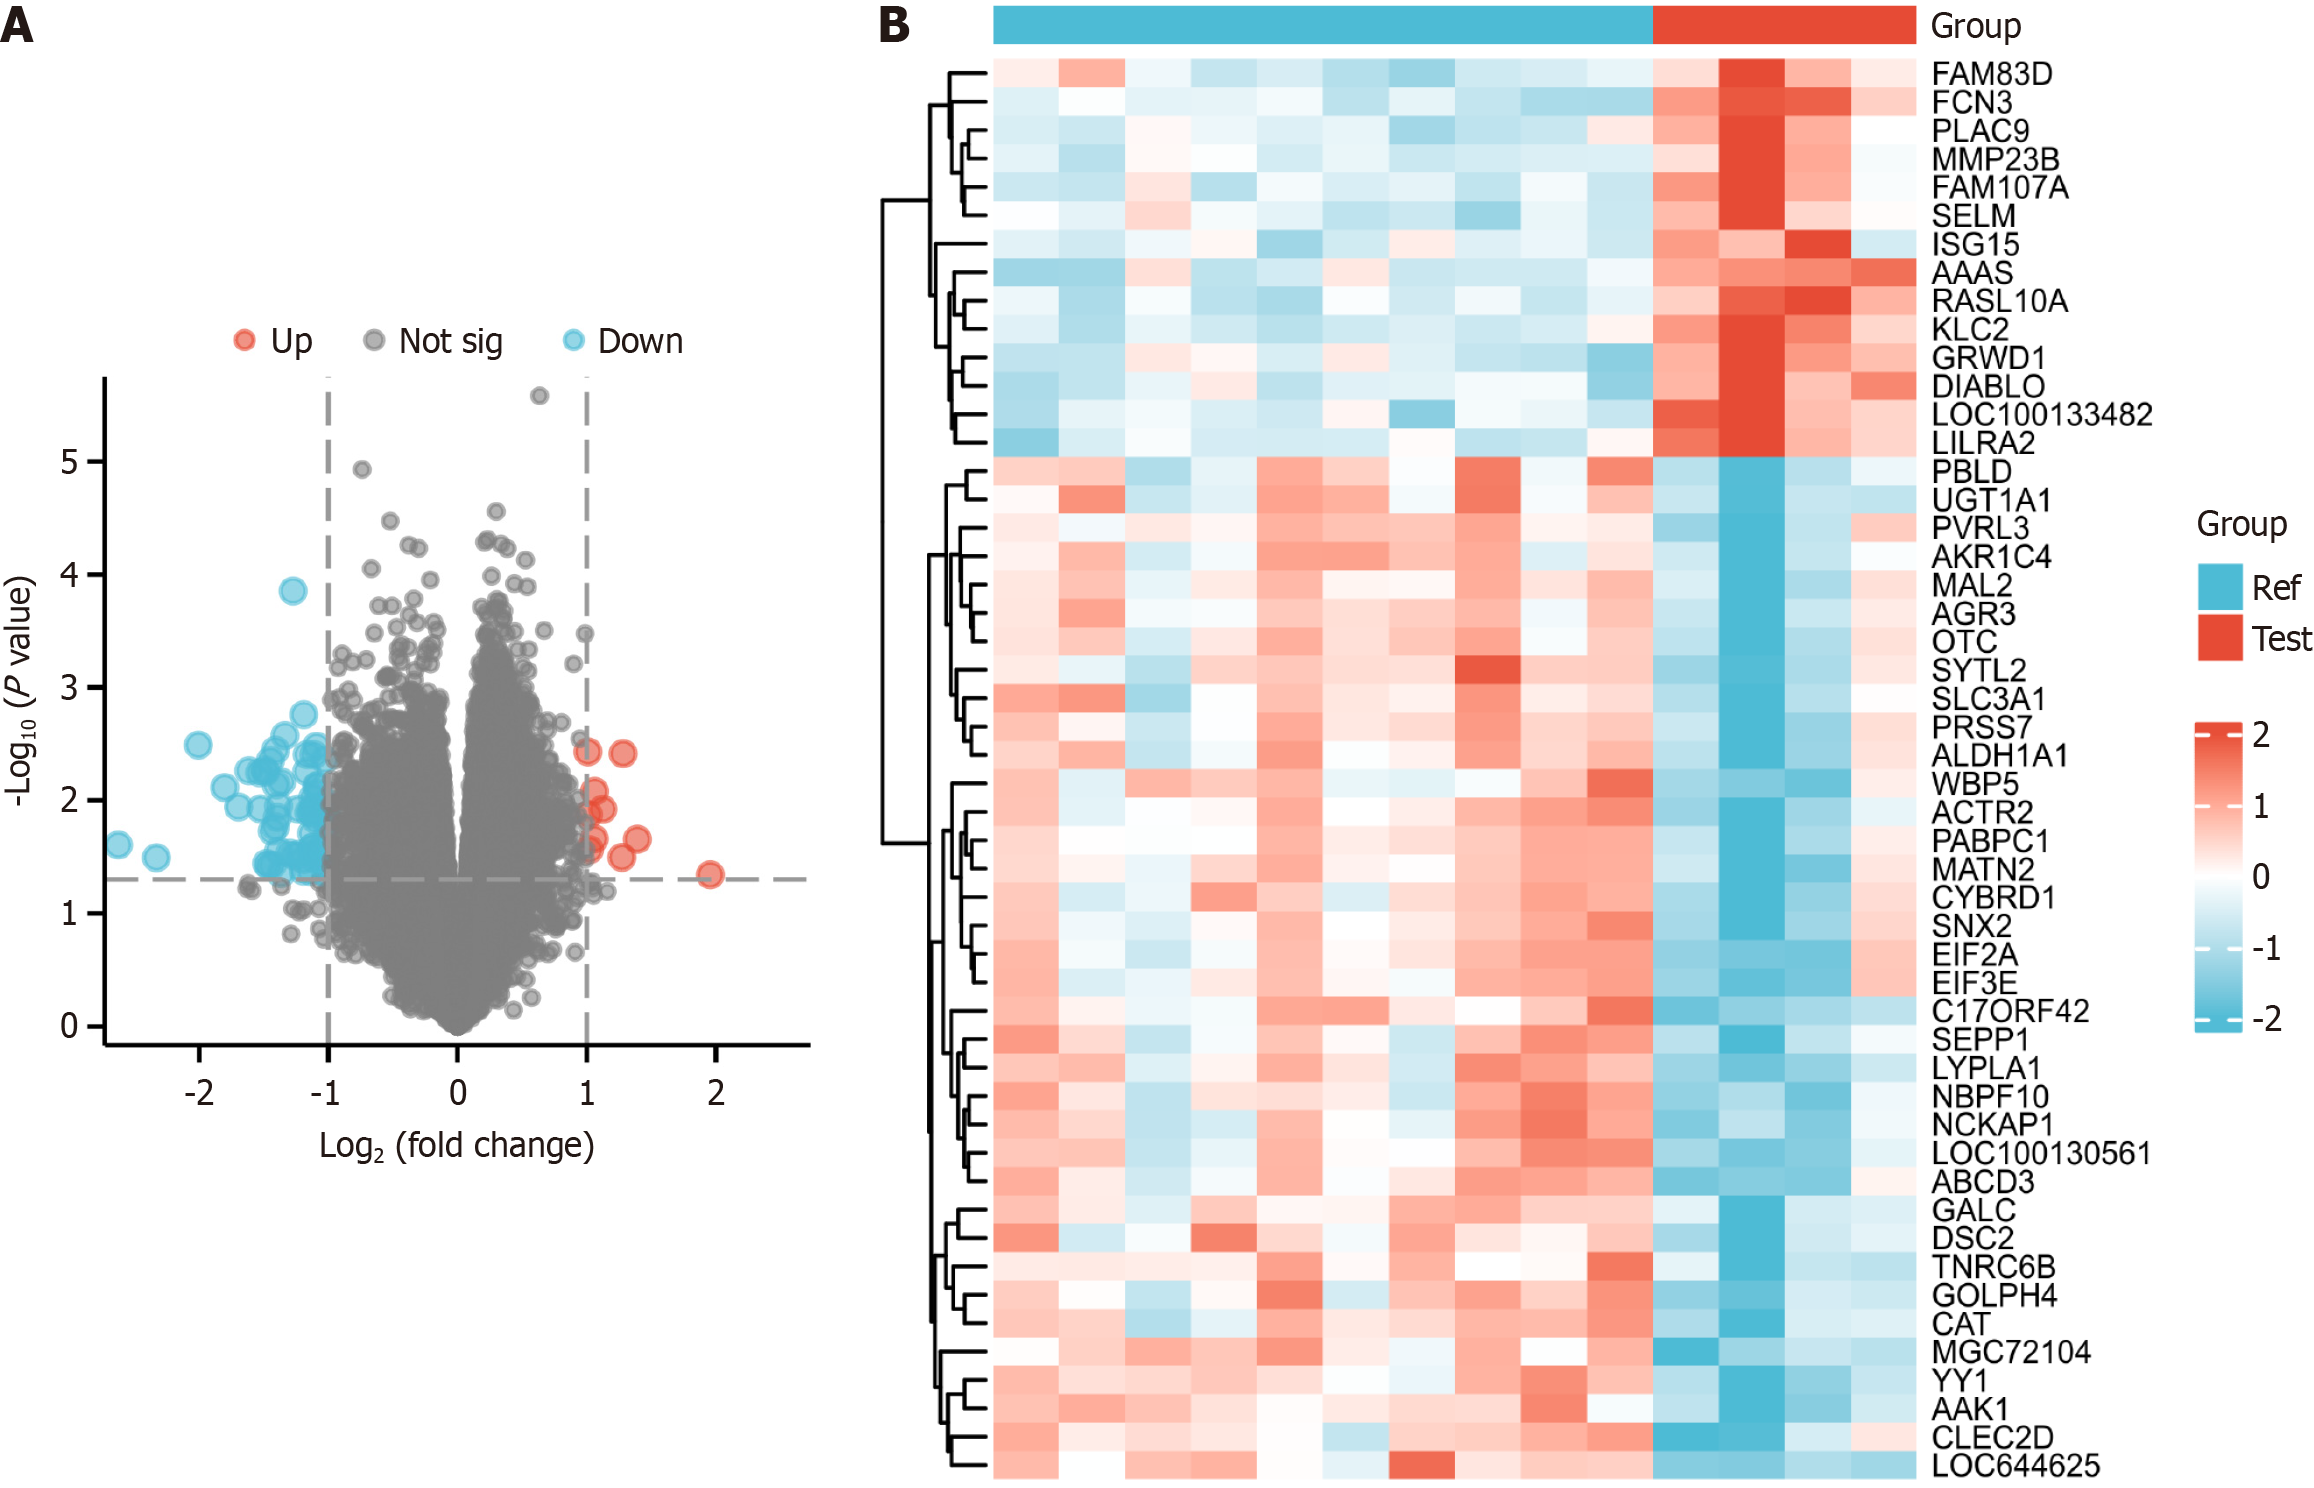
Figure 1 Data processing and differentially expressed gene identification.
A: Heatmap of sample-to-sample correlation. The diabetes group displayed a stronger intragroup correlation than the control group; B: Volcano plot generated using the limma R tool, showcasing all differentially expressed genes in the control and diabetes groups.
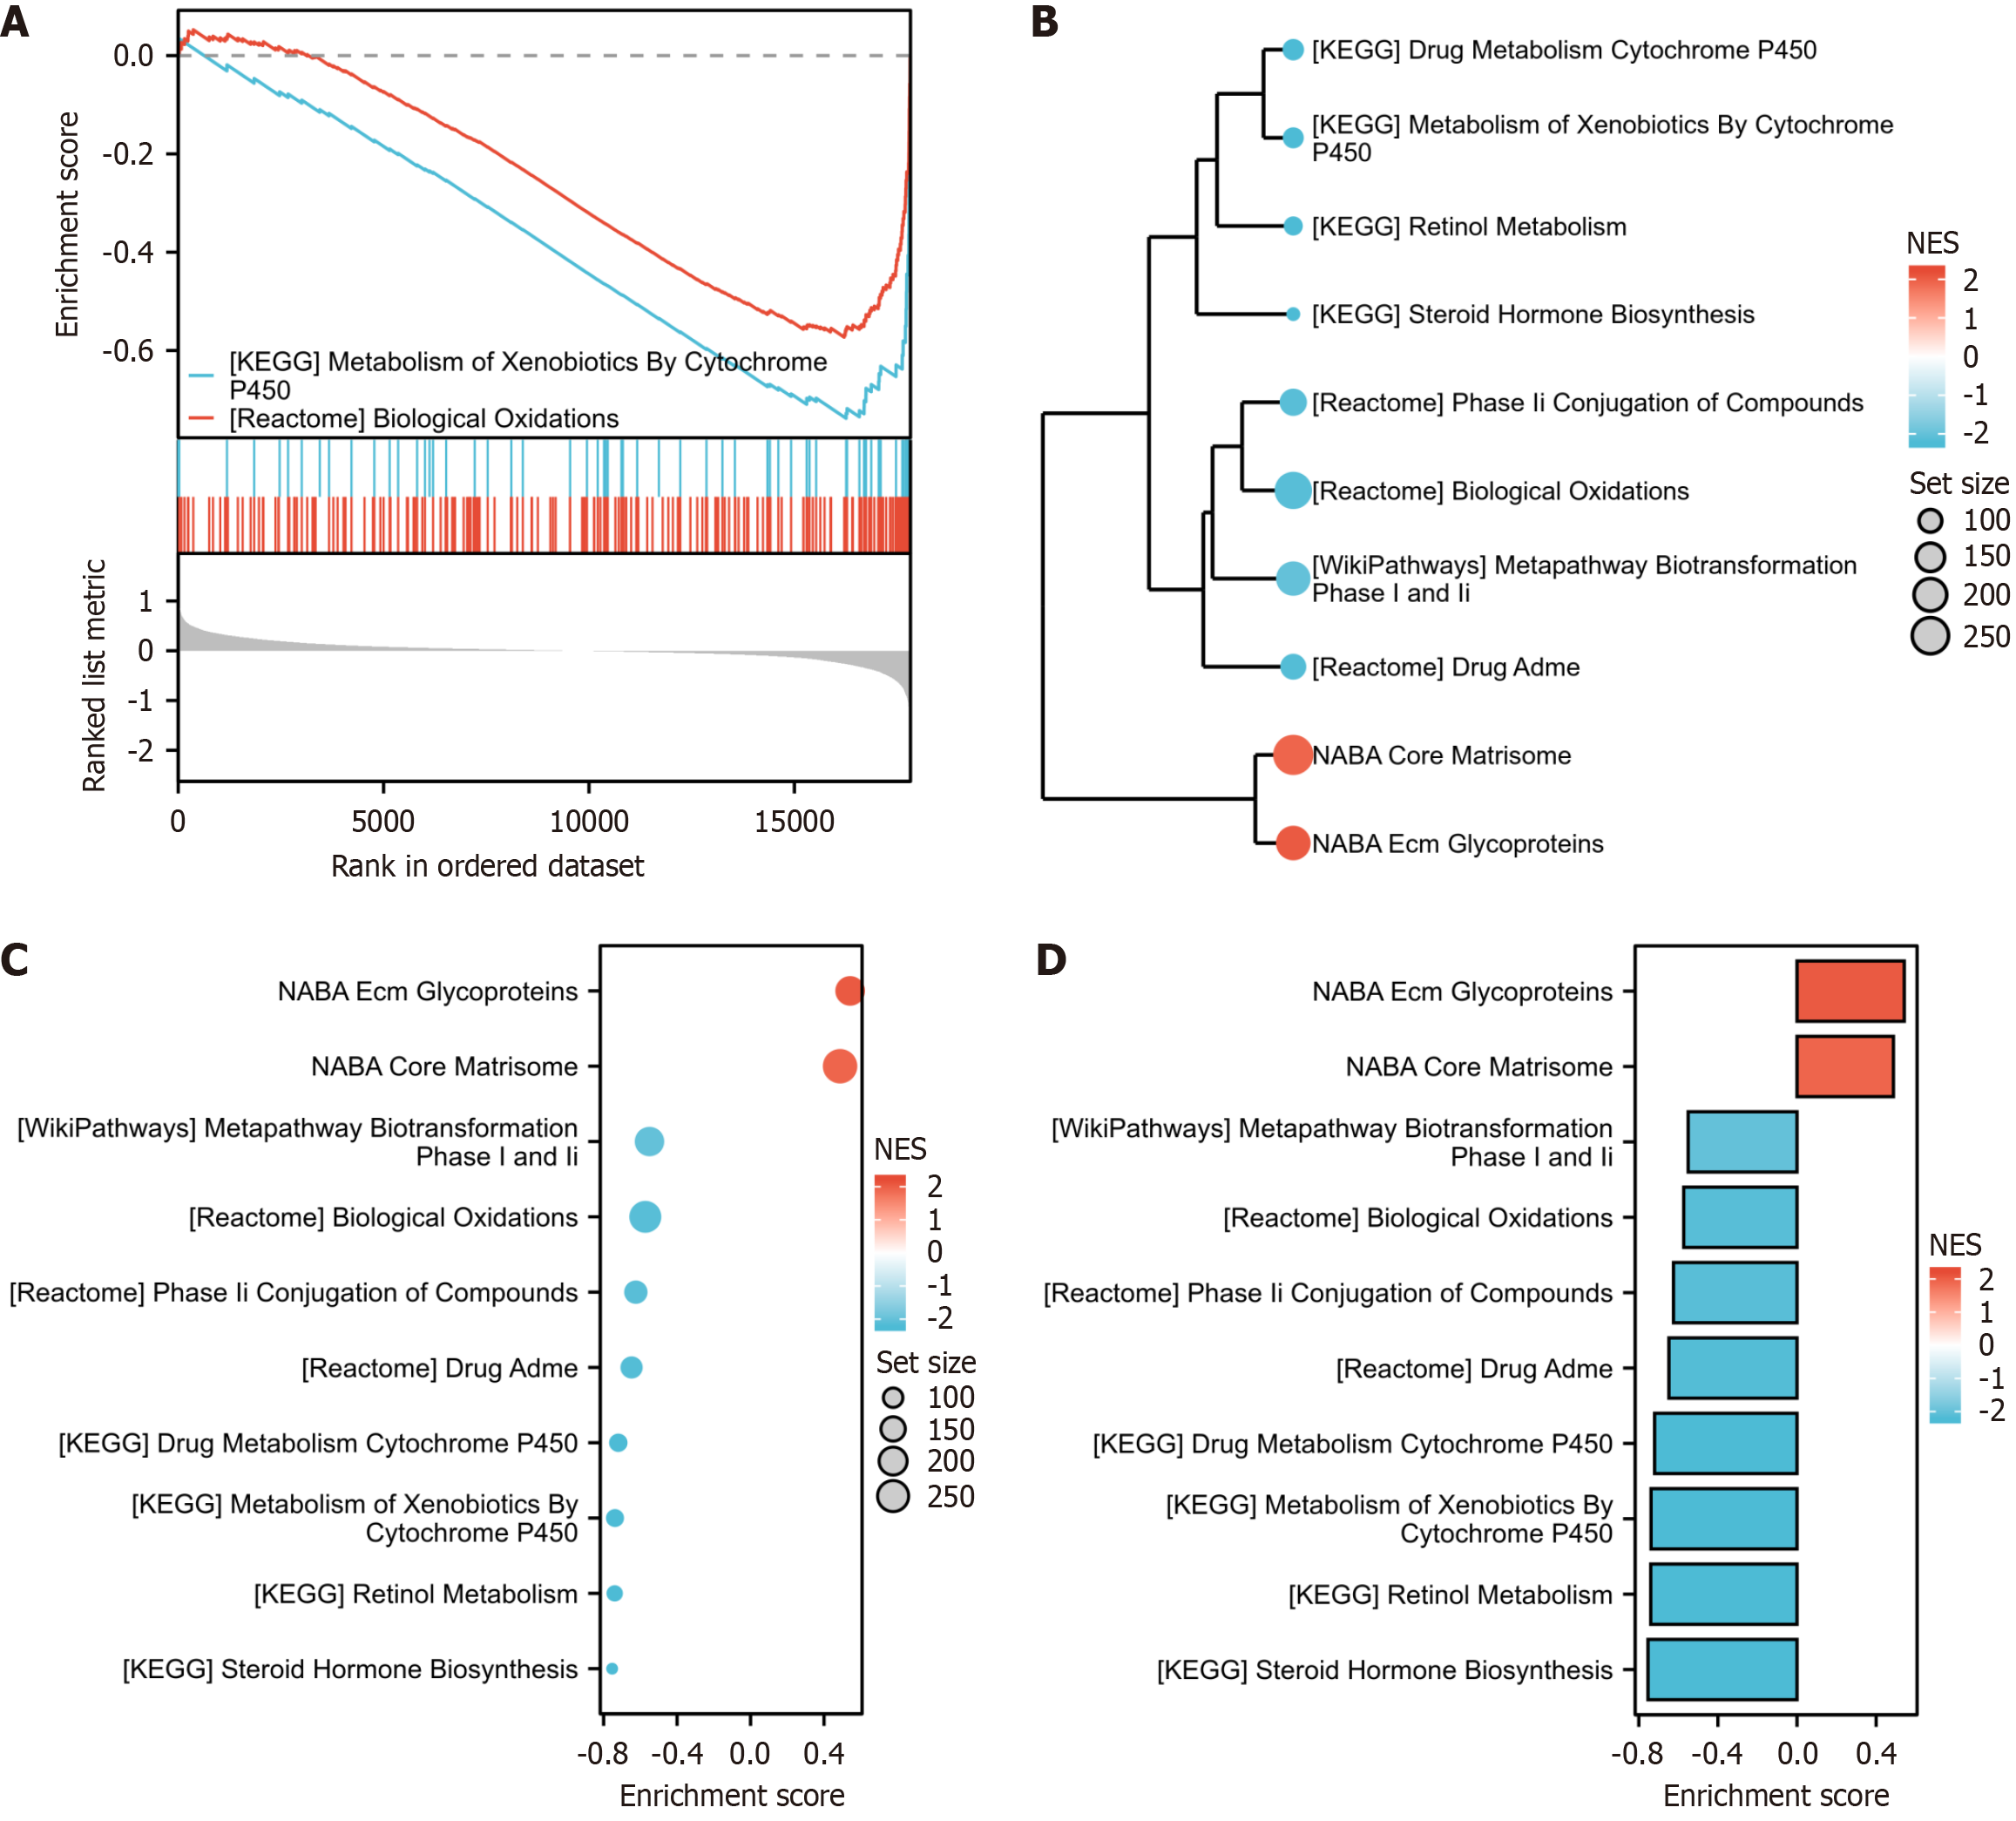
Figure 2 Functional and pathway enrichment analyses performed on the Gene Set Enrichment Analysis results.
Functional and pathway enrichment analyses were conducted using DAVID to gain a comprehensive understanding of the role of the 10 differentially regulated pathways identified in the intestinal tissue dataset. A-D: Genes displaying significant enrichment in various biological processes: Reactome metabolism of fat-soluble vitamins, Kyoto Encyclopedia of Genes and Genomes complement and coagulation cascades, wp network map of the sarscov2 signaling pathway, reactome olfactory signaling pathway, reactome metabolism of vitamins and cofactors, reactome biological oxidations, reactome neutrophil degranulation, reactome metabolism of amino acids and derivatives, reactome metabolism of lipids, and reactome platelet activation signaling and aggregation. KEGG: Kyoto Encyclopedia of Genes and Genomes.
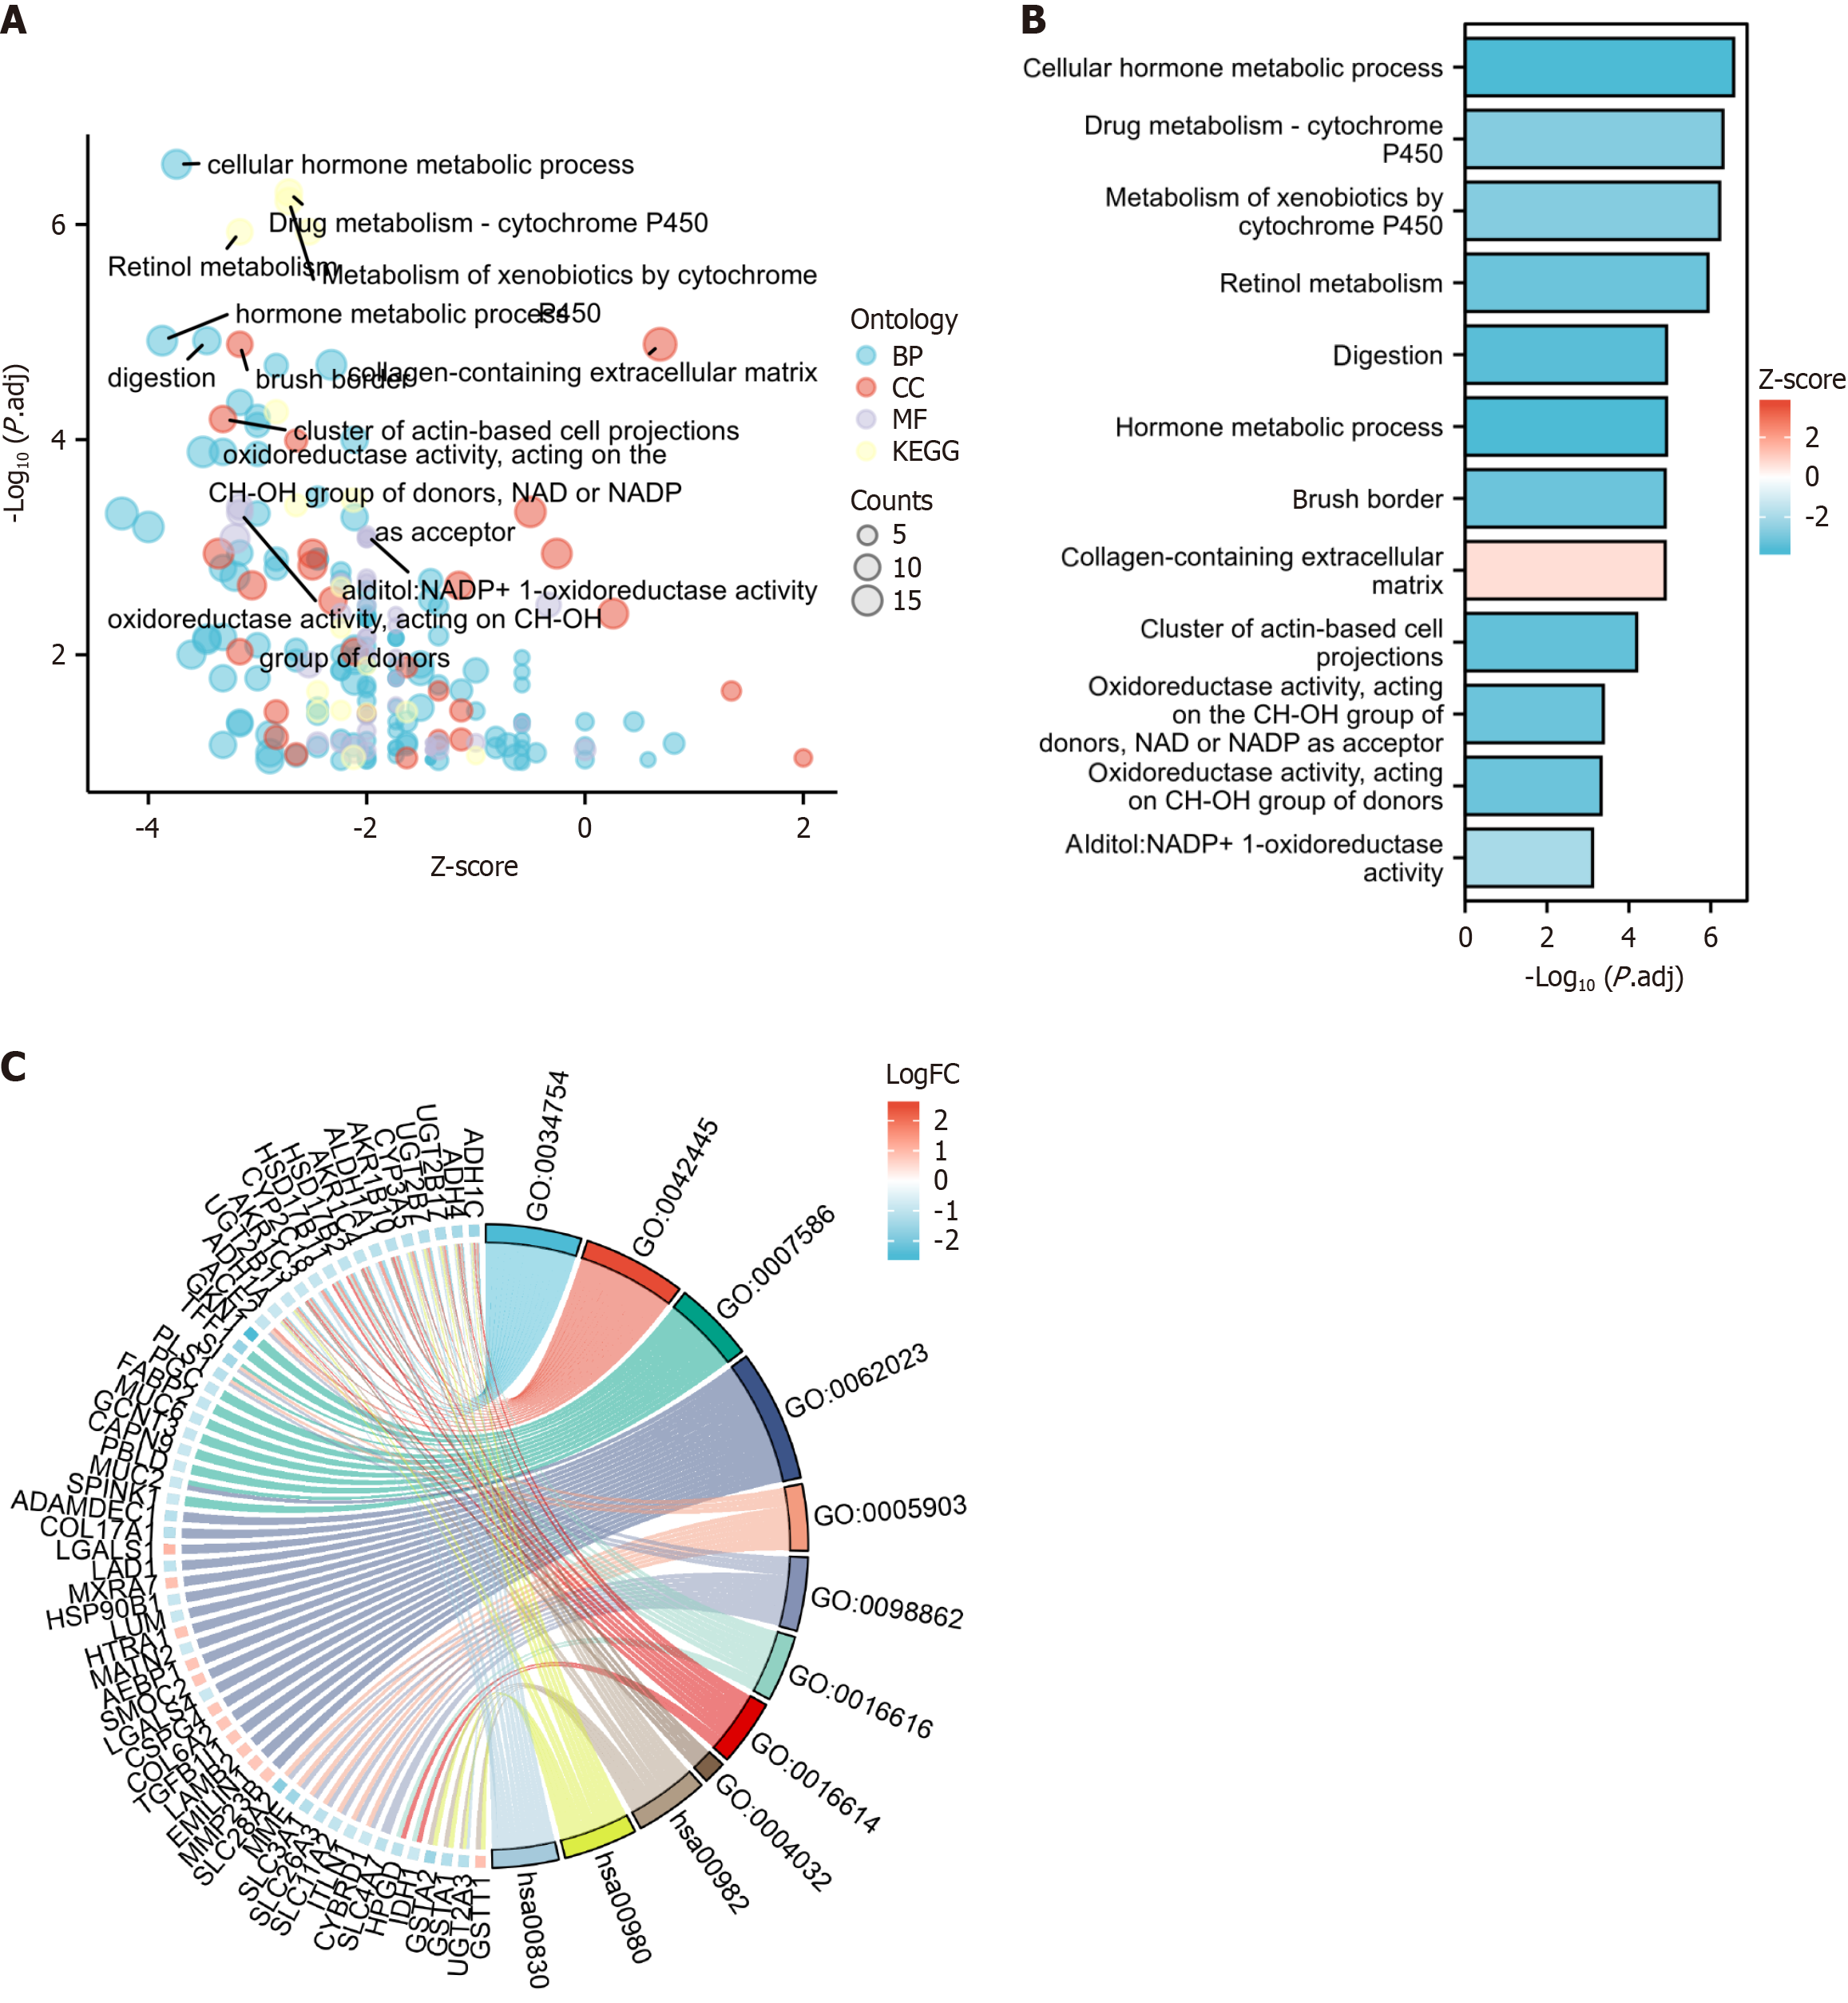
Figure 3 Functional and pathway enrichment.
Functional and pathway enrichment analyses were conducted using DAVID to gain a comprehensive understanding of the role played by the 31 differentially expressed genes identified in the brain tissue dataset. A-C: Main identified pathways: Cellular hormone metabolic process, hormone metabolic process, digestion, response to toxic substance, retinol metabolic process, collagen-containing extracellular matrix, brush border, and cluster of actin-based cell projections. KEGG: Kyoto Encyclopedia of Genes and Genomes; BP: Biological process; CC: Cell composition; MF: Molecular function; GO:0034754: Cellular hormone metabolic process; GO:0042445: Hormone metabolic process; GO:0007586: Digestion; GO:0062023: Collagen-containing extracellular matrix; GO:0005903: Brush border; GO:0098862: Cluster of actin-based cell projections; GO:0016616: Oxidoreductase activity, acting on the CH-OH group of donors, NAD or NADP as acceptor; GO:0016614: Oxidoreductase activity, acting on CH-OH group of donors; GO:0004032: Alditol:NADP+ 1-oxidoreductase activity; hsa00982: Drug metabolism-cytochrome P450; hsa00980: Metabolism of xenobiotics by cytochrome P450; hsa00830: Retinol metabolism.
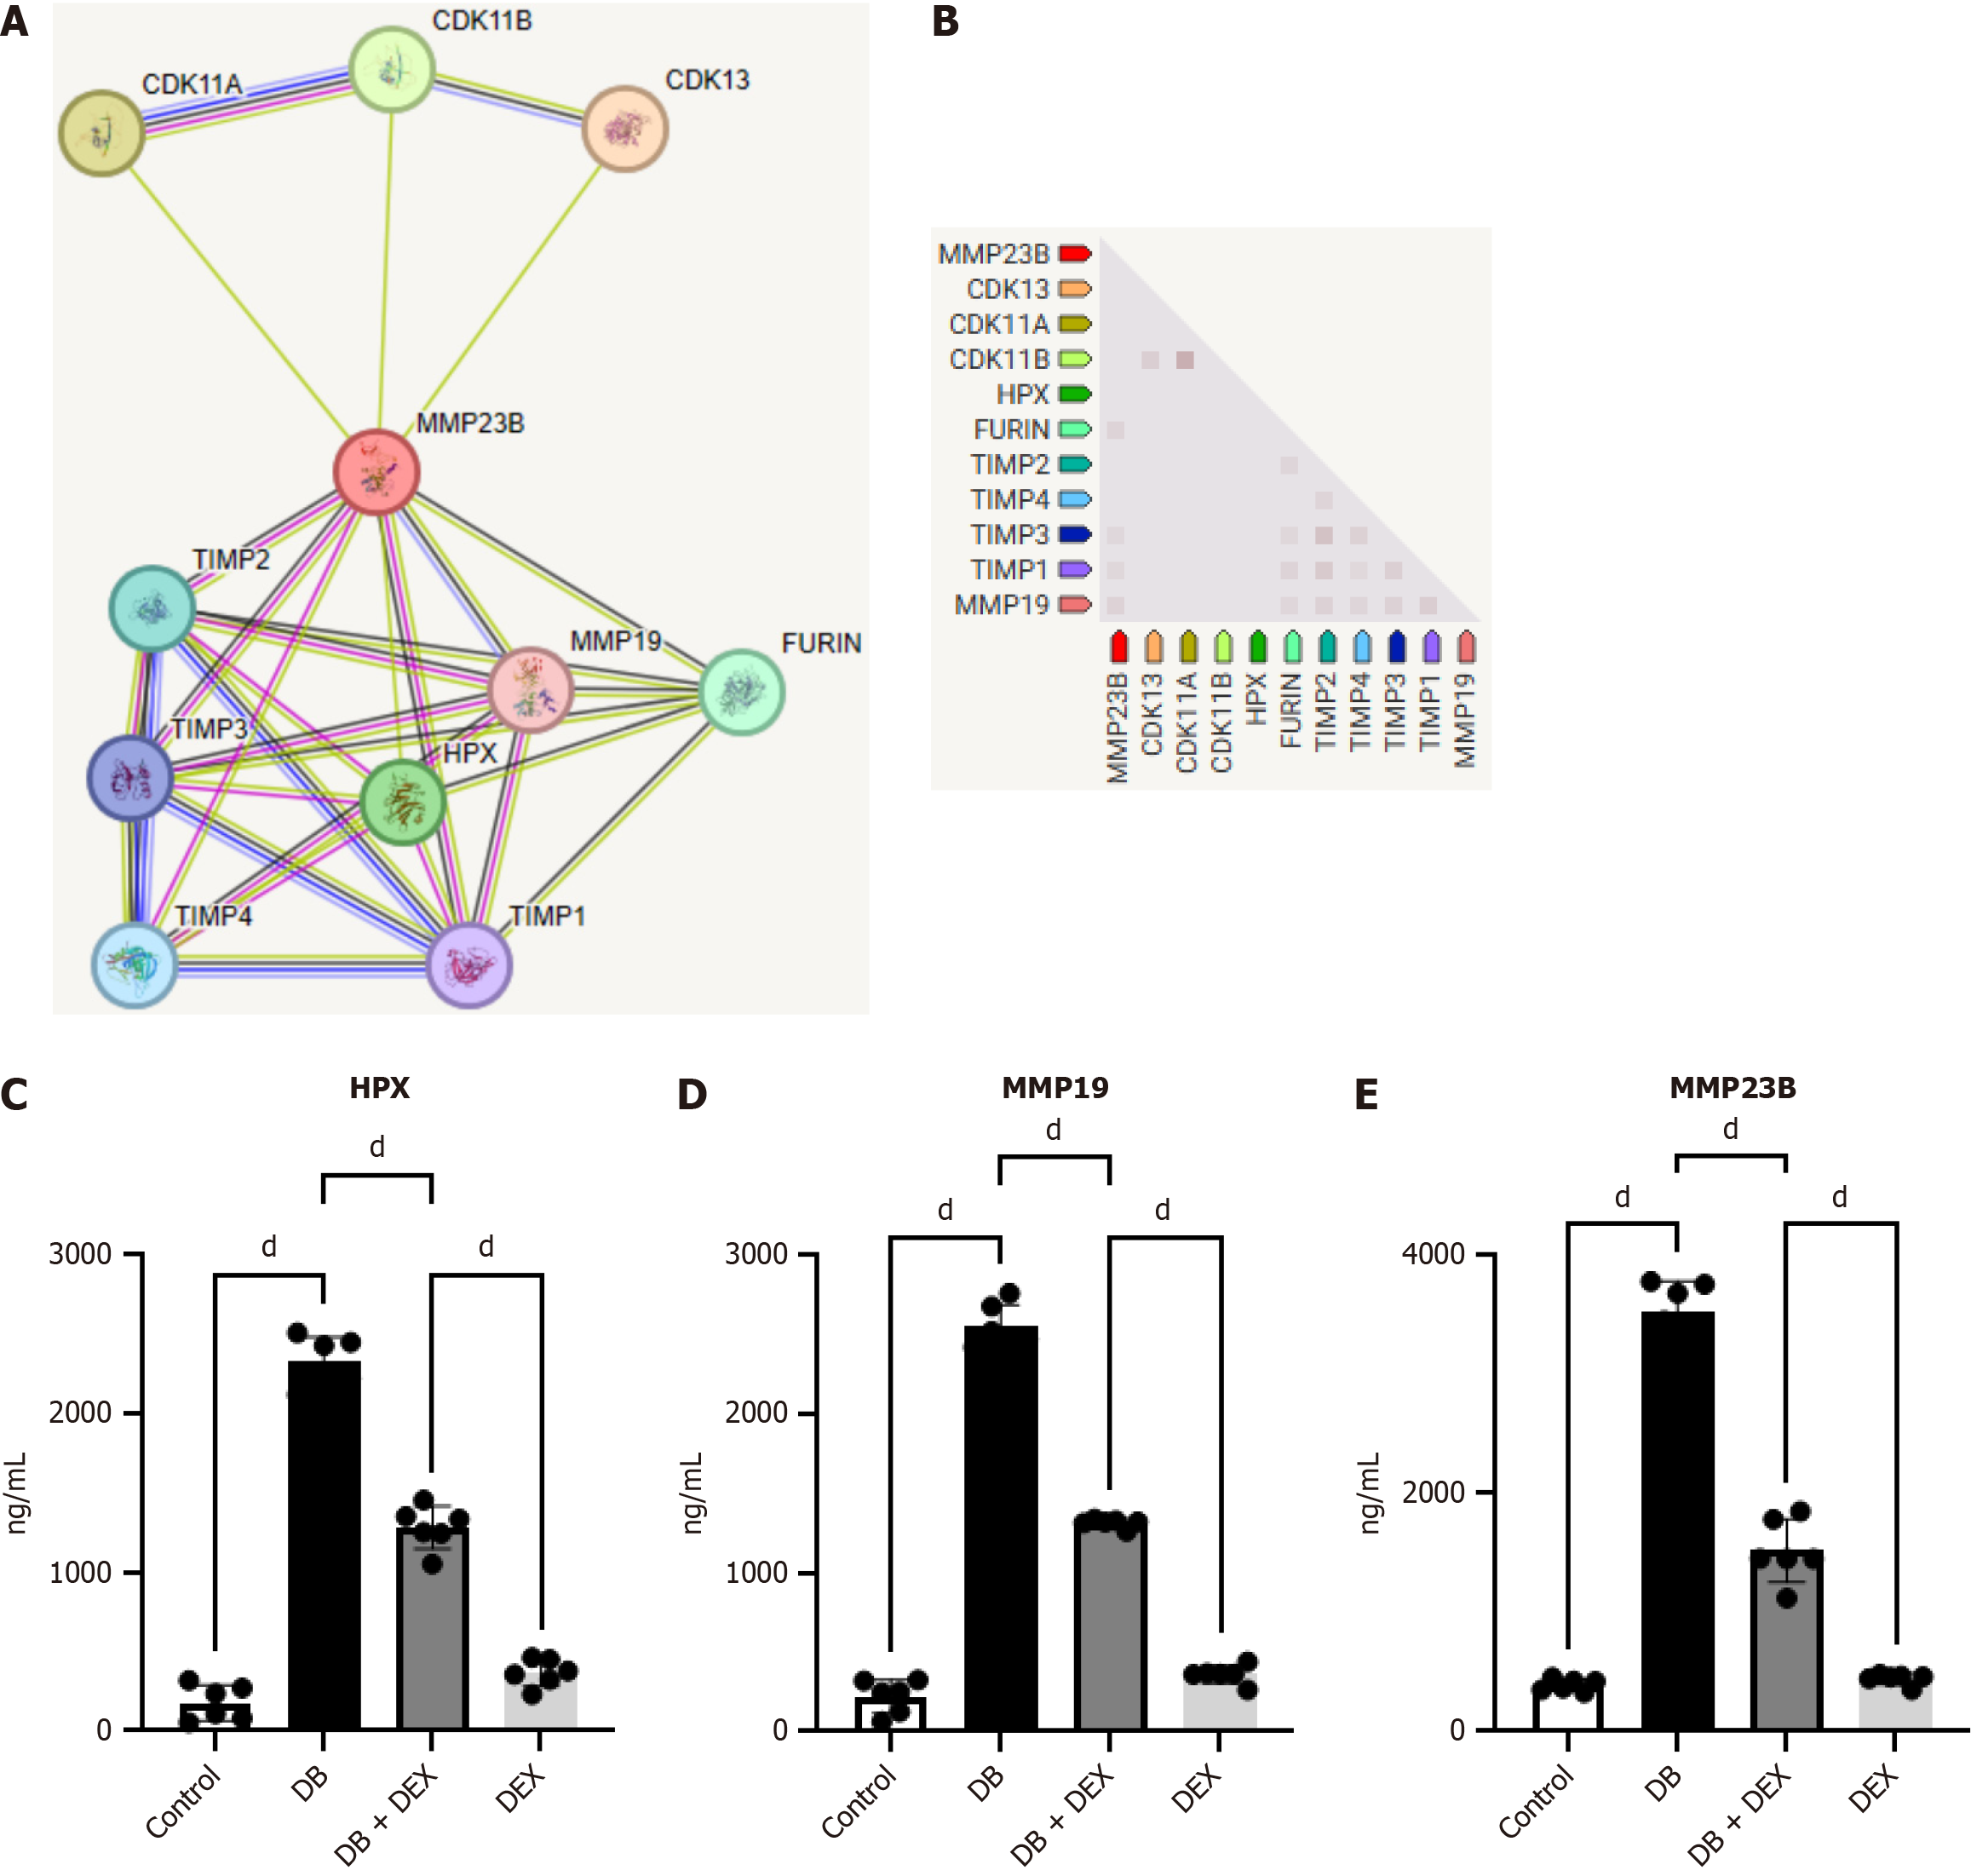
Figure 4 Protein-protein interaction network analysis and detected inflammatory factors.
The protein-protein interaction network comprised five nodes representing molecular pathways and processes associated with the five core differentially expressed genes. A and B: Working modules were developed using the MCODE plugin for Cytoscape; C-E: The results revealed a module of nine genes. The expressions of HPX, MMP19, and MMP23 were elevated in the diabetes group. The expression levels of inflammatory factors decreased upon dexmedetomidine compared with those in the control group. dP < 0.0001. DB: Diabetes group; DEX: Dexmedetomidine.
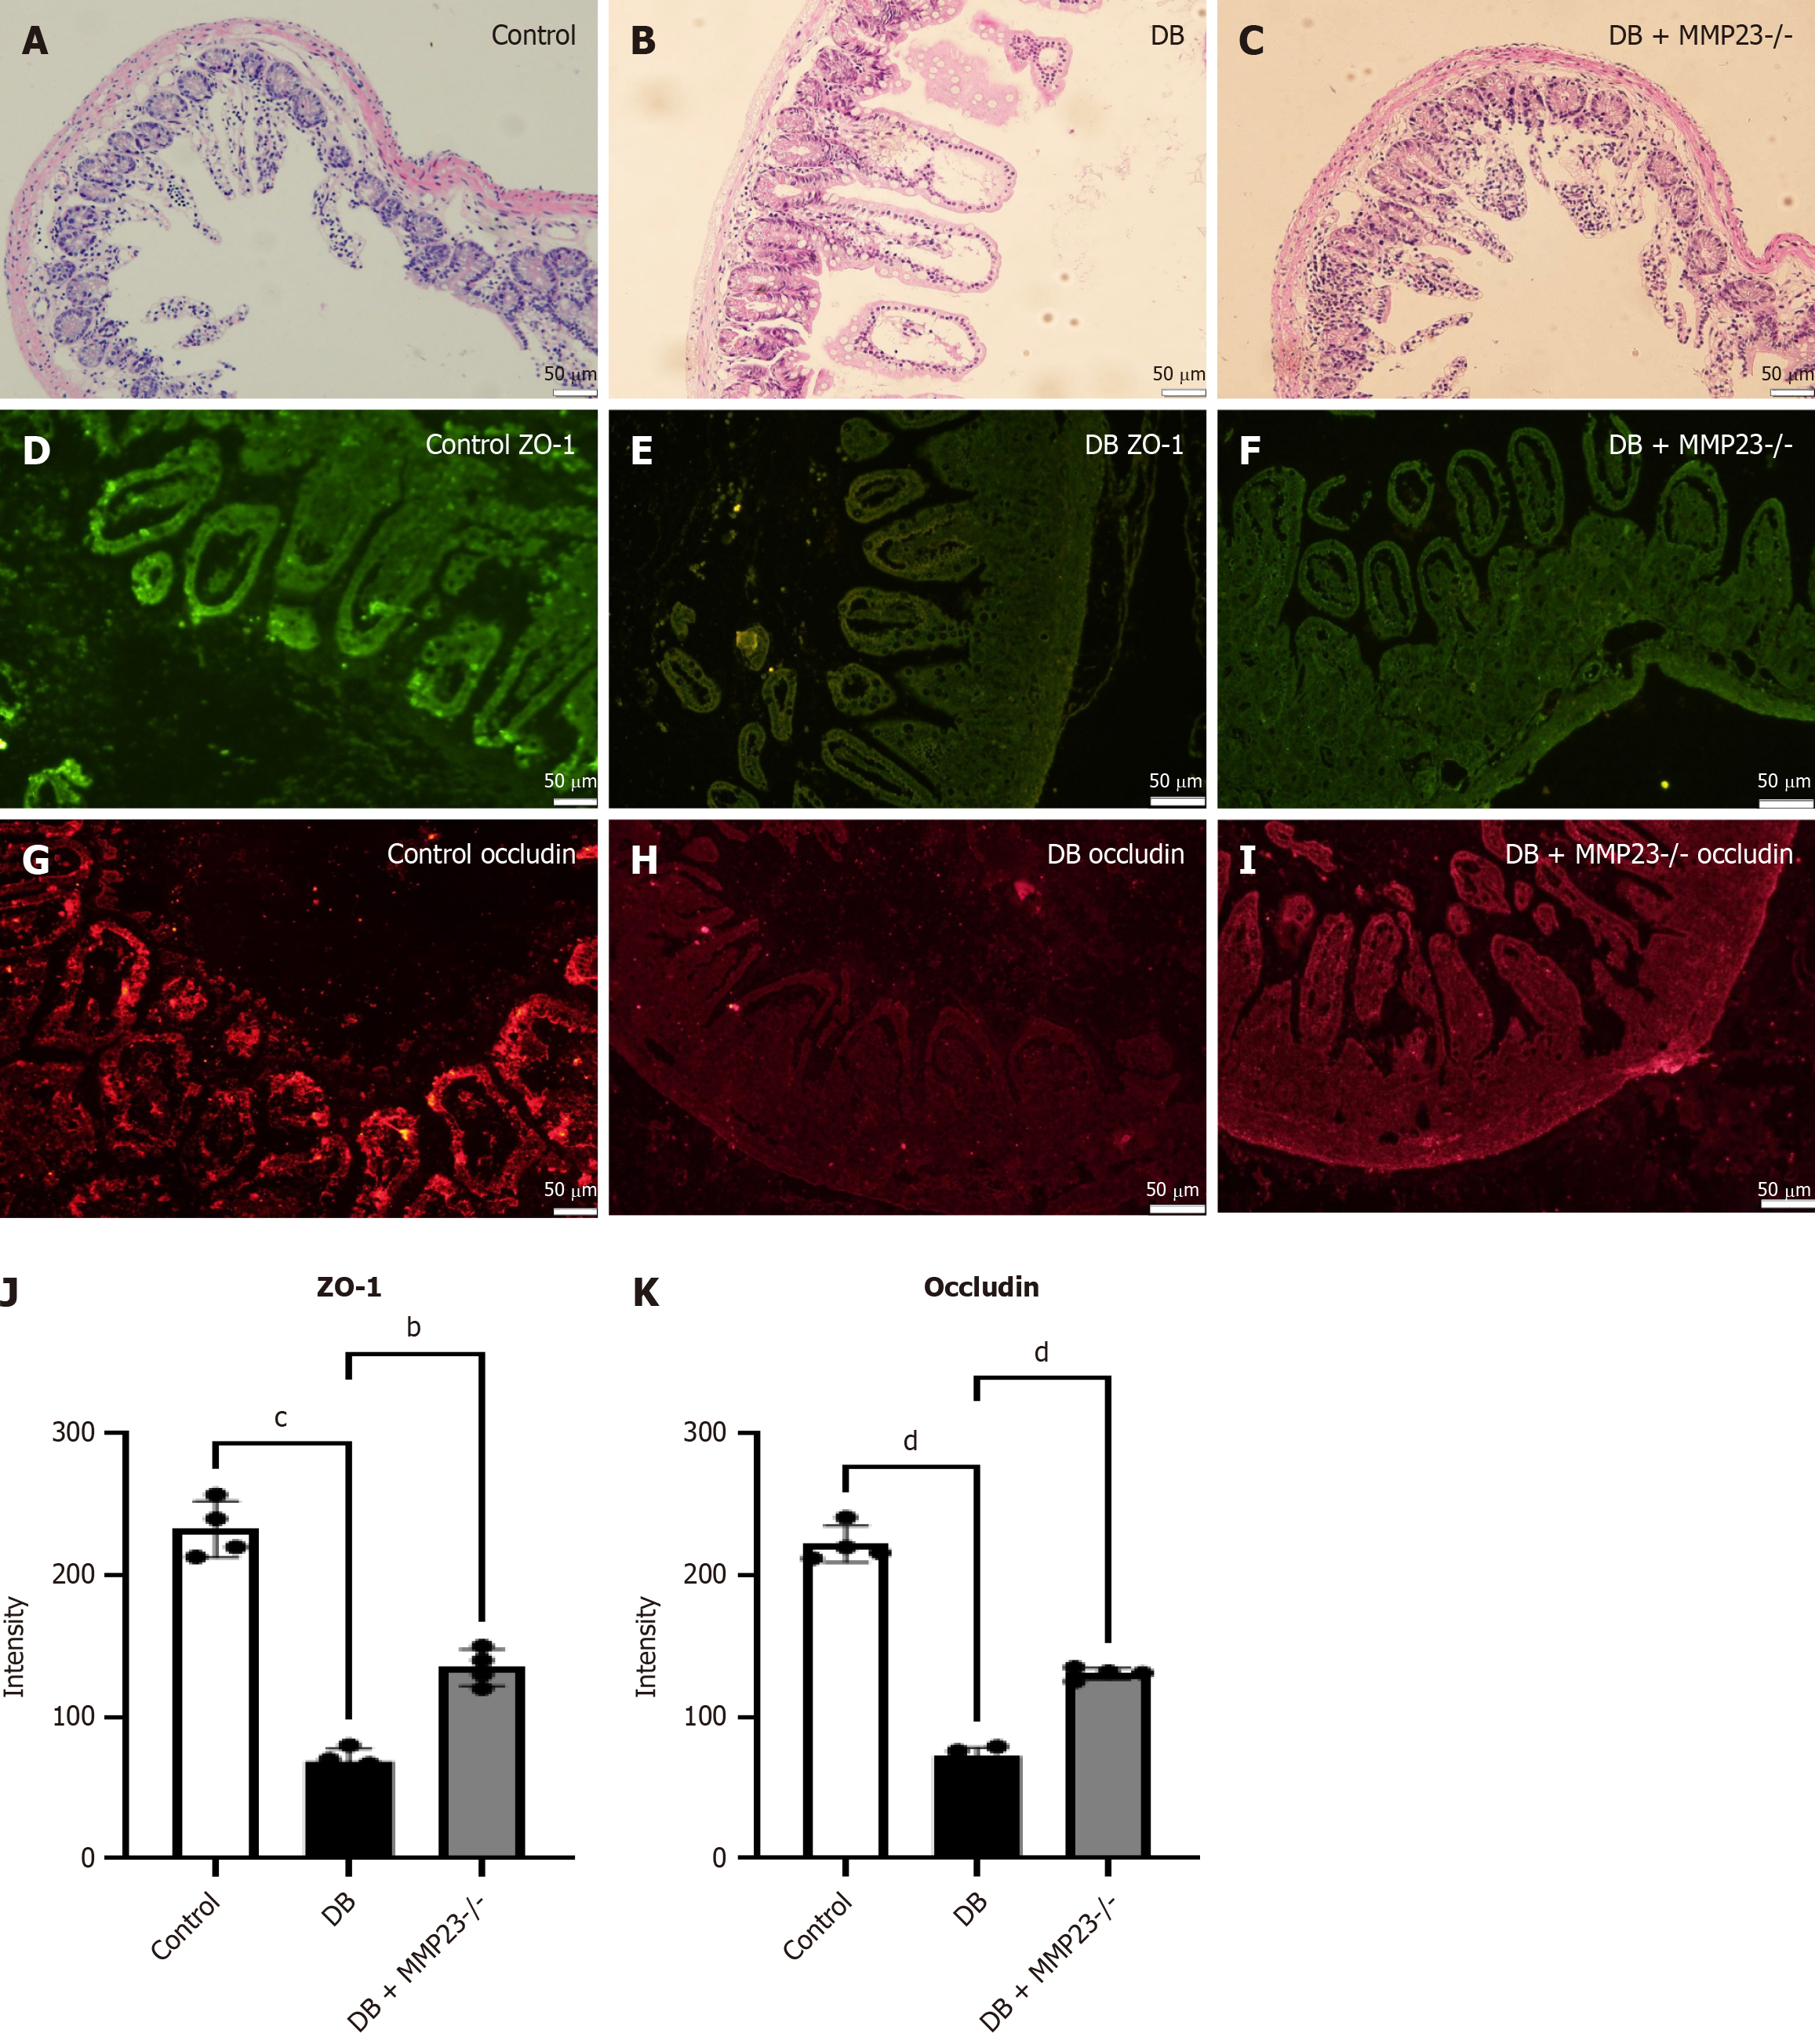
Figure 5 The severity of diabetes-induced intestinal injury was positively correlated with MMP23 expression in mice.
MMP23 KO mice were used to investigate the role of MMP23 in intestinal injury. A-C: Hematoxylin and eosin staining revealed a less severe injury in the intestines of MMP23 knockout mice; D-I: Immunofluorescence analysis demonstrated a significant reduction in the intestinal injury marker after 24 hours of treatment; J and K: The protein expression of occludin and ZO-1 was significantly upregulated following MMP23 knockout, as revealed by immunofluorescence analysis. Scale bar = 50 μm. bP < 0.01, cP < 0.001, dP < 0.0001. DB: Diabetes group.
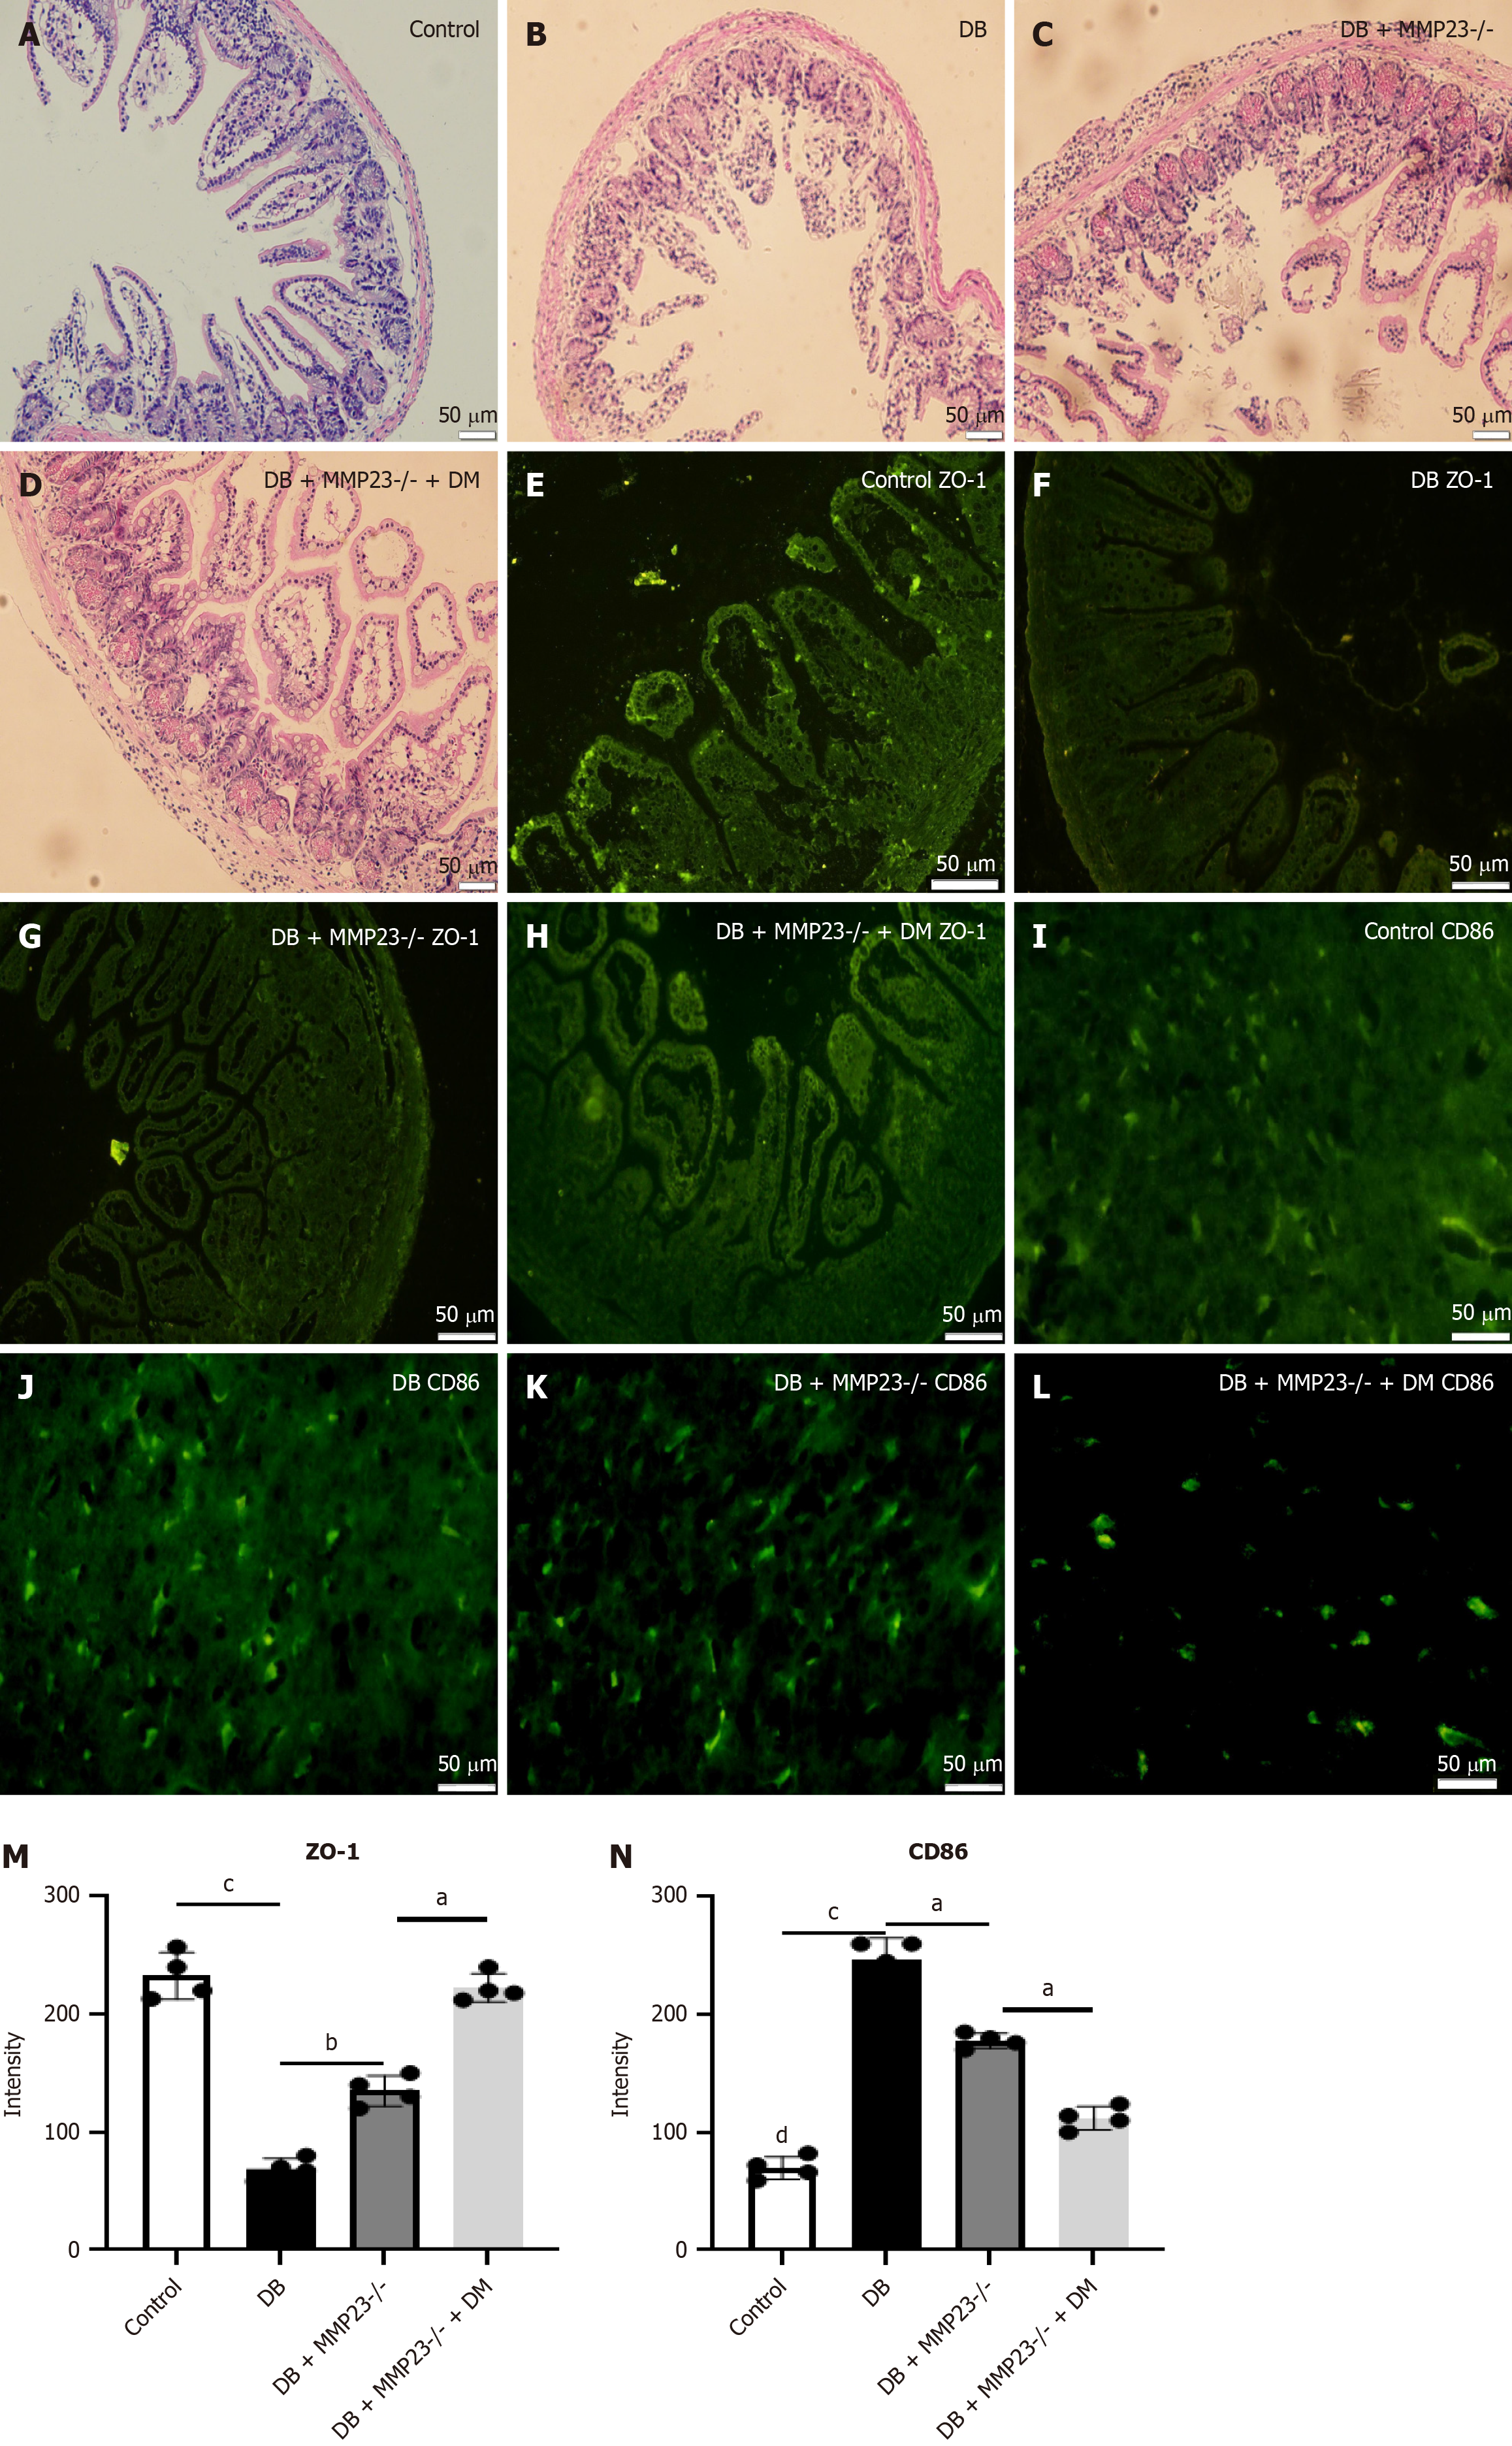
Figure 6 In vivo experiments demonstrated that macrophage clearance can improve intestinal function and epithelium integrity.
We depleted macrophages using clodronate liposomes in mice to elucidate the role of macrophages in intestinal injury. A-D: Hematoxylin and eosin staining revealed less severe injury in mice treated with clodronate liposomes; E-L: Immunofluorescence analysis demonstrated a significant induction in ZO-1 and reduction in CD86 levels 24 hours after clodronate liposome treatment; M and N: Immunofluorescence analysis revealed a significant increase in the protein expression of CD86 and ZO-1 in MMP23 knockout mice. Scale bar = 50 μm. aP < 0.05, bP < 0.01, cP < 0.001, dP < 0.0001. DB: Diabetes group.
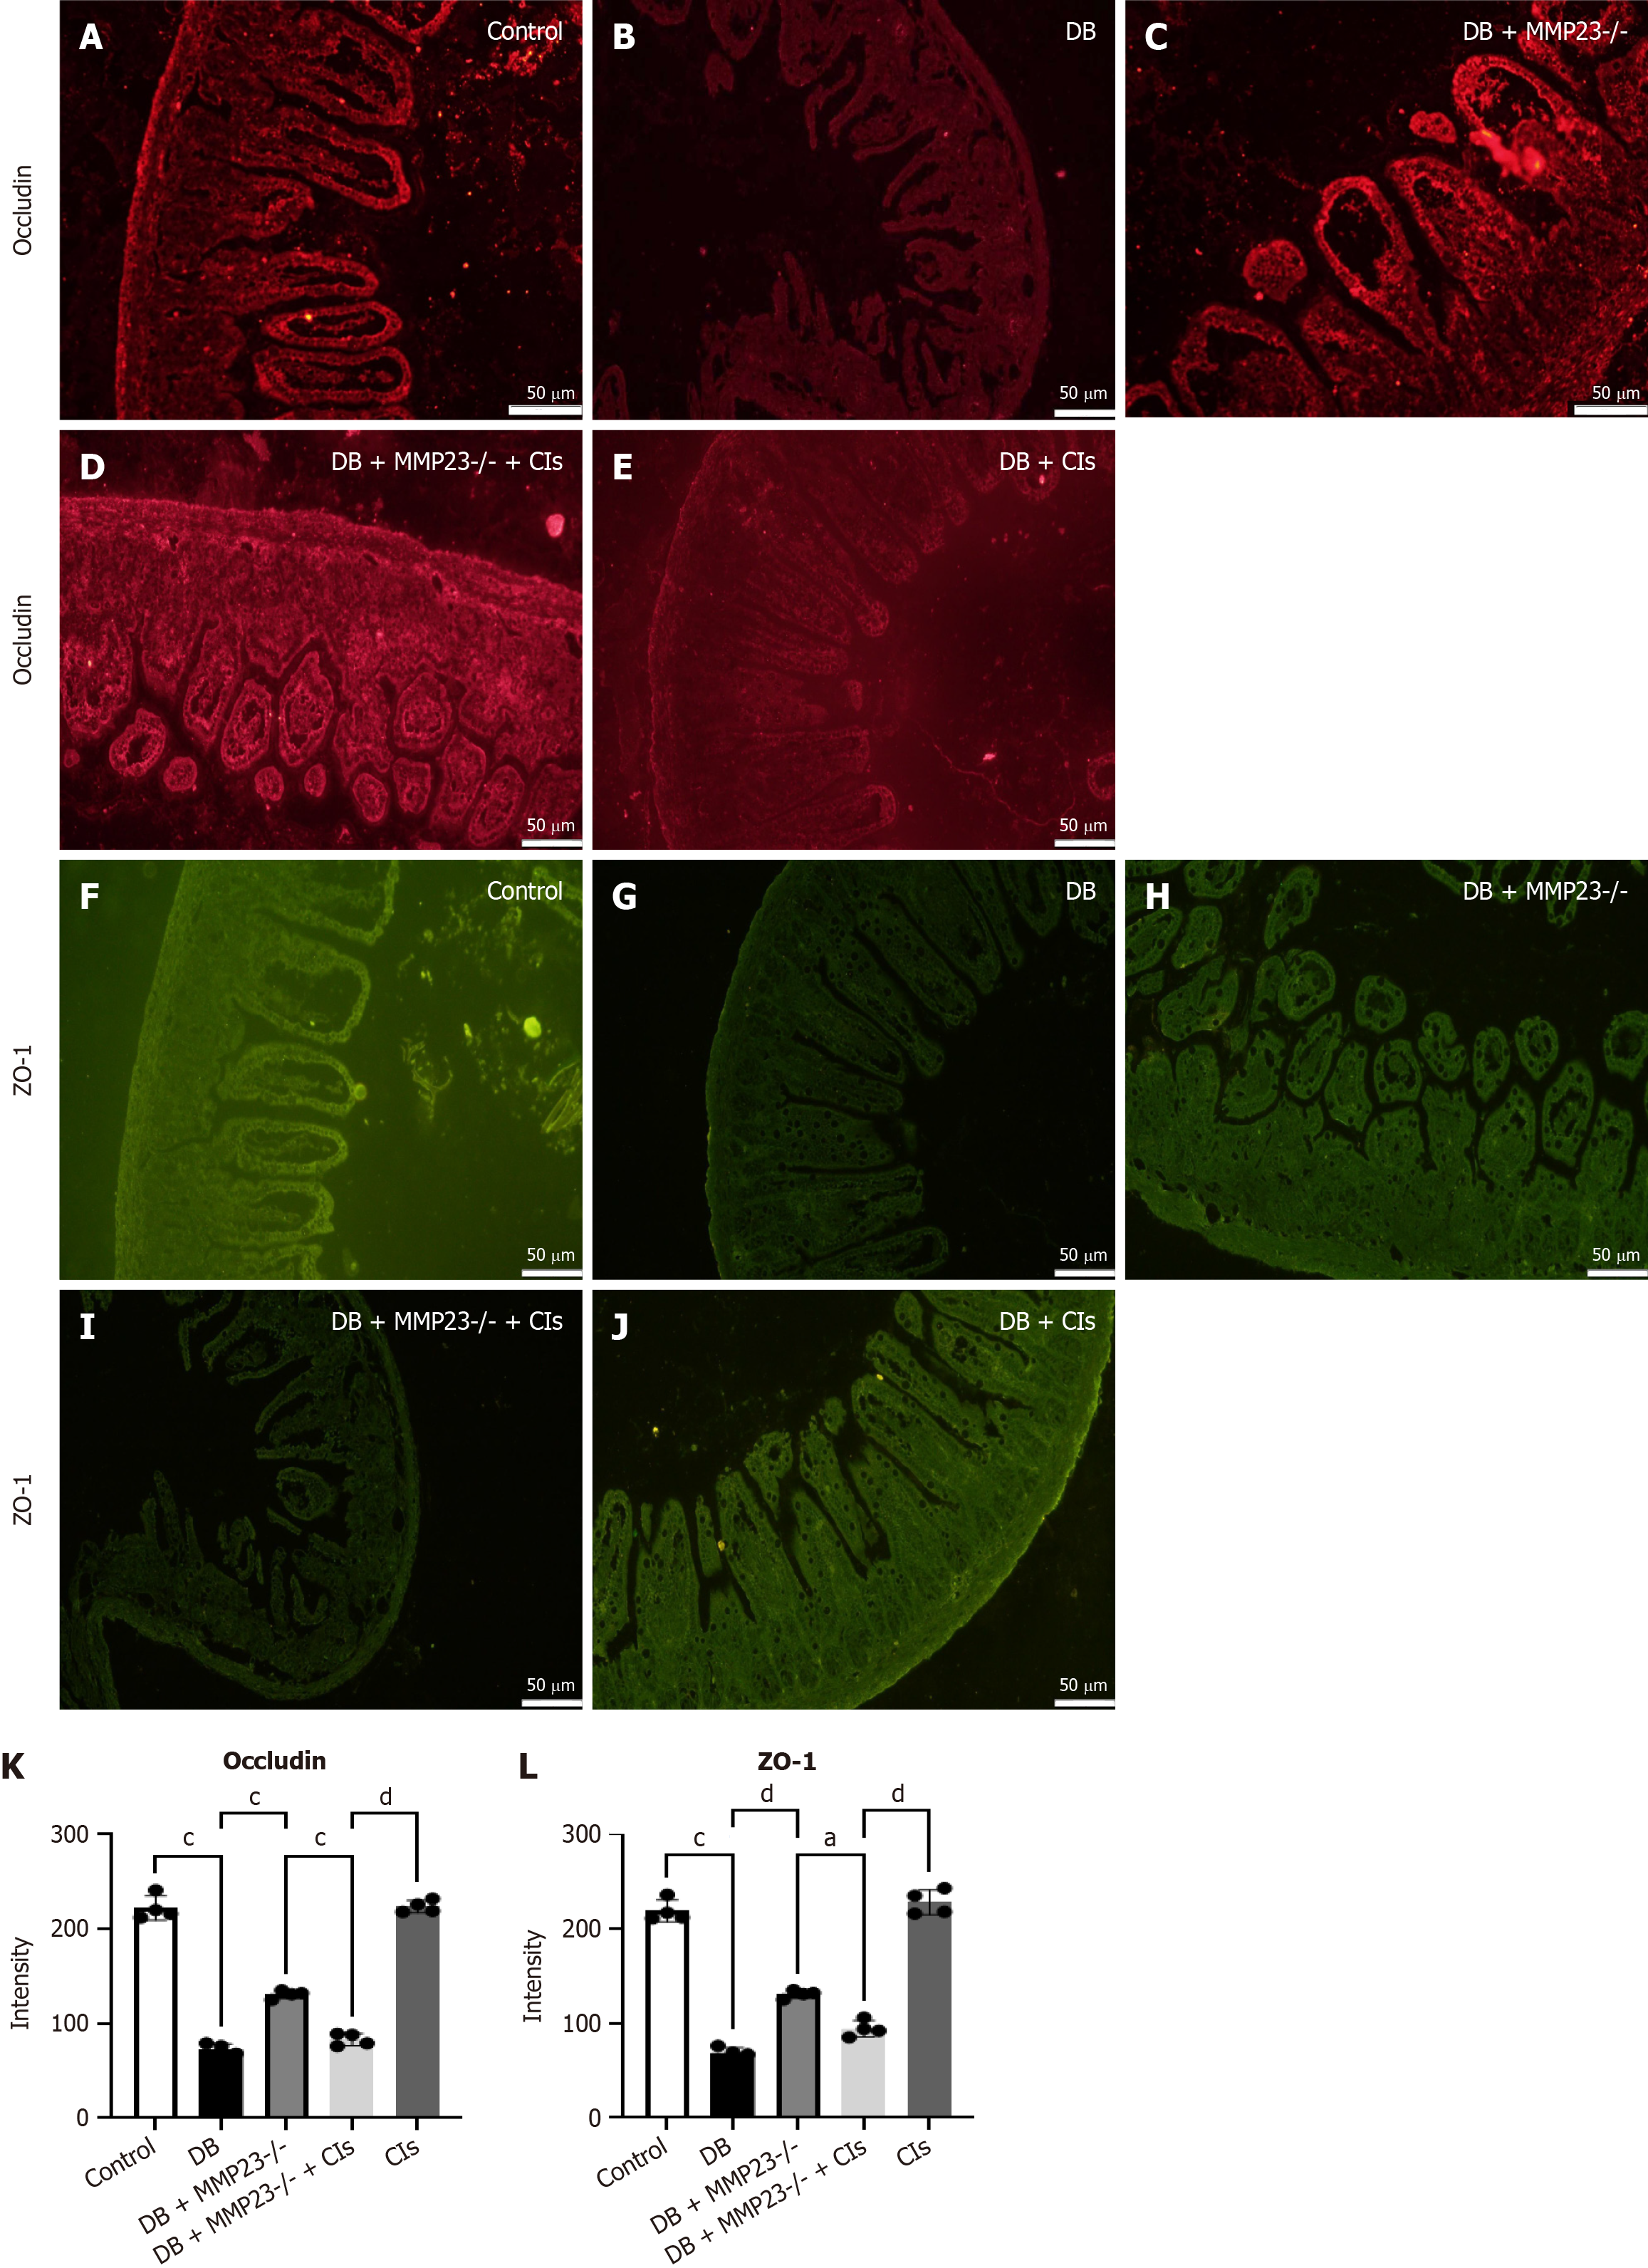
Figure 7 Macrophage clearance enhances intestinal function and improves the epithelium in diabetes mice.
A-J: After 24 hours of treatment with clodronate liposomes, immunofluorescence analysis revealed a substantial decrease in ZO-1 and occludin levels; K and L: The immunofluorescence analysis demonstrated a notable elevation in the protein expression of occludin and ZO-1 following DB. Scale bar = 50 μm. aP < 0.05, cP < 0.001, dP < 0.0001. DB: Diabetes group; Cls: Clodronate liposomes.
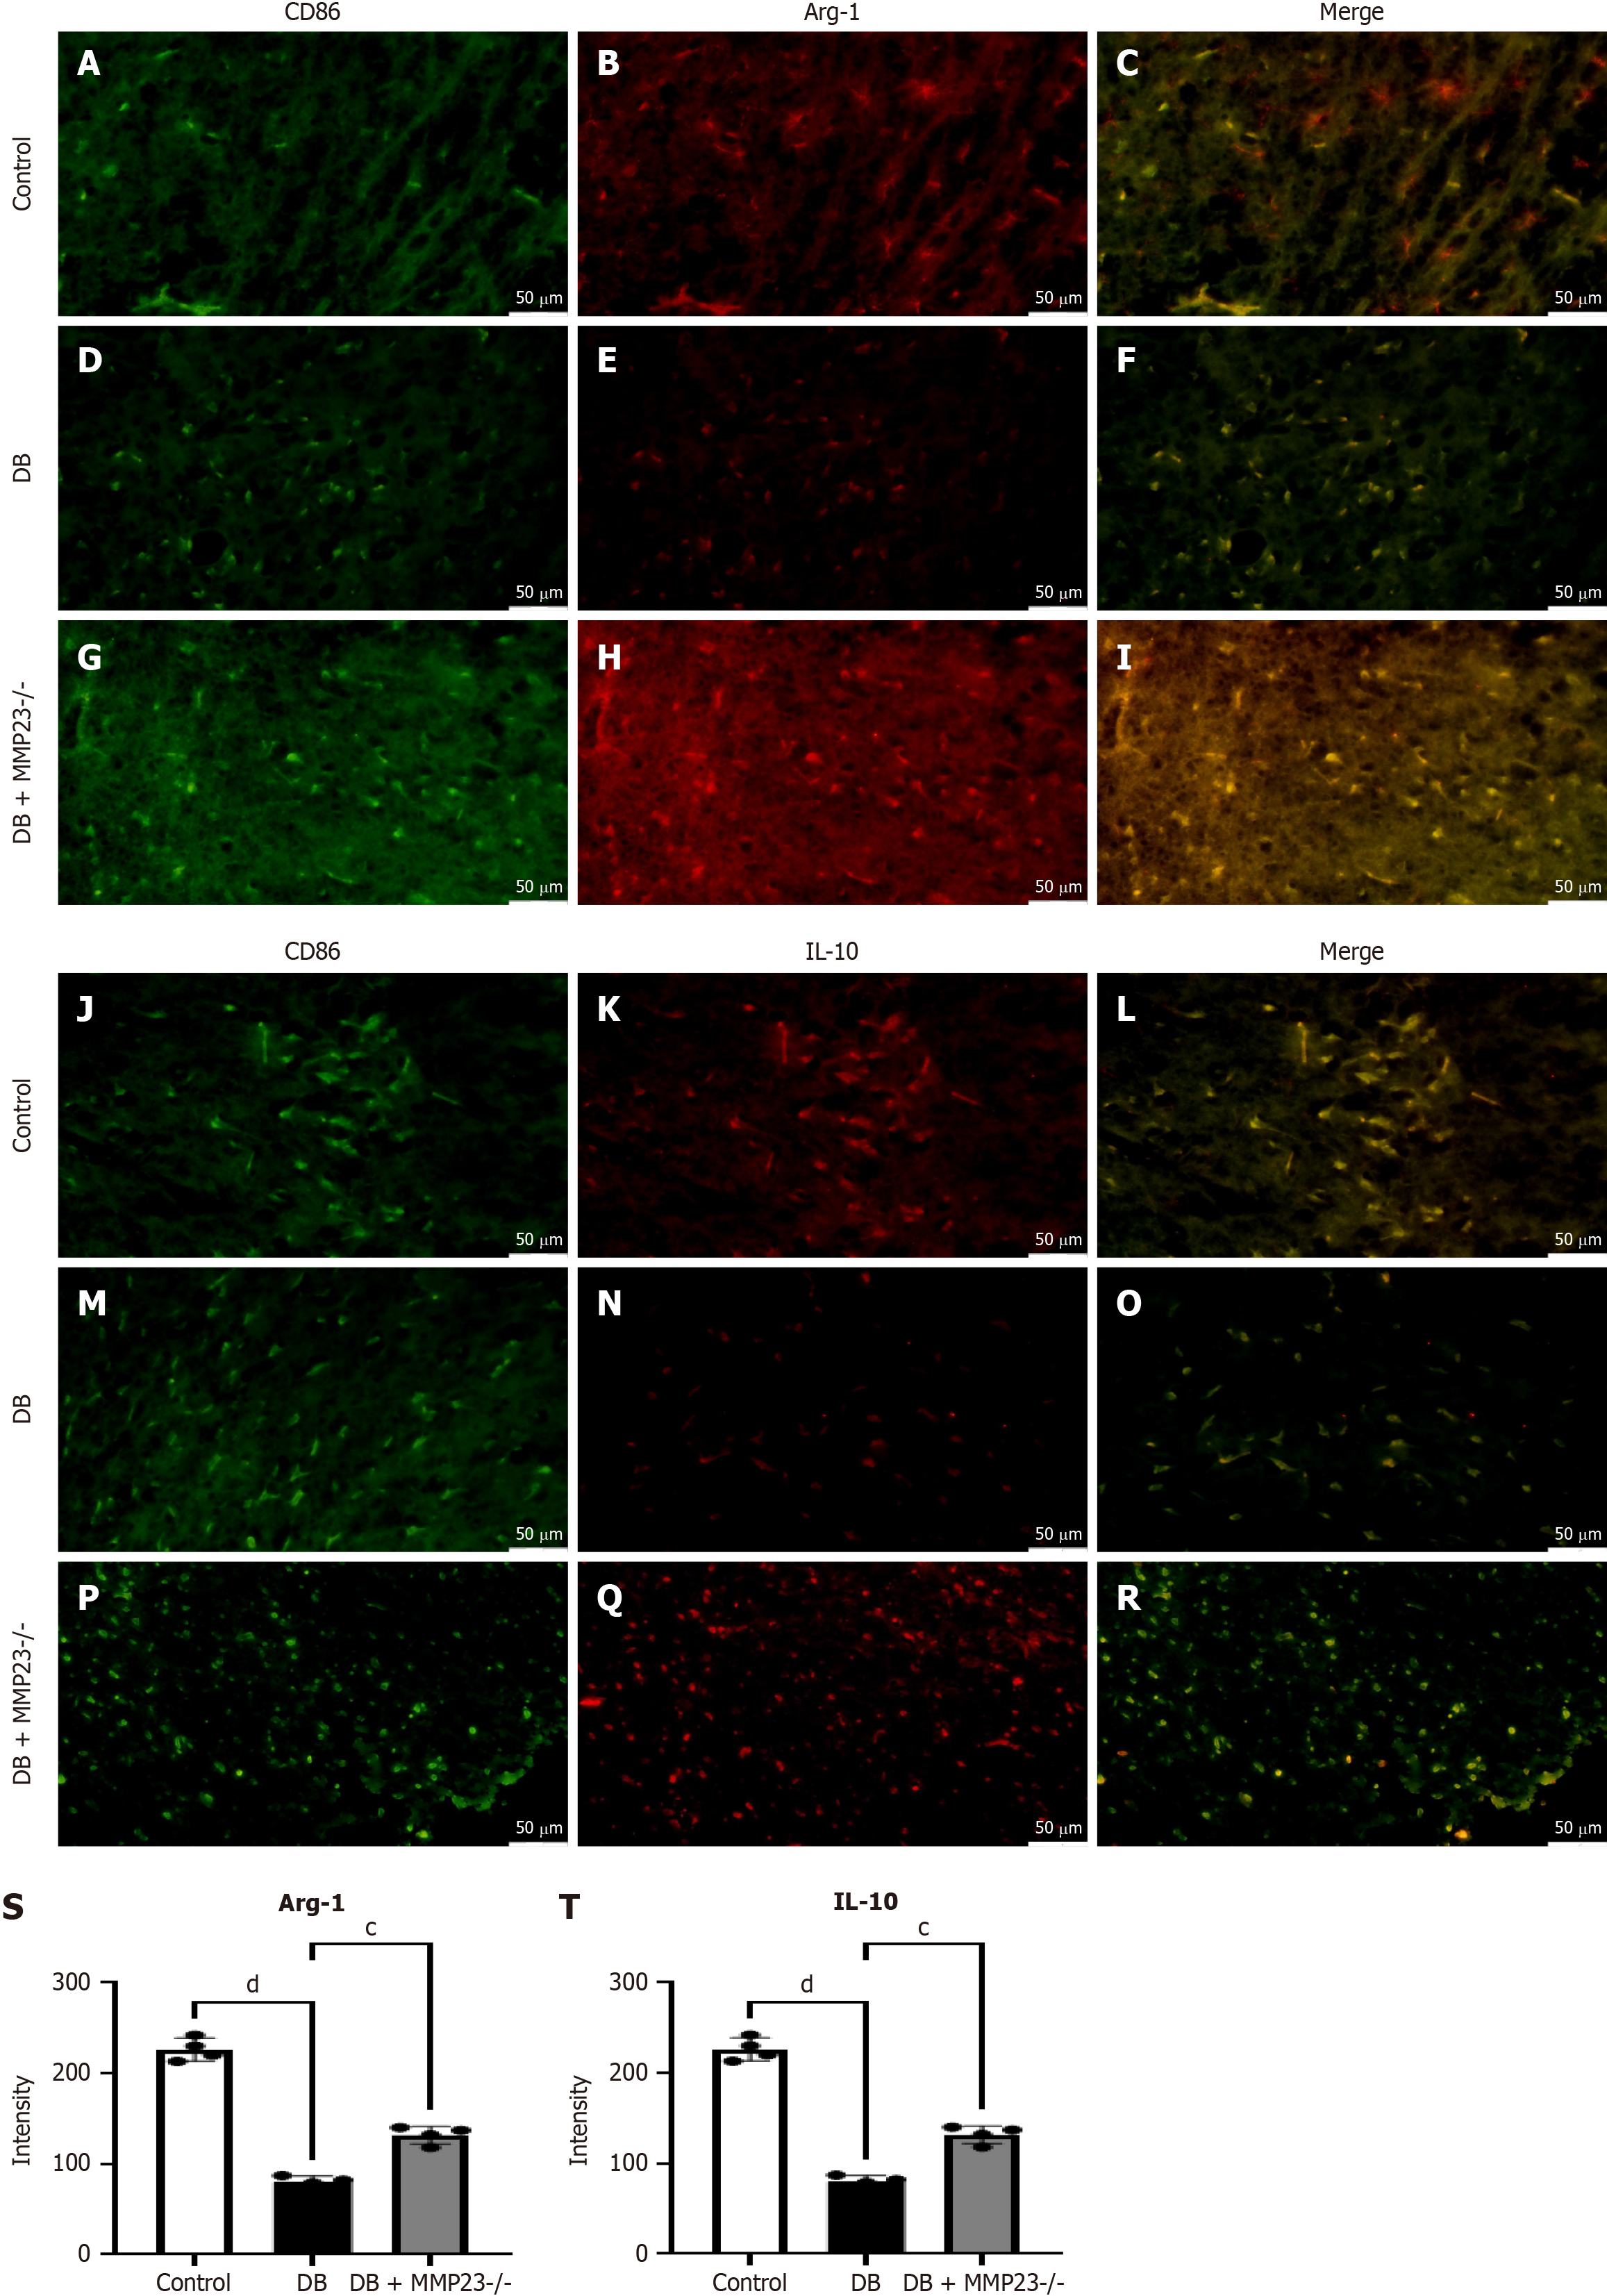
Figure 8 In vivo studies demonstrated that MMP23 knockout upregulates arginase-1 and interleukin-10.
A-R: MMP23 knockout led to M2 polarization. After inducing diabetes with the diabetes treatment, the fluorescence intensity of arginase-1 (A-I) and interleukin-10 (J-R) significantly decreased compared with that before treatment; S and T: Indicating fluorescence intensity levels after MMP23 knockout treatment. Scale bar = 50 μm. cP < 0.001, dP < 0.0001. DB: Diabetes group; Arg-1: Arginase-1; IL-10: Interleukin-10.
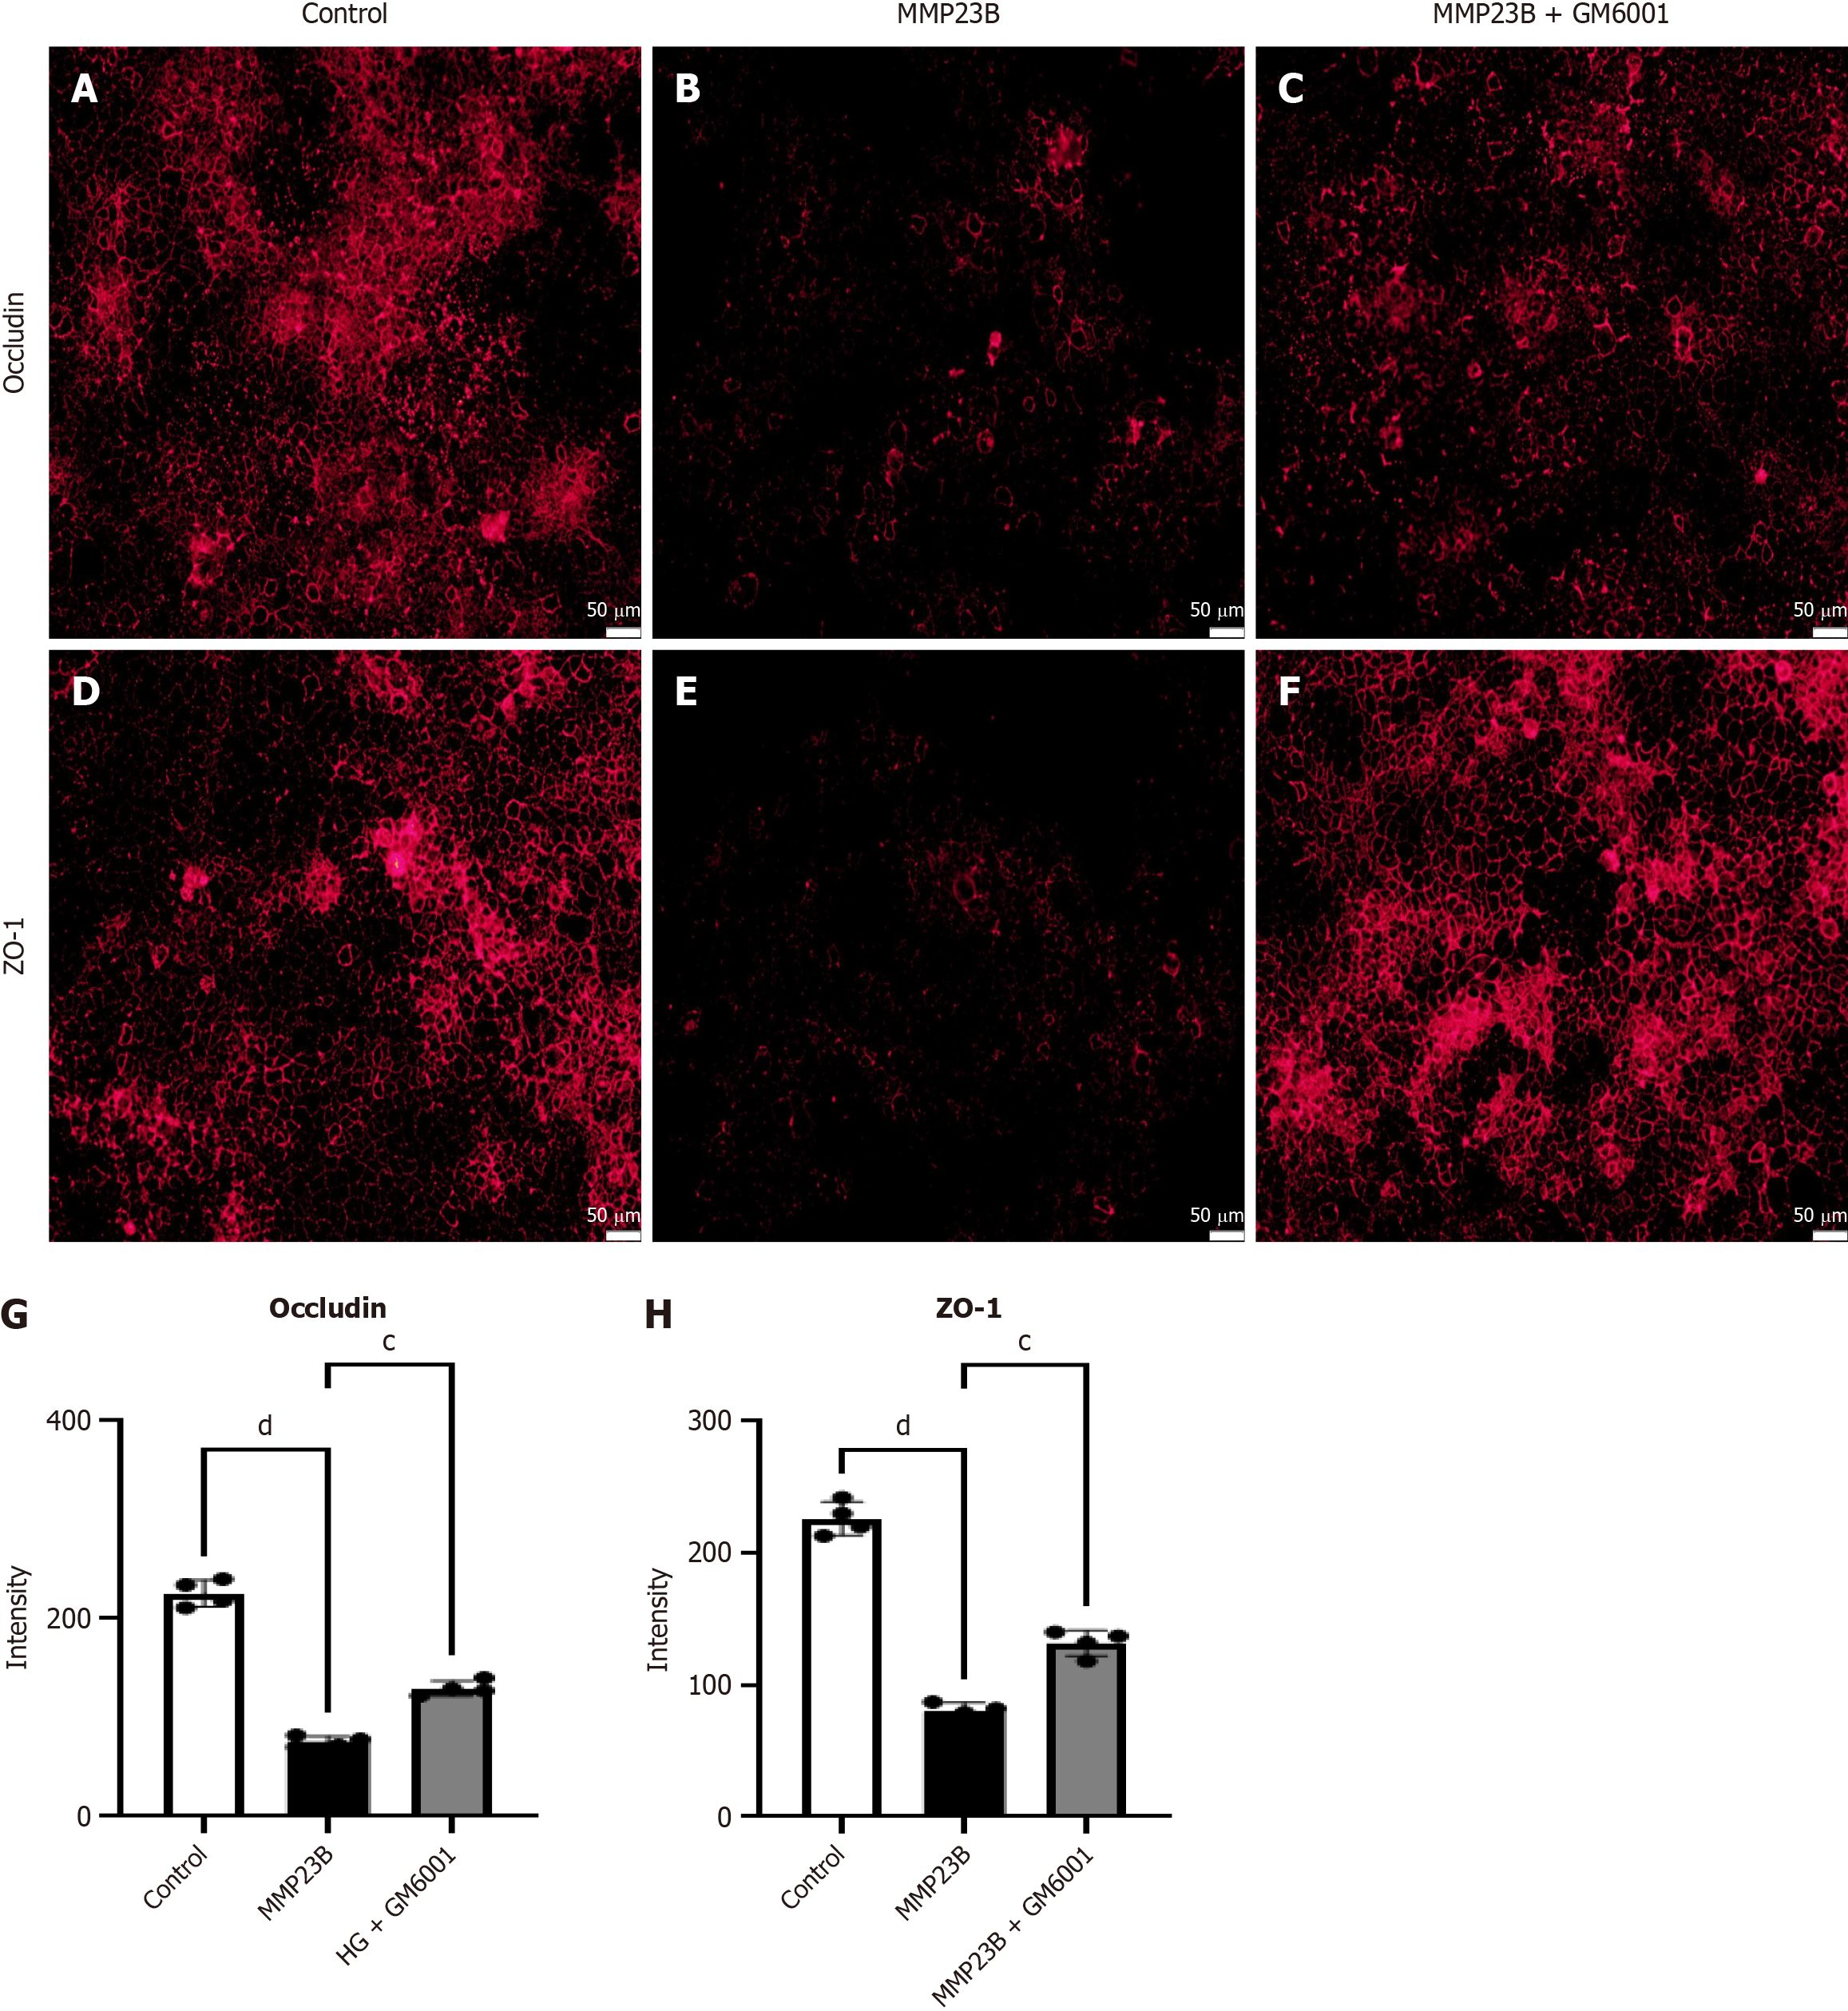
Figure 9 In vitro models demonstrated that GM6001 inhibits intestinal epithelium damage.
A-F: Following lipopolysaccharide treatment, a substantial decrease was observed in the fluorescence intensity levels of occludin (A-C) and ZO-1 (D-F) compared with the baseline levels; G and H: Administering GM6001 to the MMP23B group improved the fluorescence intensity levels of occludin (G) and ZO-1 (H). Scale bar = 50 μm. cP < 0.001, dP < 0.0001. HG: High glucose.
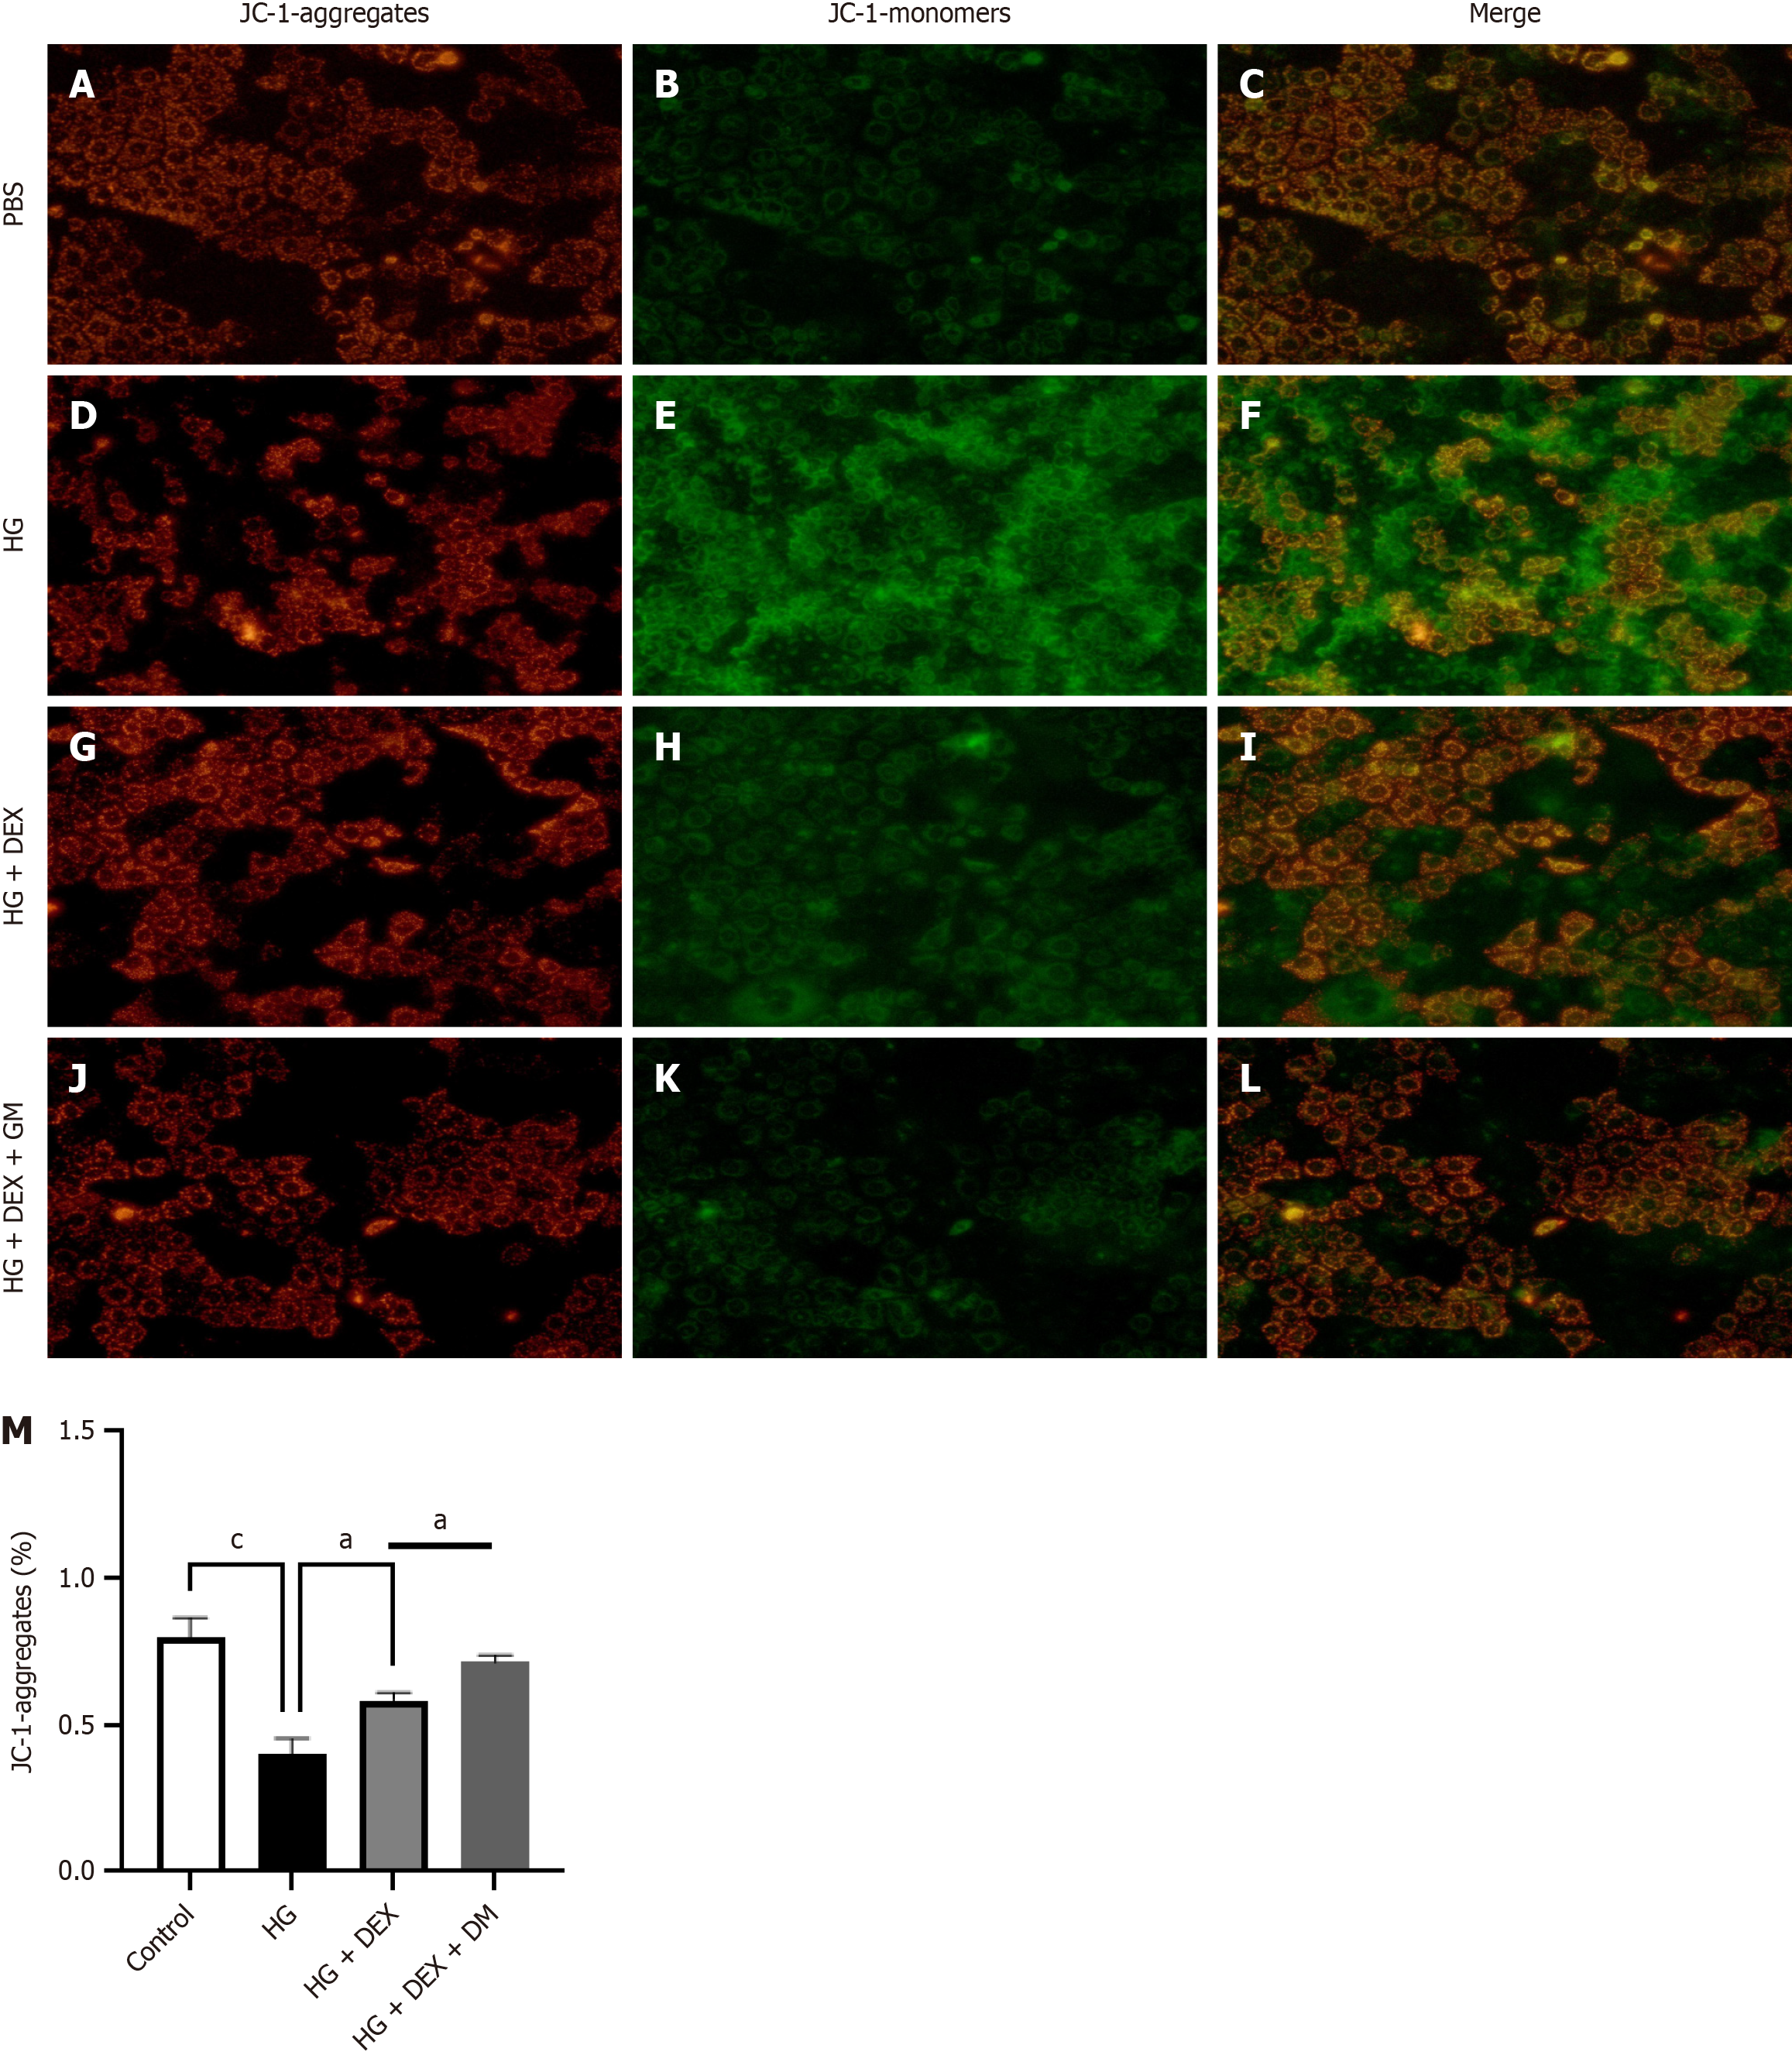
Figure 10 Dexmedetomidine induces mitochondrial impairment in Caco-2 cells in vitro.
A-M: During inflammation, mitochondrial oxidative energy metabolism plays a pivotal role in maintaining the integrity of the gut epithelial barrier. We investigated the potential effects of dexmedetomidine on high glucose-induced mitochondrial dysfunction in Caco-2 cells. Comparative analysis revealed that dexmedetomidine treatment, as opposed to high glucose treatment alone, substantially reduced mitochondrial dysfunction, manifested through reduced levels of JC-1 monomers and enhanced ΔΨm. aP < 0.05, cP < 0.001. HG: High glucose; DEX: Dexmedetomidine; PBS: Phosphate buffer saline; GM: GM6001.
- Citation: Lu M, Guo XW, Zhang FF, Wu DH, Xie D, Luo FQ. Dexmedetomidine ameliorates diabetic intestinal injury by promoting the polarization of M2 macrophages through the MMP23B pathway. World J Diabetes 2024; 15(9): 1962-1978
- URL: https://www.wjgnet.com/1948-9358/full/v15/i9/1962.htm
- DOI: https://dx.doi.org/10.4239/wjd.v15.i9.1962


