Copyright
©The Author(s) 2024.
World J Diabetes. Aug 15, 2024; 15(8): 1802-1810
Published online Aug 15, 2024. doi: 10.4239/wjd.v15.i8.1802
Published online Aug 15, 2024. doi: 10.4239/wjd.v15.i8.1802
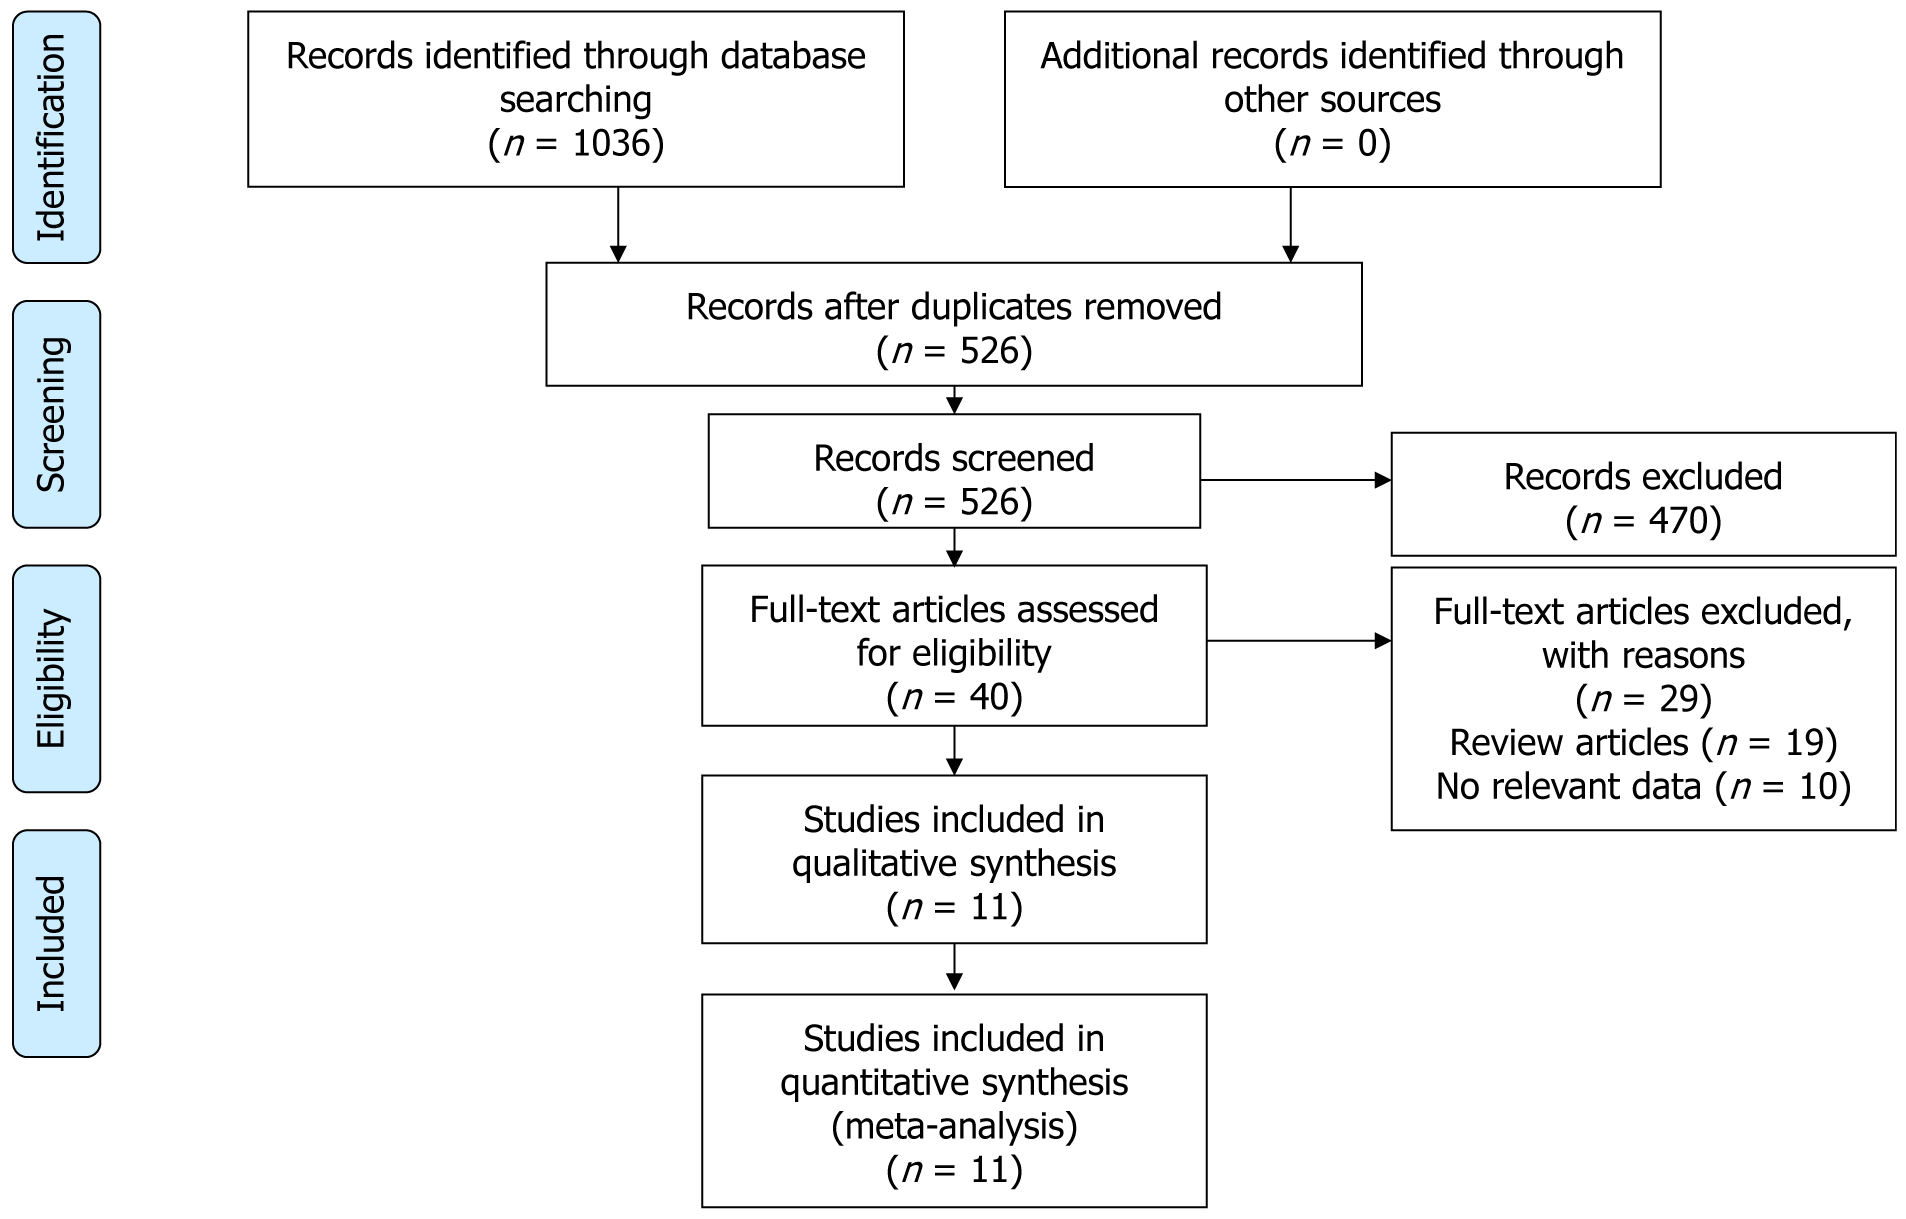
Figure 1 Flow of study selection.
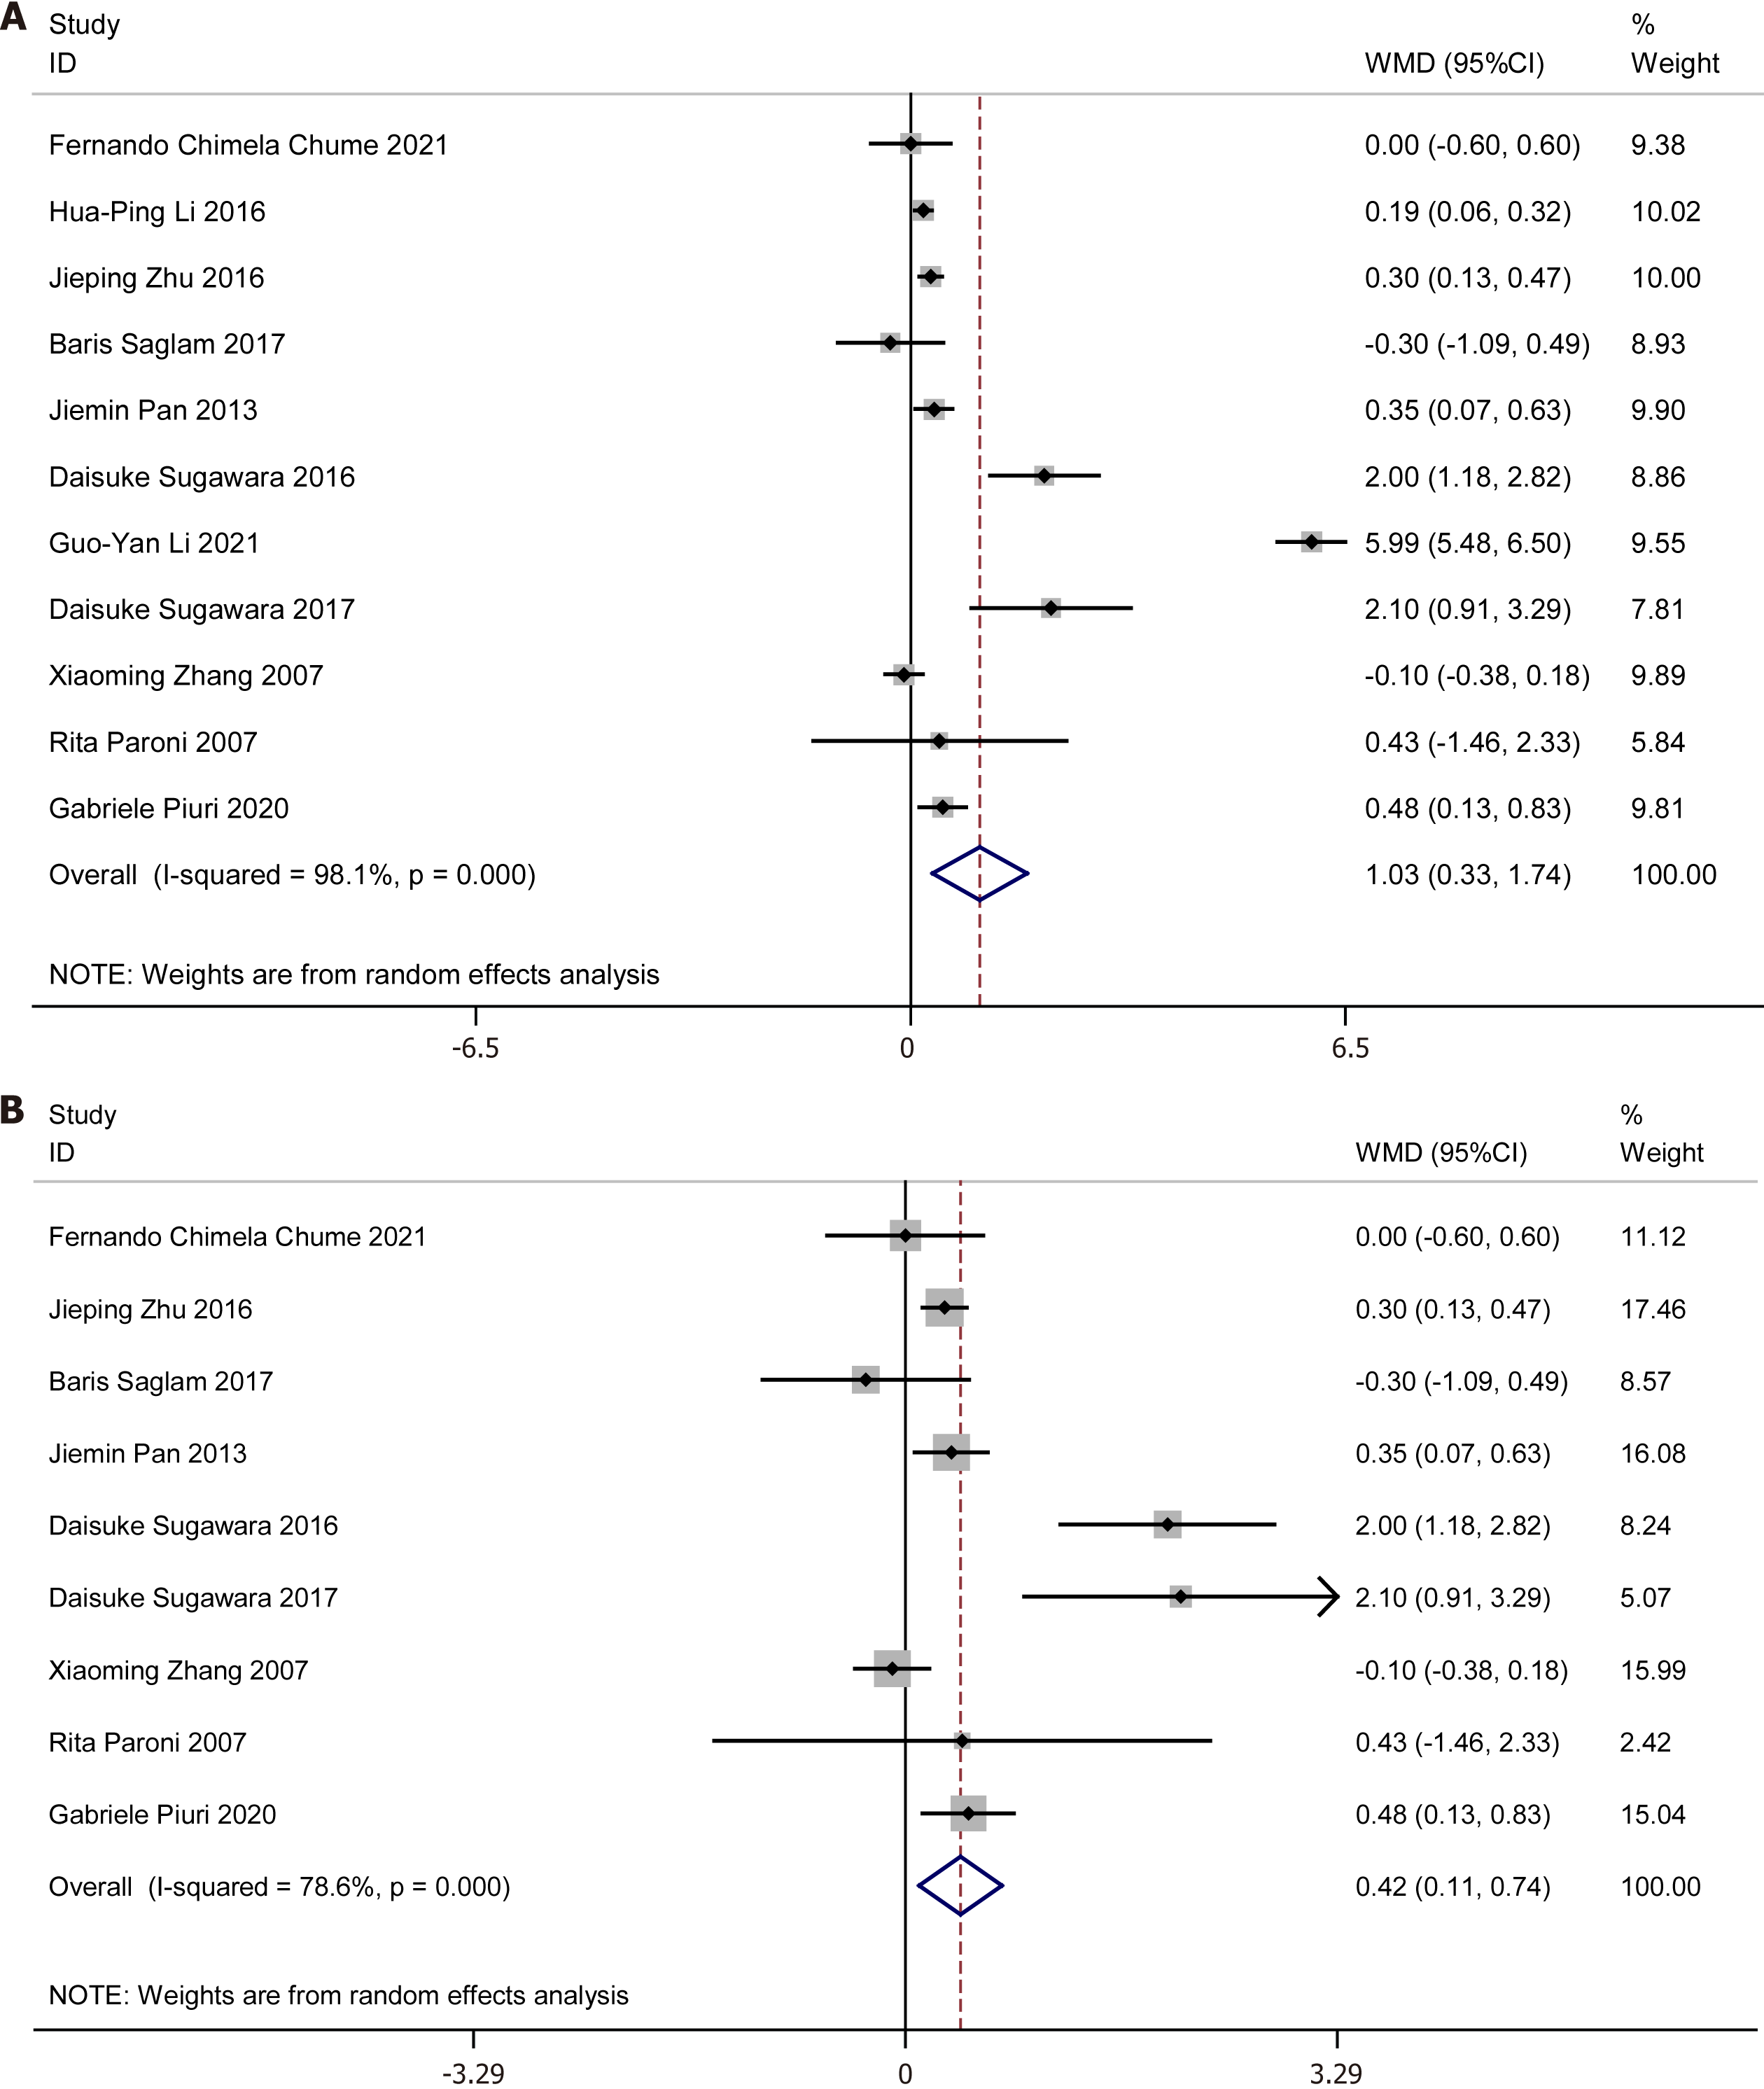
Figure 2 Forest plot evaluating glycated albumin levels in people with gestational diabetes mellitus versus those without gestational diabetes mellitus.
A and B: The pooled results are expressed as weighted mean differences with 95% confidence interval. 95%CI: 95% confidence interval; WMD: Weighted mean differences.
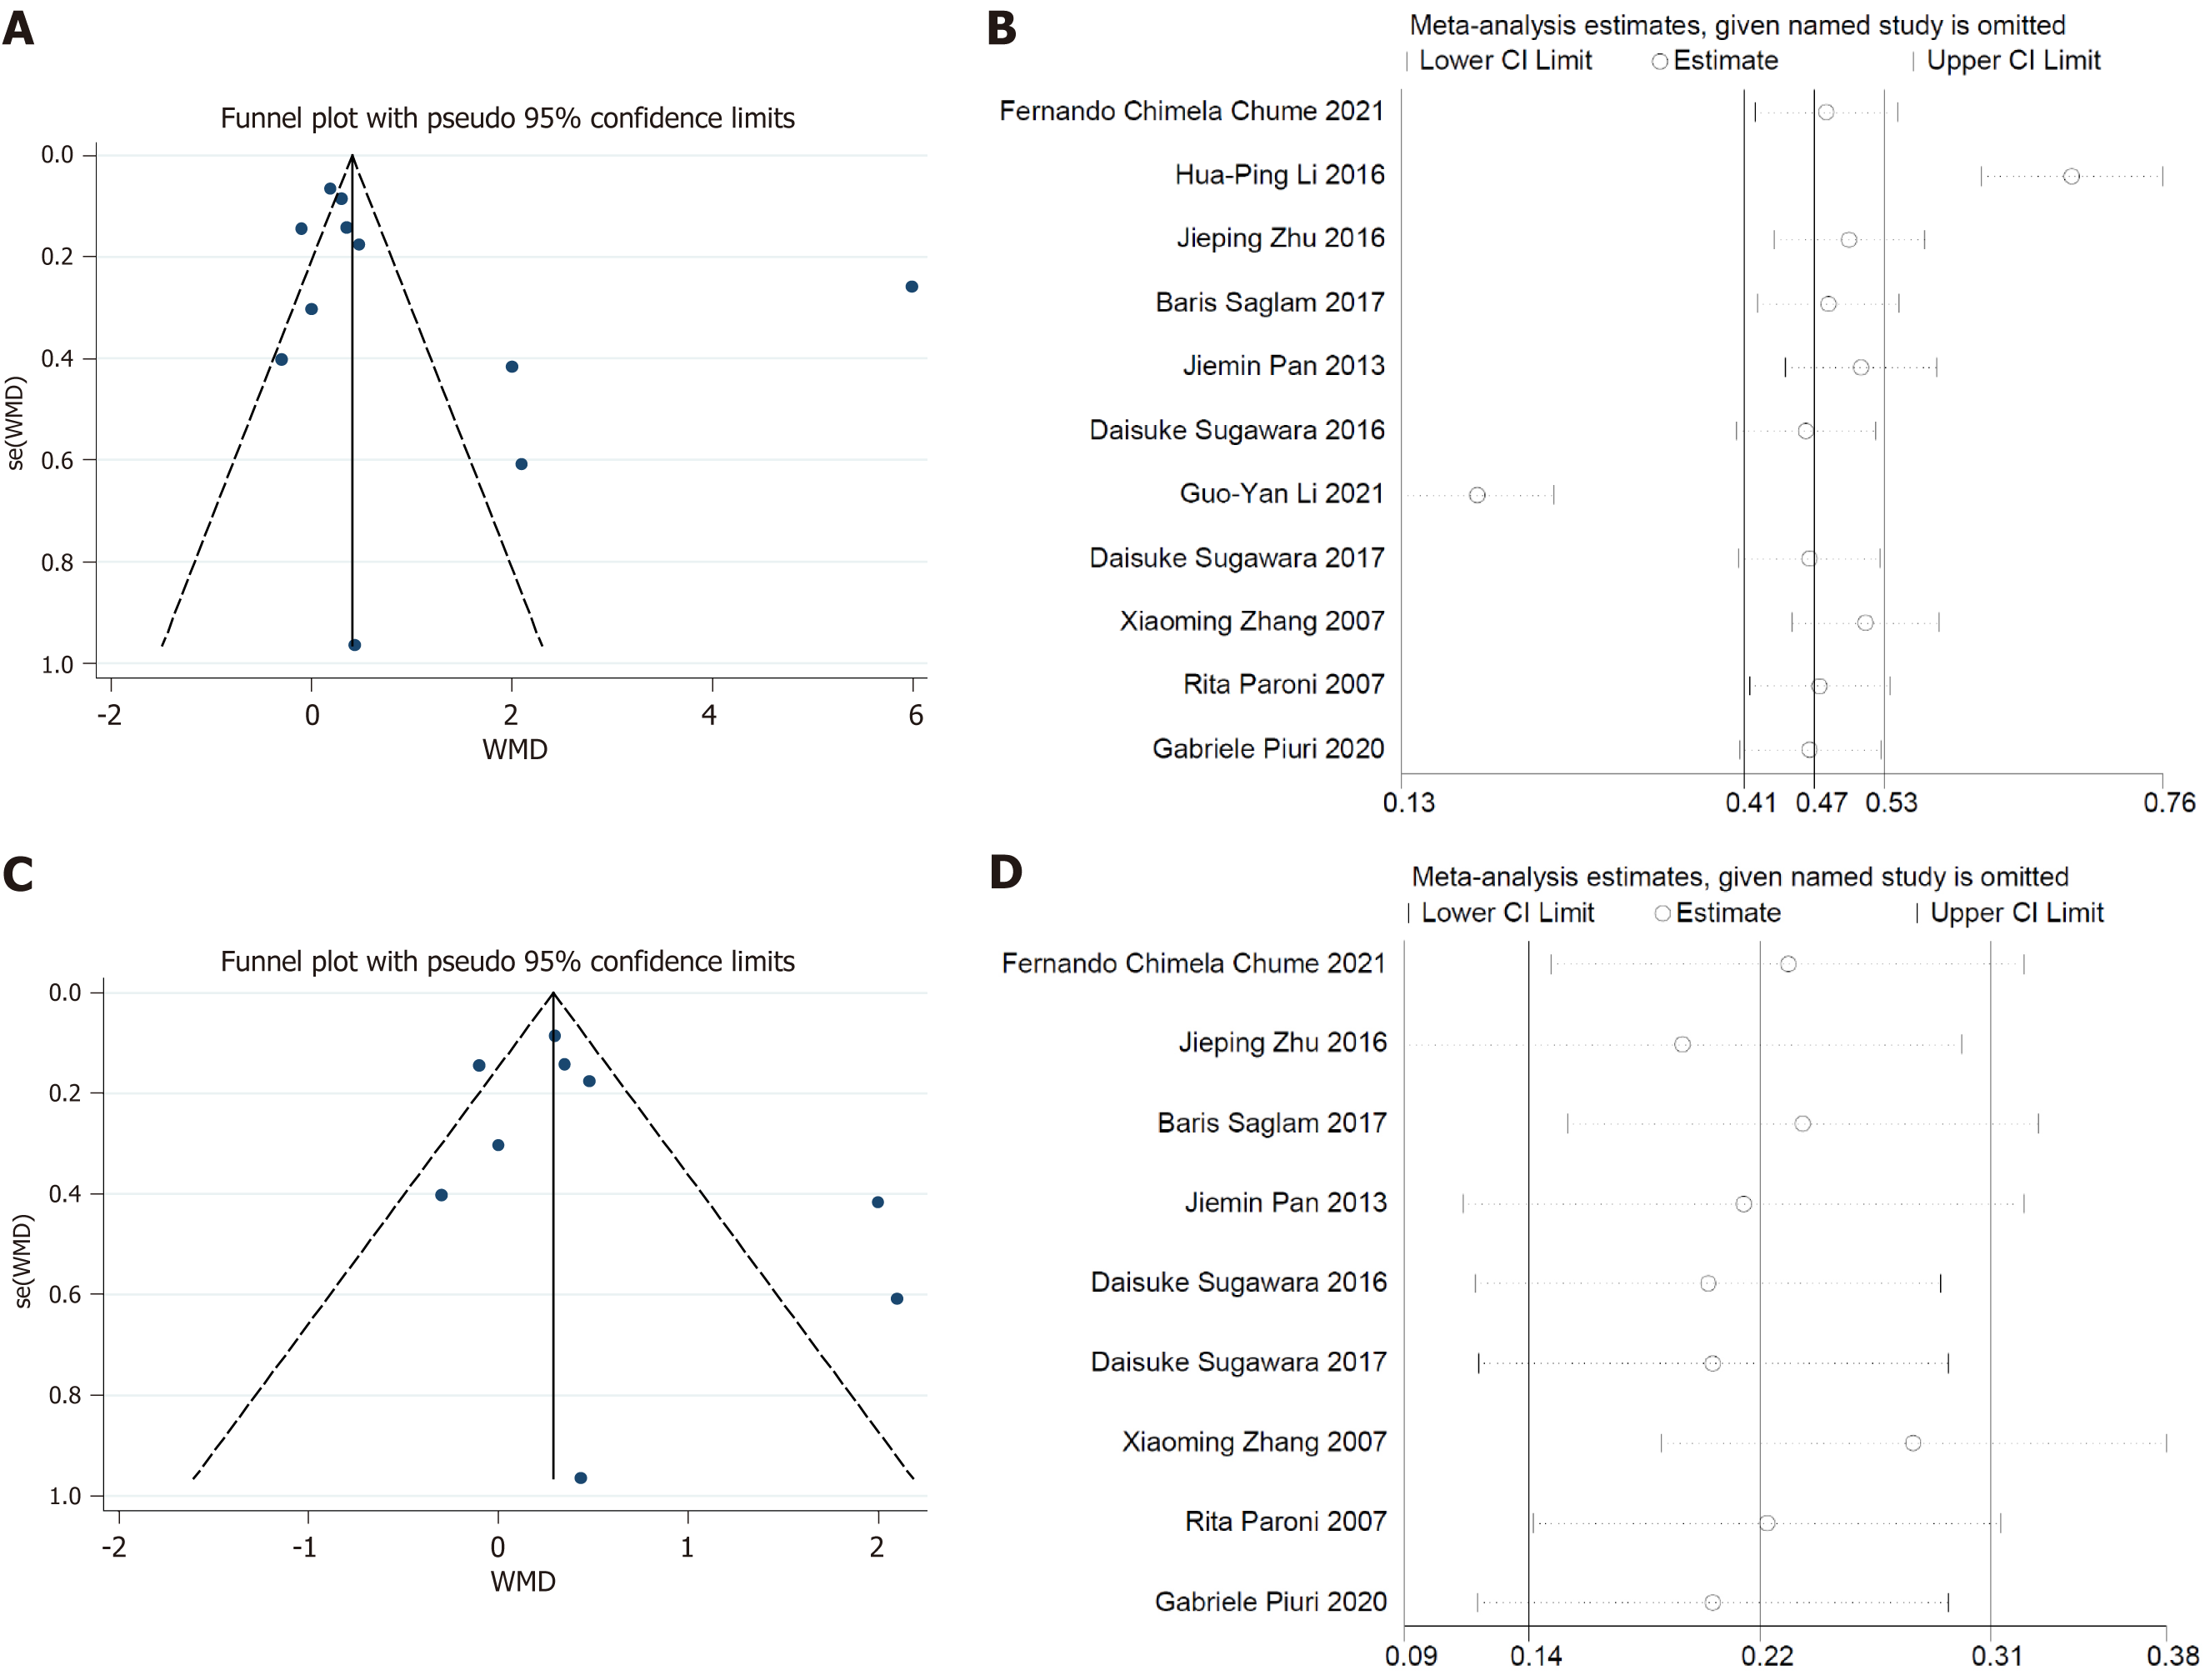
Figure 3 Sensitivity analysis and funnel plots for publication bias.
A: Sensitivity analysis for the effects of glycated albumin levels on gestational diabetes mellitus risk; B: Publication bias analysis based on a funnel plot; C: Sensitivity analysis for the effects of glycated albumin levels on gestational diabetes mellitus risk; D: Publication bias analysis based on a funnel plot. WMD: Weighted mean differences.
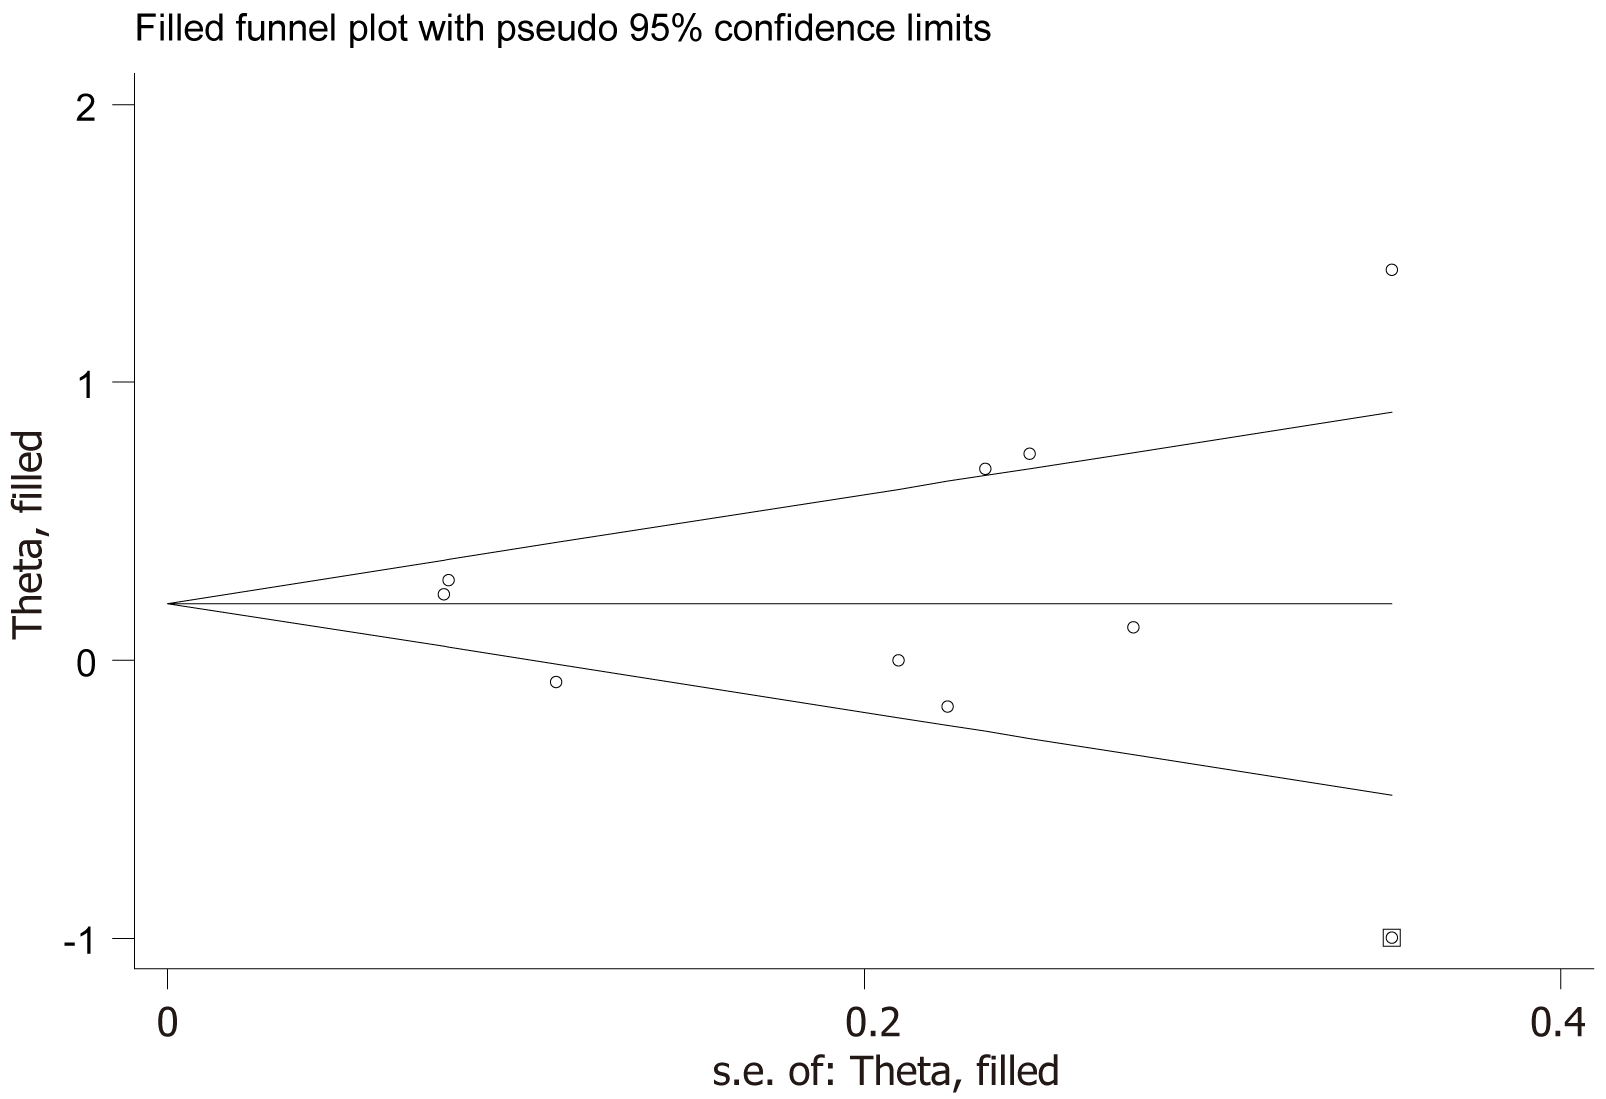
Figure 4 Trim-and-fill analysis of the studies included.
- Citation: Xiong W, Zeng ZH, Xu Y, Li H, Lin H. Circulating glycated albumin levels and gestational diabetes mellitus. World J Diabetes 2024; 15(8): 1802-1810
- URL: https://www.wjgnet.com/1948-9358/full/v15/i8/1802.htm
- DOI: https://dx.doi.org/10.4239/wjd.v15.i8.1802


