Copyright
©The Author(s) 2024.
World J Diabetes. Aug 15, 2024; 15(8): 1764-1777
Published online Aug 15, 2024. doi: 10.4239/wjd.v15.i8.1764
Published online Aug 15, 2024. doi: 10.4239/wjd.v15.i8.1764
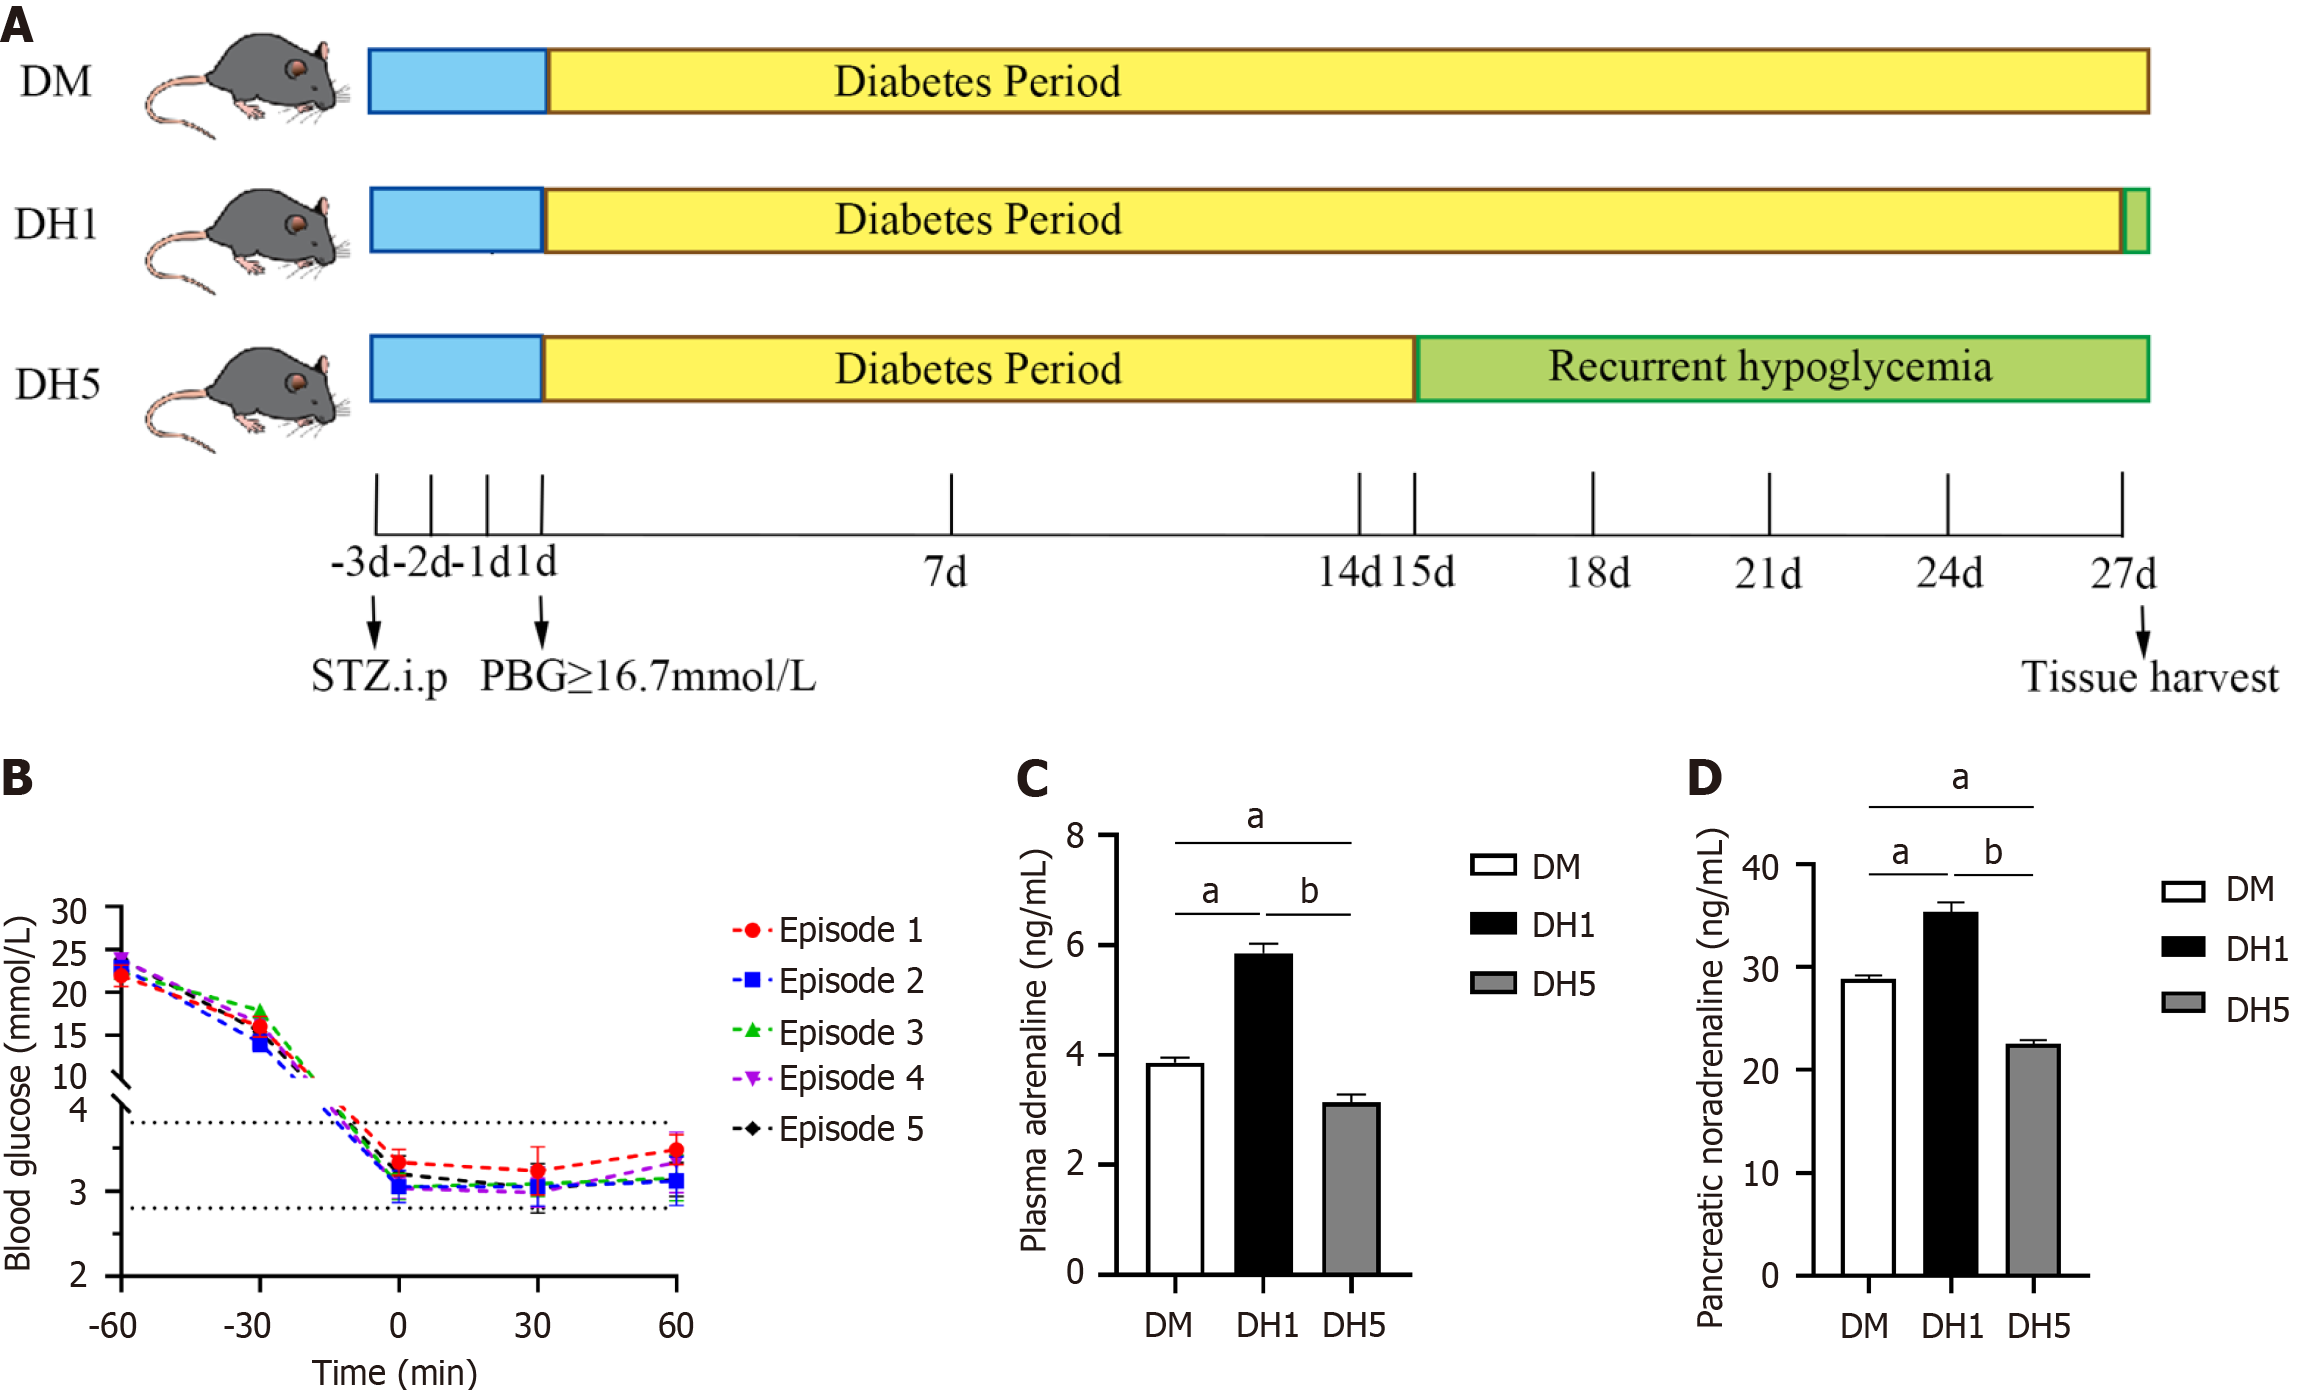
Figure 1 Diabetic mice with five hypoglycaemic episodes exhibit impaired hypoglycaemic counterregulation.
A: Flow chart depicting the modeling process, with some content sourced from Scidraw; B: Fluctuations in blood glucose levels in diabetic mice following repeated insulin interventions; C: Alterations in plasma adrenaline levels; D: Changes in pancreatic noradrenaline levels. All the data are presented as the the mean ± SE. aP < 0.01 vs diabetic mice; bP < 0.01 vs diabetic mice with a single hypoglycaemic episode; PBG: Postprandial blood glucose; DM: Diabetic mice; DH1: Diabetic mice with a single hypoglycemic episode; DH1: Diabetic mice with a single hypoglycaemic episode; DH5: Diabetic mice with five hypoglycaemic episodes.
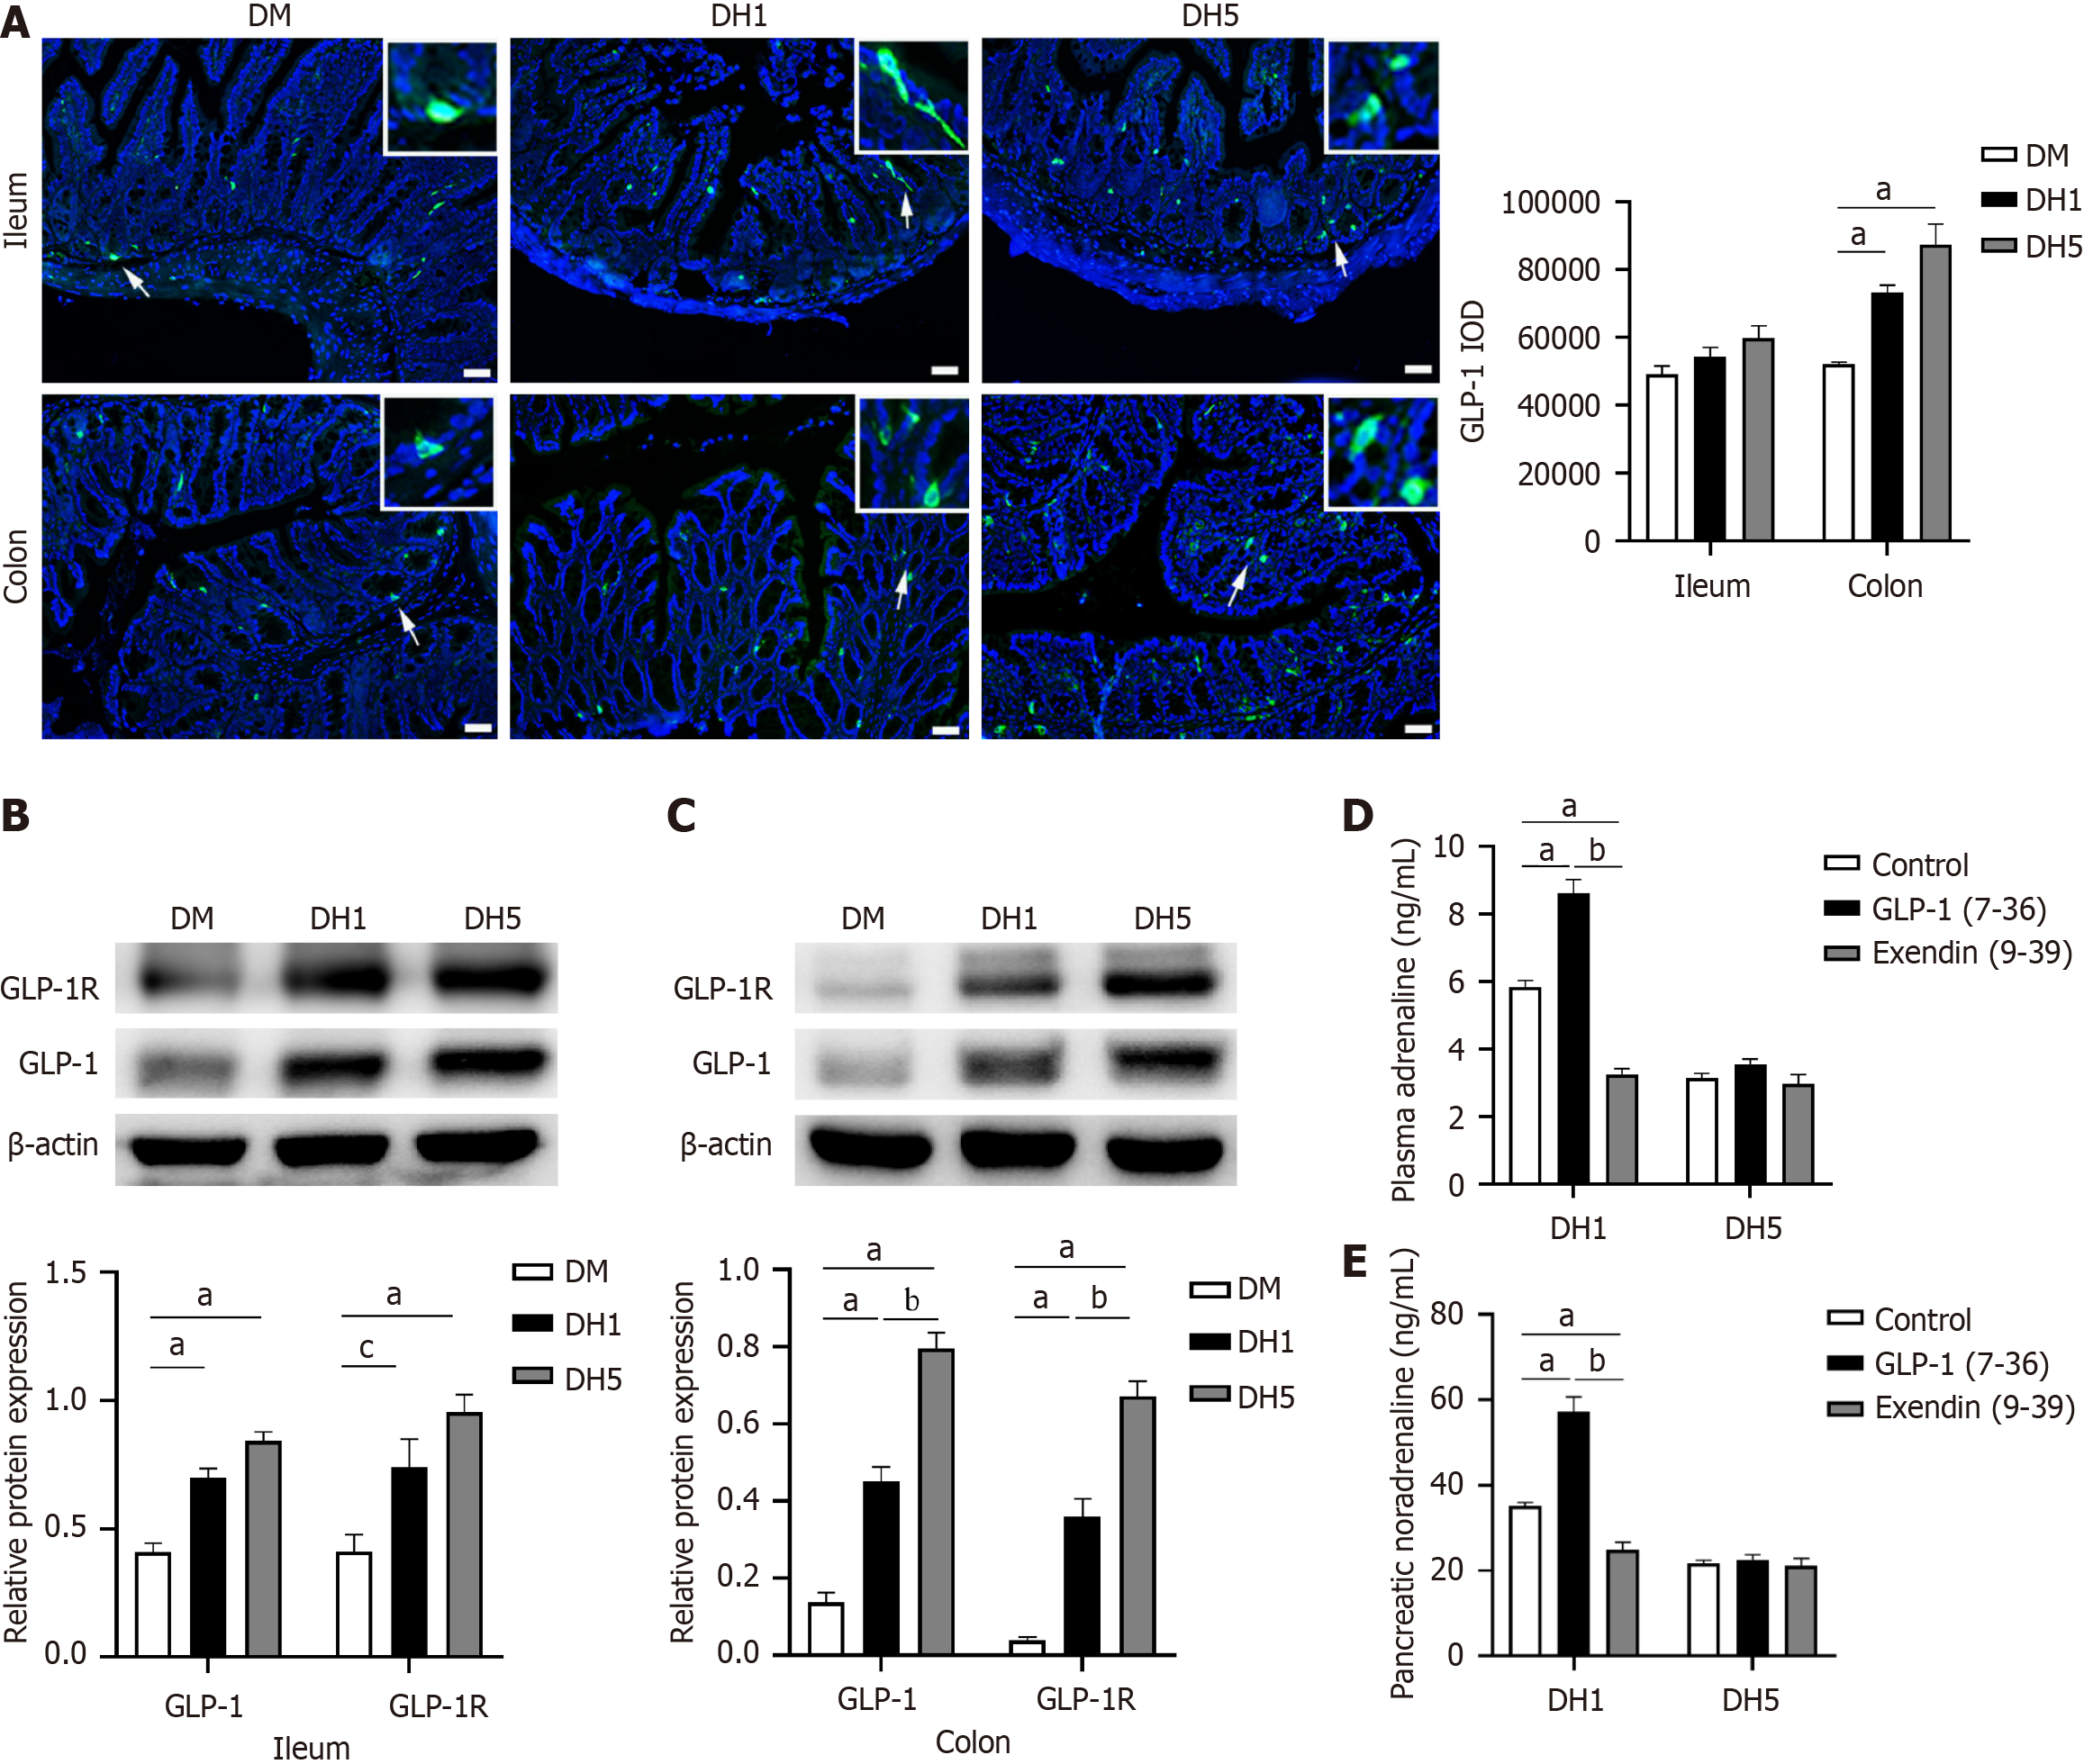
Figure 2 Elevated levels of glucagon-like peptide-1 and glucagon-like peptide-1 receptor in the intestines in response to hypoglycaemia.
A: Immunofluorescence staining showing glucagon-like peptide-1 (GLP-1) expression in the ileum and colon, with GLP-1 in green and cell nuclei in blue. Scale bars = 50 μm; B: Western blot analysis of GLP-1 and its receptor (GLP-1R) protein expression in the ileum; C: Western blot analysis of GLP-1 and GLP-1R protein expression in the colon; D: Enzyme-linked immunosorbent assay (ELISA) results showing changes in plasma adrenaline levels after terminal ileal infusions in diabetic mice with a single hypoglycemic episode (DH1) and diabetic mice with five hypoglycaemic episodes (DH5); E: ELISA results showing changes in pancreatic noradrenaline levels after terminal ileal infusions in the DH1 and DH5 groups. The data are presented as the mean ± SE. aP < 0.01 vs diabetic mice (DM); bP < 0.01 vs DH1 group; cP < 0.05 vs DM group; DM: Diabetic mice; DH1: Diabetic mice with a single hypoglycemic episode; DH5: Diabetic mice with five hypoglycaemic episodes; GLP-1: Glucagon-like peptide-1; GLP-1R: Glucagon-like peptide-1 receptor; IOD: Integrated optical density.
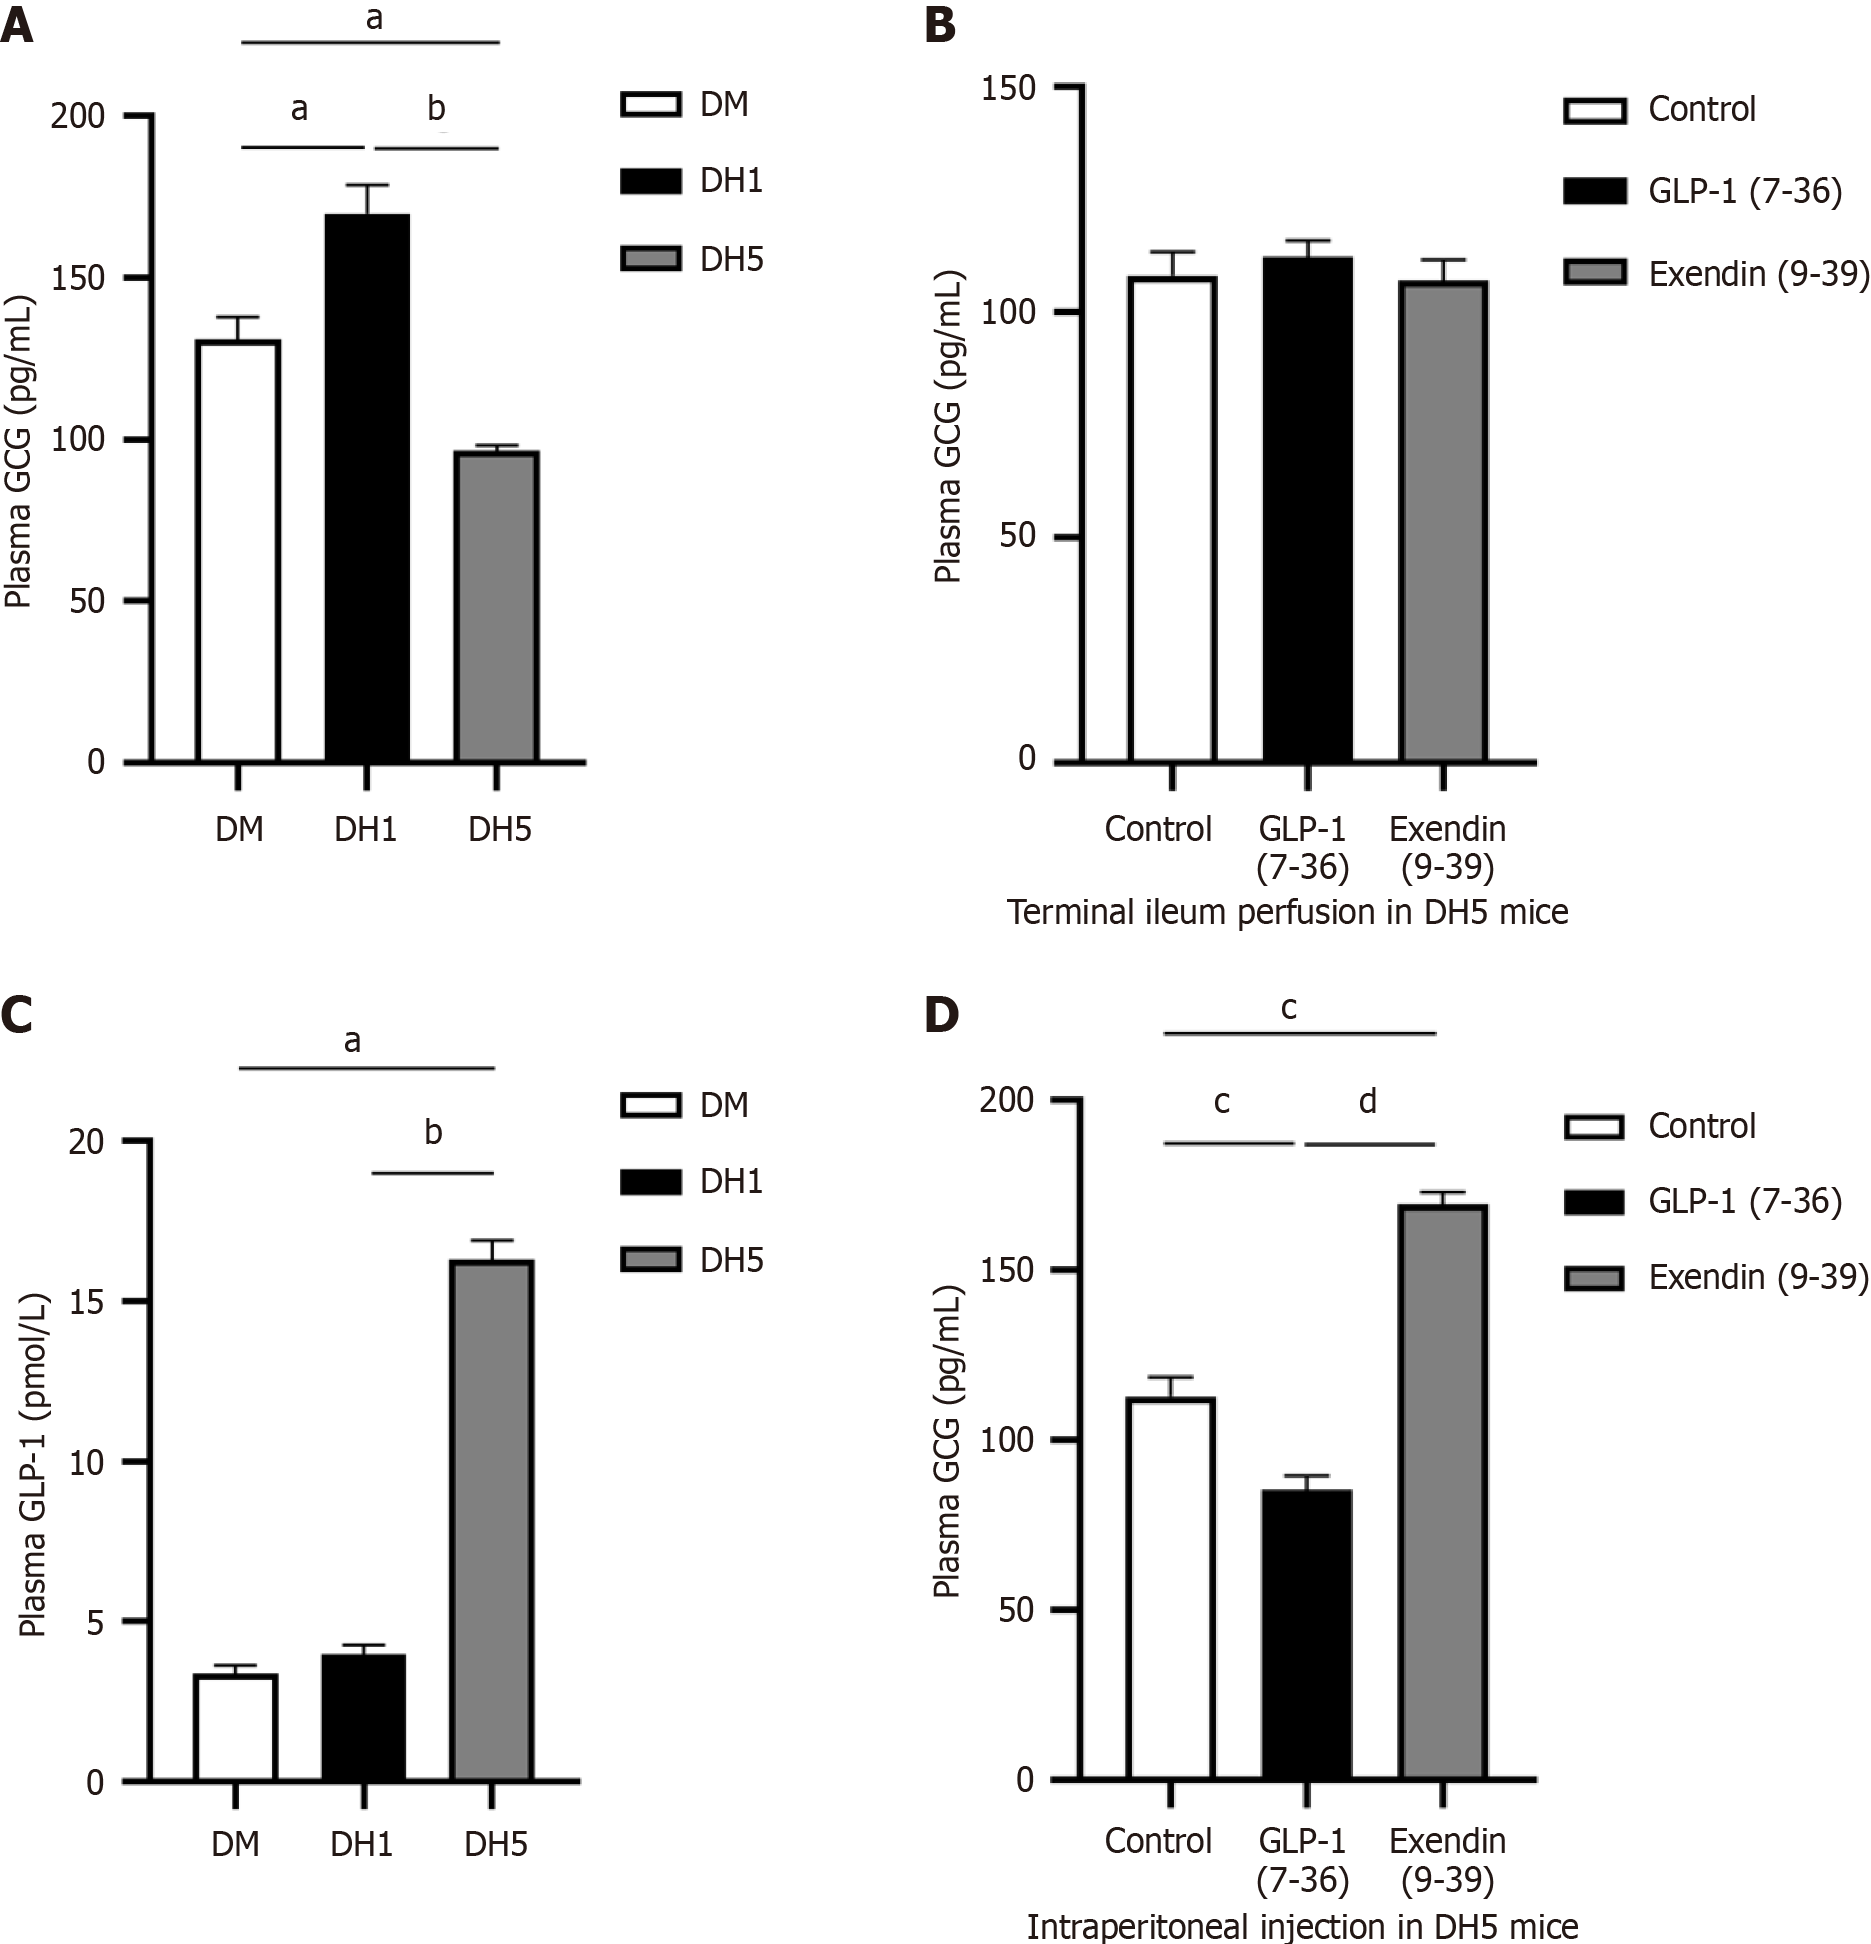
Figure 3 Intestinal glucagon-like peptide-1 regulates plasma glucagon levels through endocrine pathways.
A: Changes in plasma glucagon (GCG) levels measured by enzyme-linked immunosorbent assay (ELISA); B: Alterations in plasma GCG levels measured by ELISA after terminal ileal infusion in diabetic mice with five hypoglycaemic episodes (DH5); C: Changes in plasma GCG-like peptide-1 (GLP-1) levels measured by ELISA; D: Alterations in plasma GCG levels measured by ELISA after intraperitoneal injection in the DH5 group. All the data are presented as the mean ± SE. aP < 0.01 vs diabetic mice; bP < 0.01 vs diabetic mice with a single hypoglycemic episode; cP < 0.01 vs control group; dP < 0.01 vs group receiving intraperitoneal GLP-1(7-36) injections; DM: Diabetic mice; DH1: Diabetic mice with a single hypoglycemic episode; DH5: Diabetic mice with five hypoglycaemic episodes; GLP-1: Glucagon-like peptide-1; GCG: Glucagon.
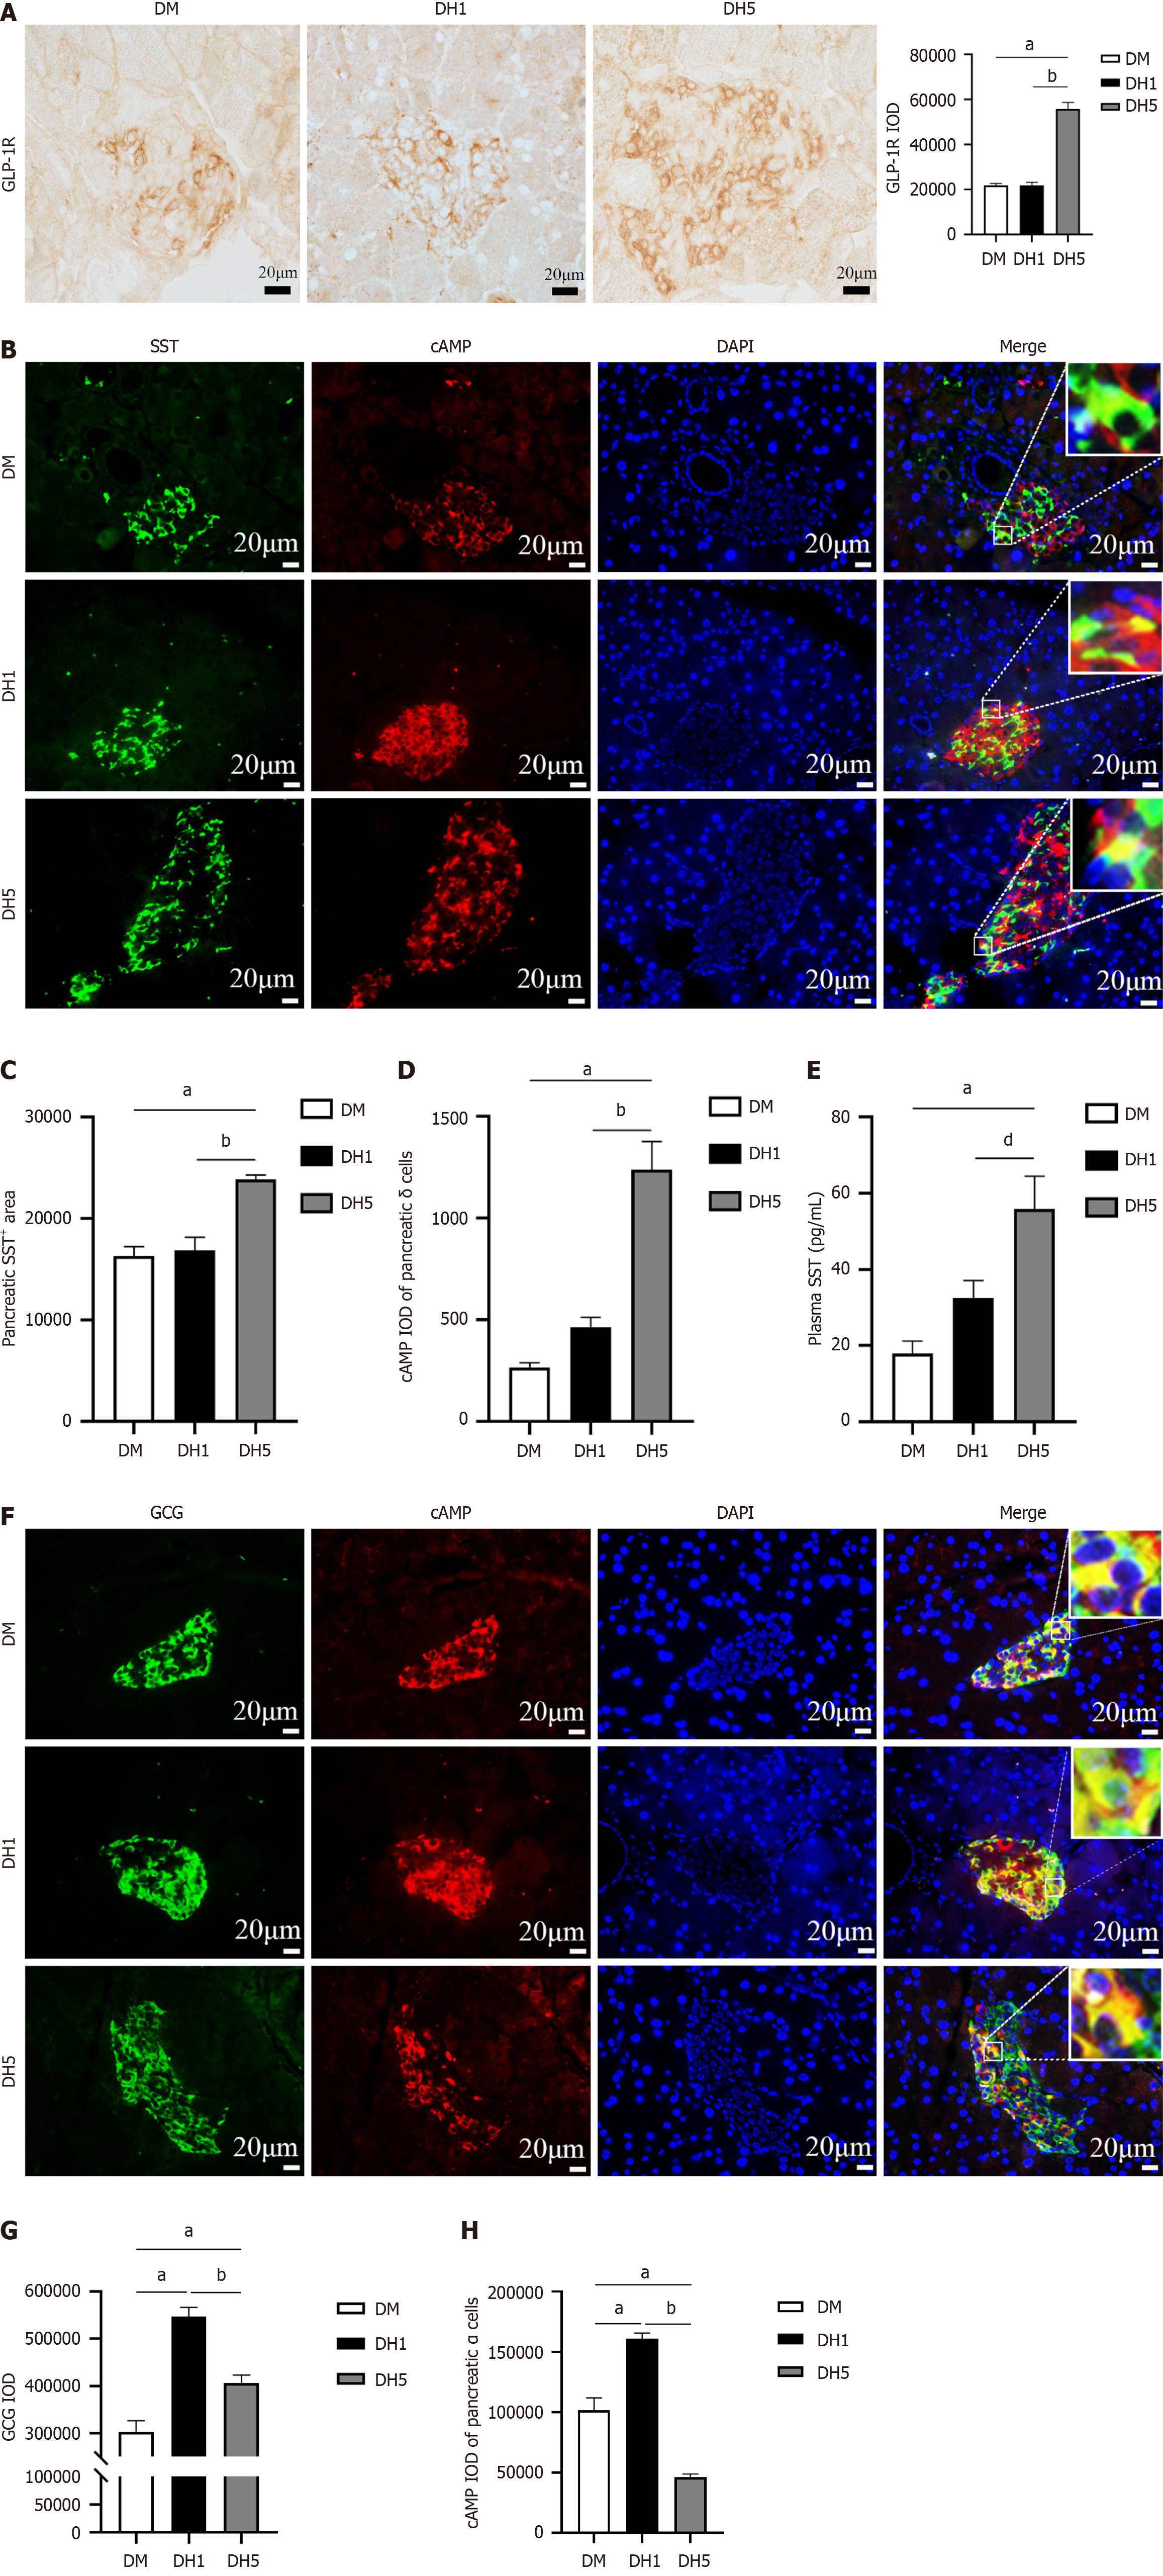
Figure 4 Intestinal glucagon-like peptide-1 inhibits glucagon secretion through endocrine effects.
A: Immunohistochemistry showing pancreatic glucagon-like peptide-1 receptor (GLP-1R) levels, with GLP-1R in brown. Bars = 20 μm; B: Immunofluorescence staining showing somatostatin (SST) + cAMP expression in the pancreas, with SST in green, cAMP in red, and cell nuclei in blue. Bars = 20 μm; C: Pancreatic SST+ cell area; D: CAMP integrated optical density (IOD) in pancreatic δ cells; E: Enzyme-linked immunosorbent assay results showing changes in plasma SST levels; F: Immunofluorescence staining showing GCG + cAMP expression in the pancreas, with GCG in green, cAMP in red, and cell nuclei in blue. Bars = 20 μm; G: Pancreatic GCG+ IOD; H: CAMP IOD in pancreatic α cells. All the data are presented as the mean ± SE. aP < 0.01 vs diabetic mice; bP < 0.01 vs diabetic mice with a single hypoglycemic episode (DH1); dP < 0.05 vs DH1 group; DM: Diabetic mice; DH1: Diabetic mice with a single hypoglycemic episode; DH5: Diabetic mice with five hypoglycaemic episodes; GLP-1: Glucagon-like peptide-1; GLP-1R: Glucagon-like peptide-1 receptor; IOD: Integrated optical density.
- Citation: Jin FX, Wang Y, Li MN, Li RJ, Guo JT. Intestinal glucagon-like peptide-1: A new player associated with impaired counterregulatory responses to hypoglycaemia in type 1 diabetic mice. World J Diabetes 2024; 15(8): 1764-1777
- URL: https://www.wjgnet.com/1948-9358/full/v15/i8/1764.htm
- DOI: https://dx.doi.org/10.4239/wjd.v15.i8.1764


