Copyright
©The Author(s) 2024.
World J Diabetes. Jul 15, 2024; 15(7): 1627-1644
Published online Jul 15, 2024. doi: 10.4239/wjd.v15.i7.1627
Published online Jul 15, 2024. doi: 10.4239/wjd.v15.i7.1627
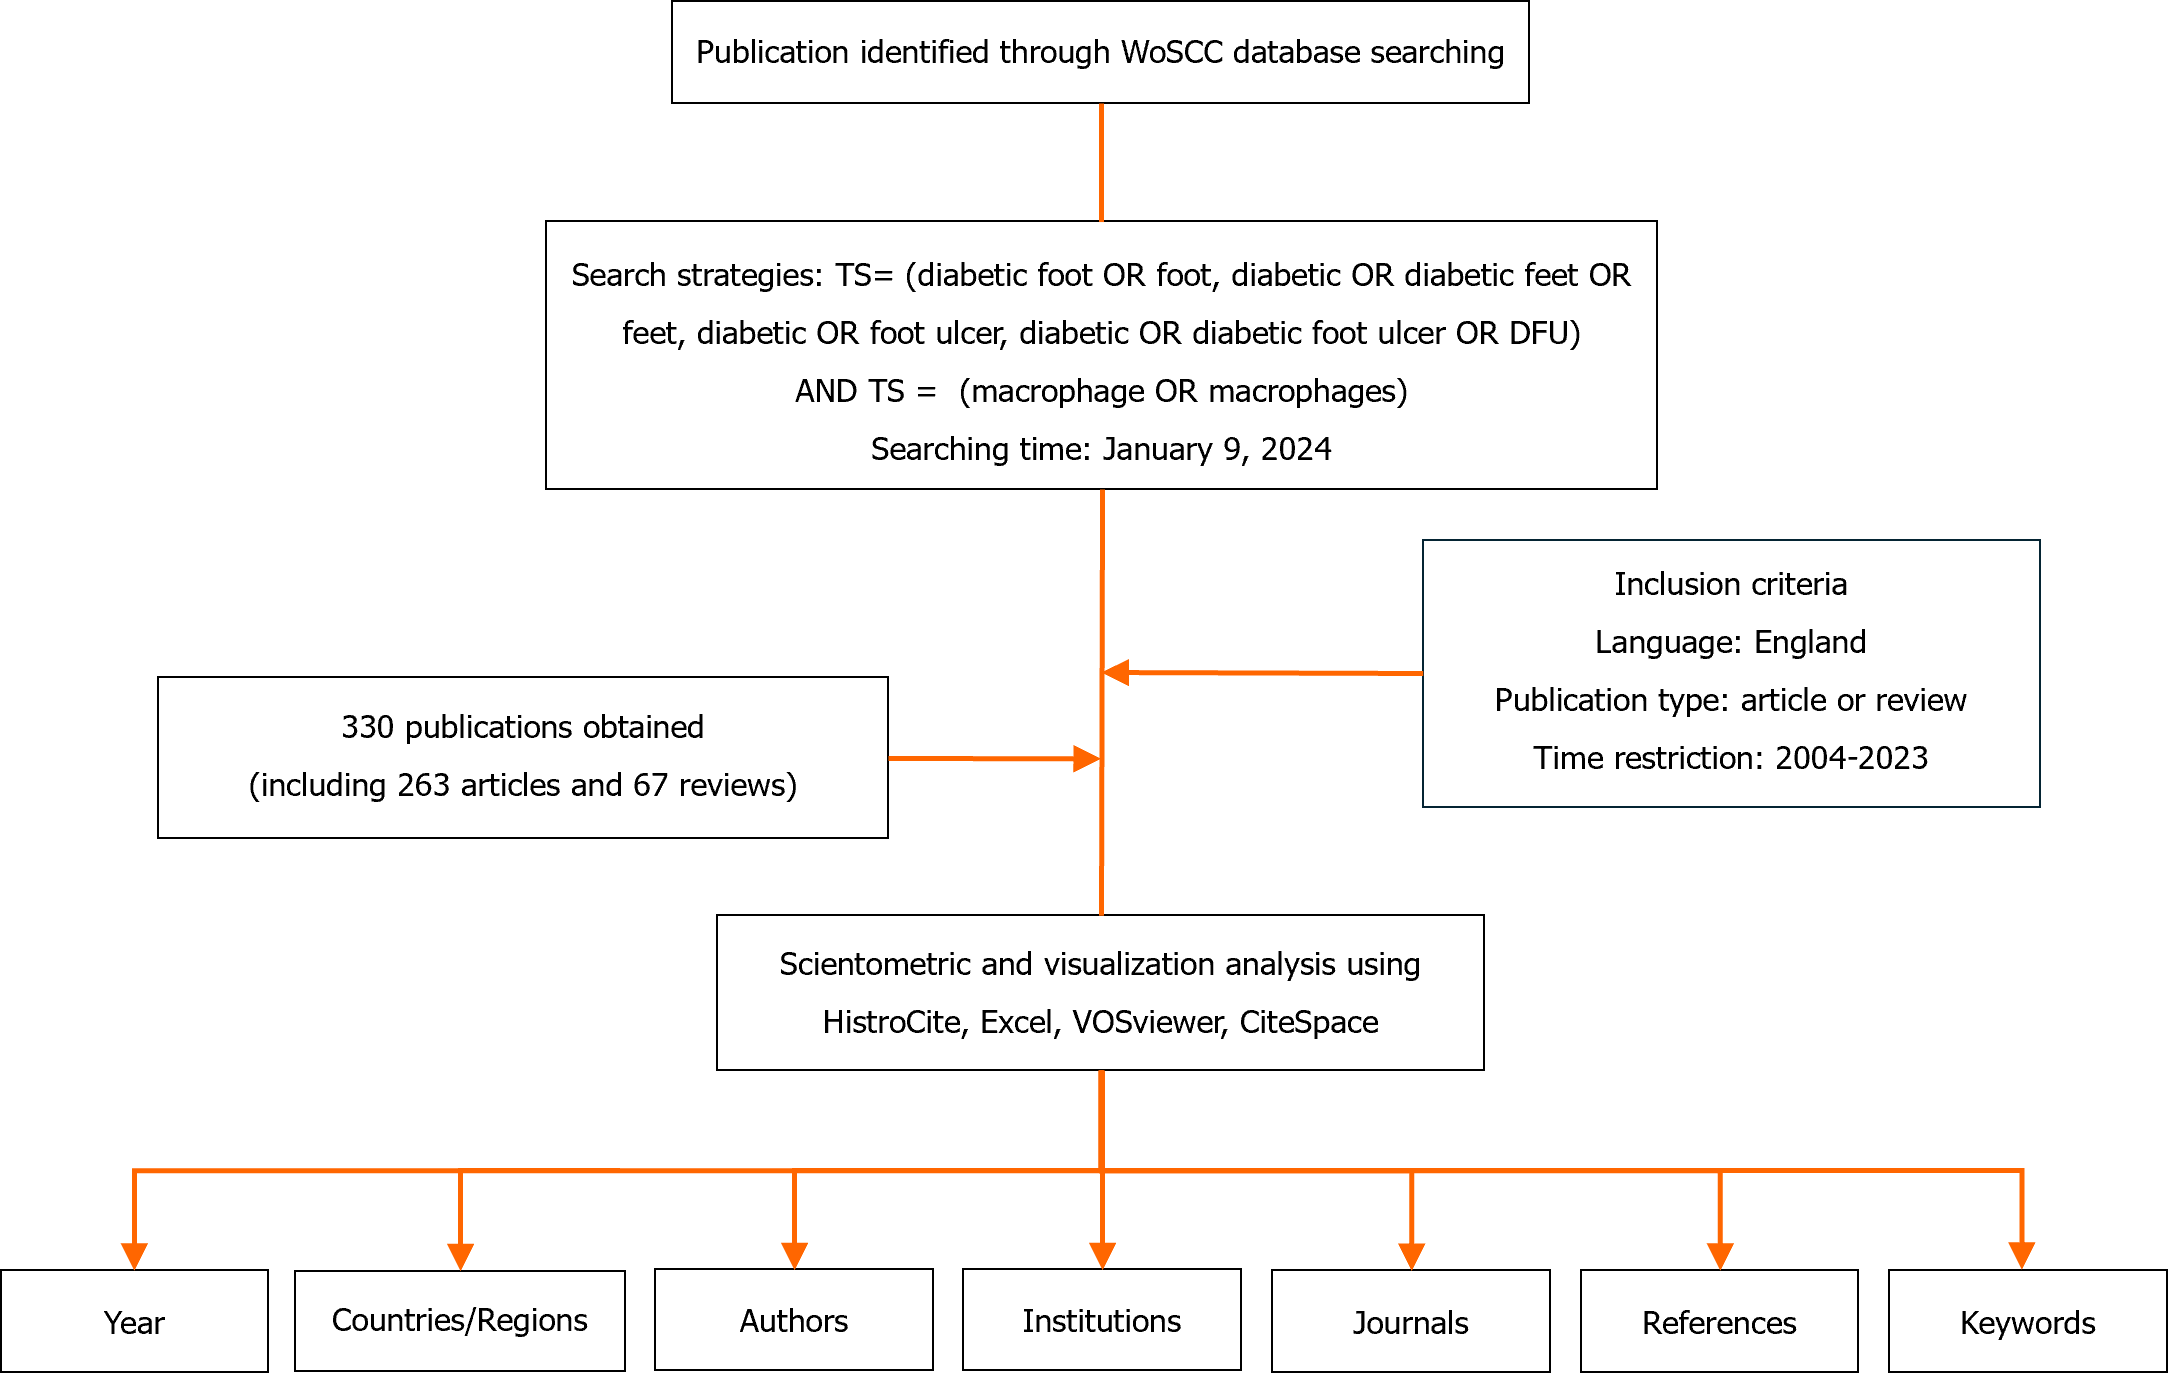
Figure 1 Flowchart of literature search, selection and bibliometric analysis.
DFU: Diabetic foot ulcer; WoSCC: Web of Science Core Collection.
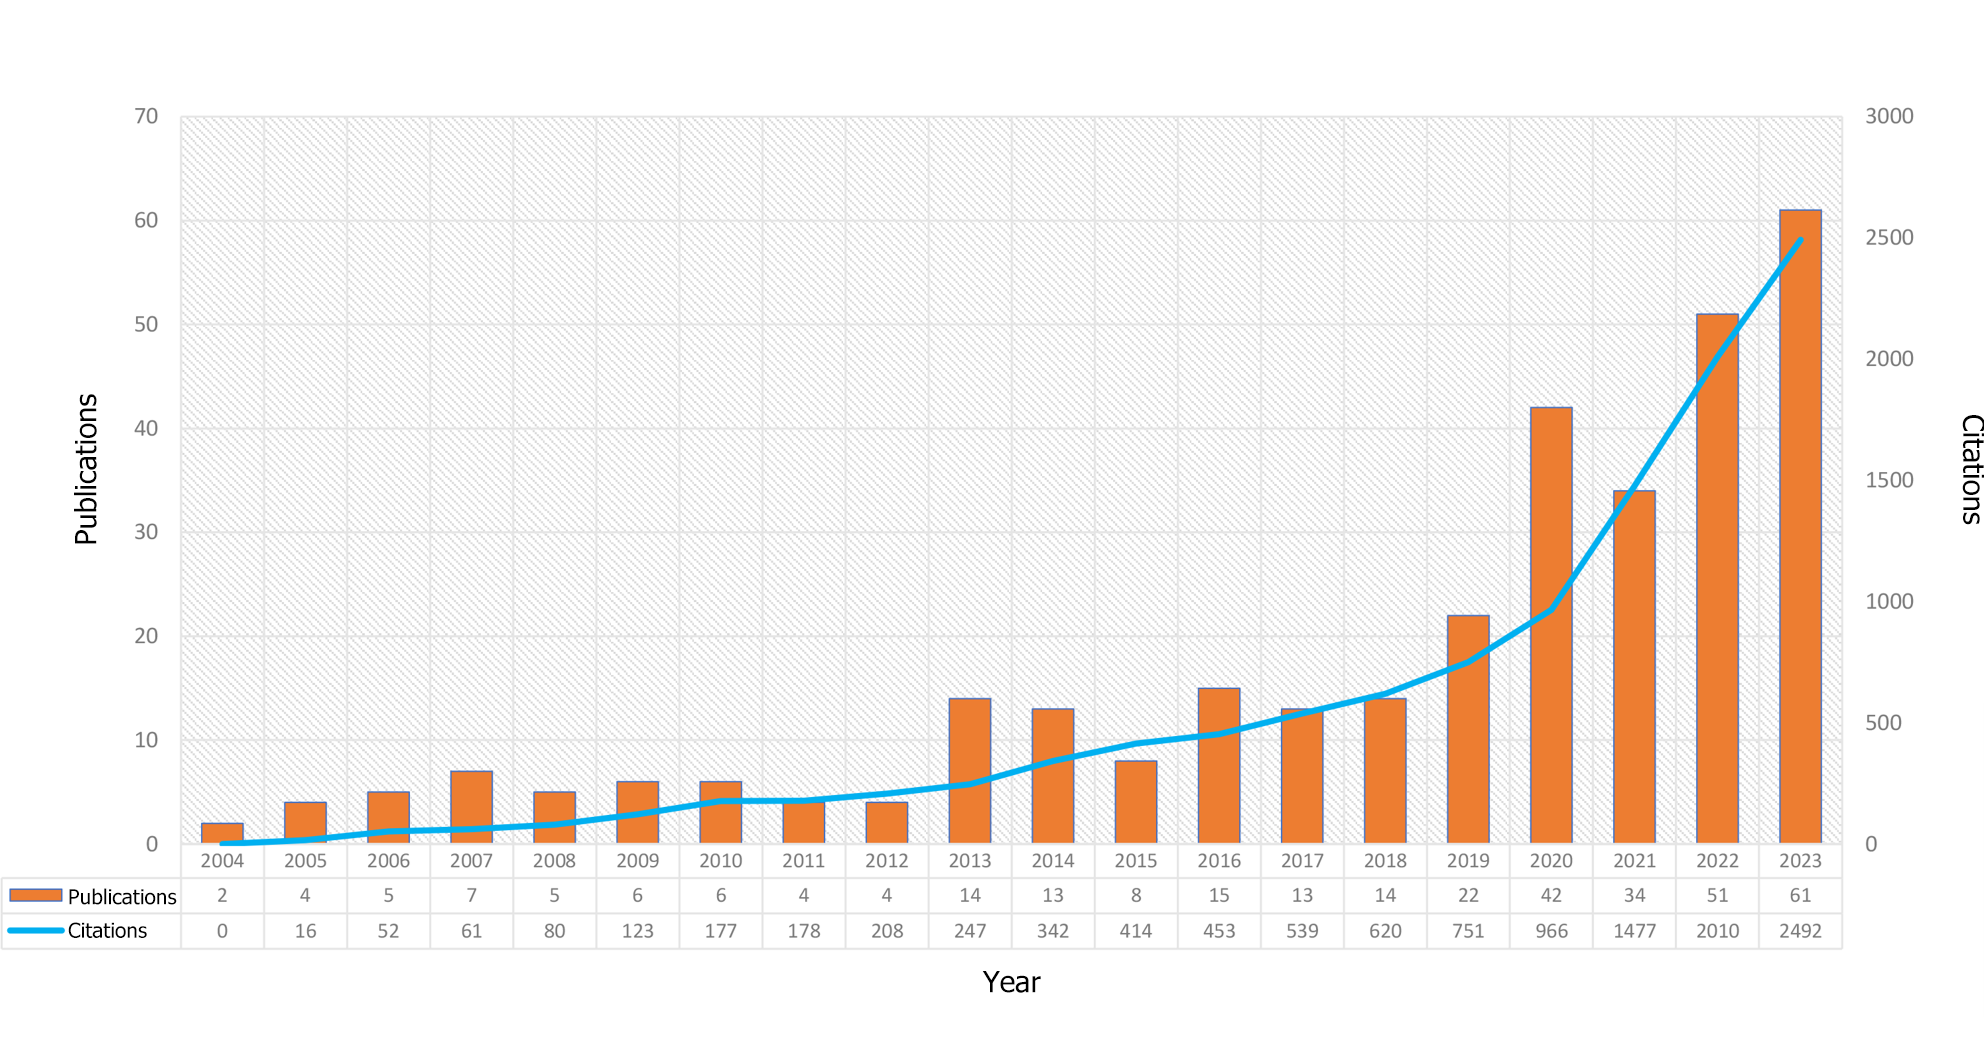
Figure 2 The specific number of annual publications regarding macrophage-related diabetic foot ulcers from 2004 to 2023.
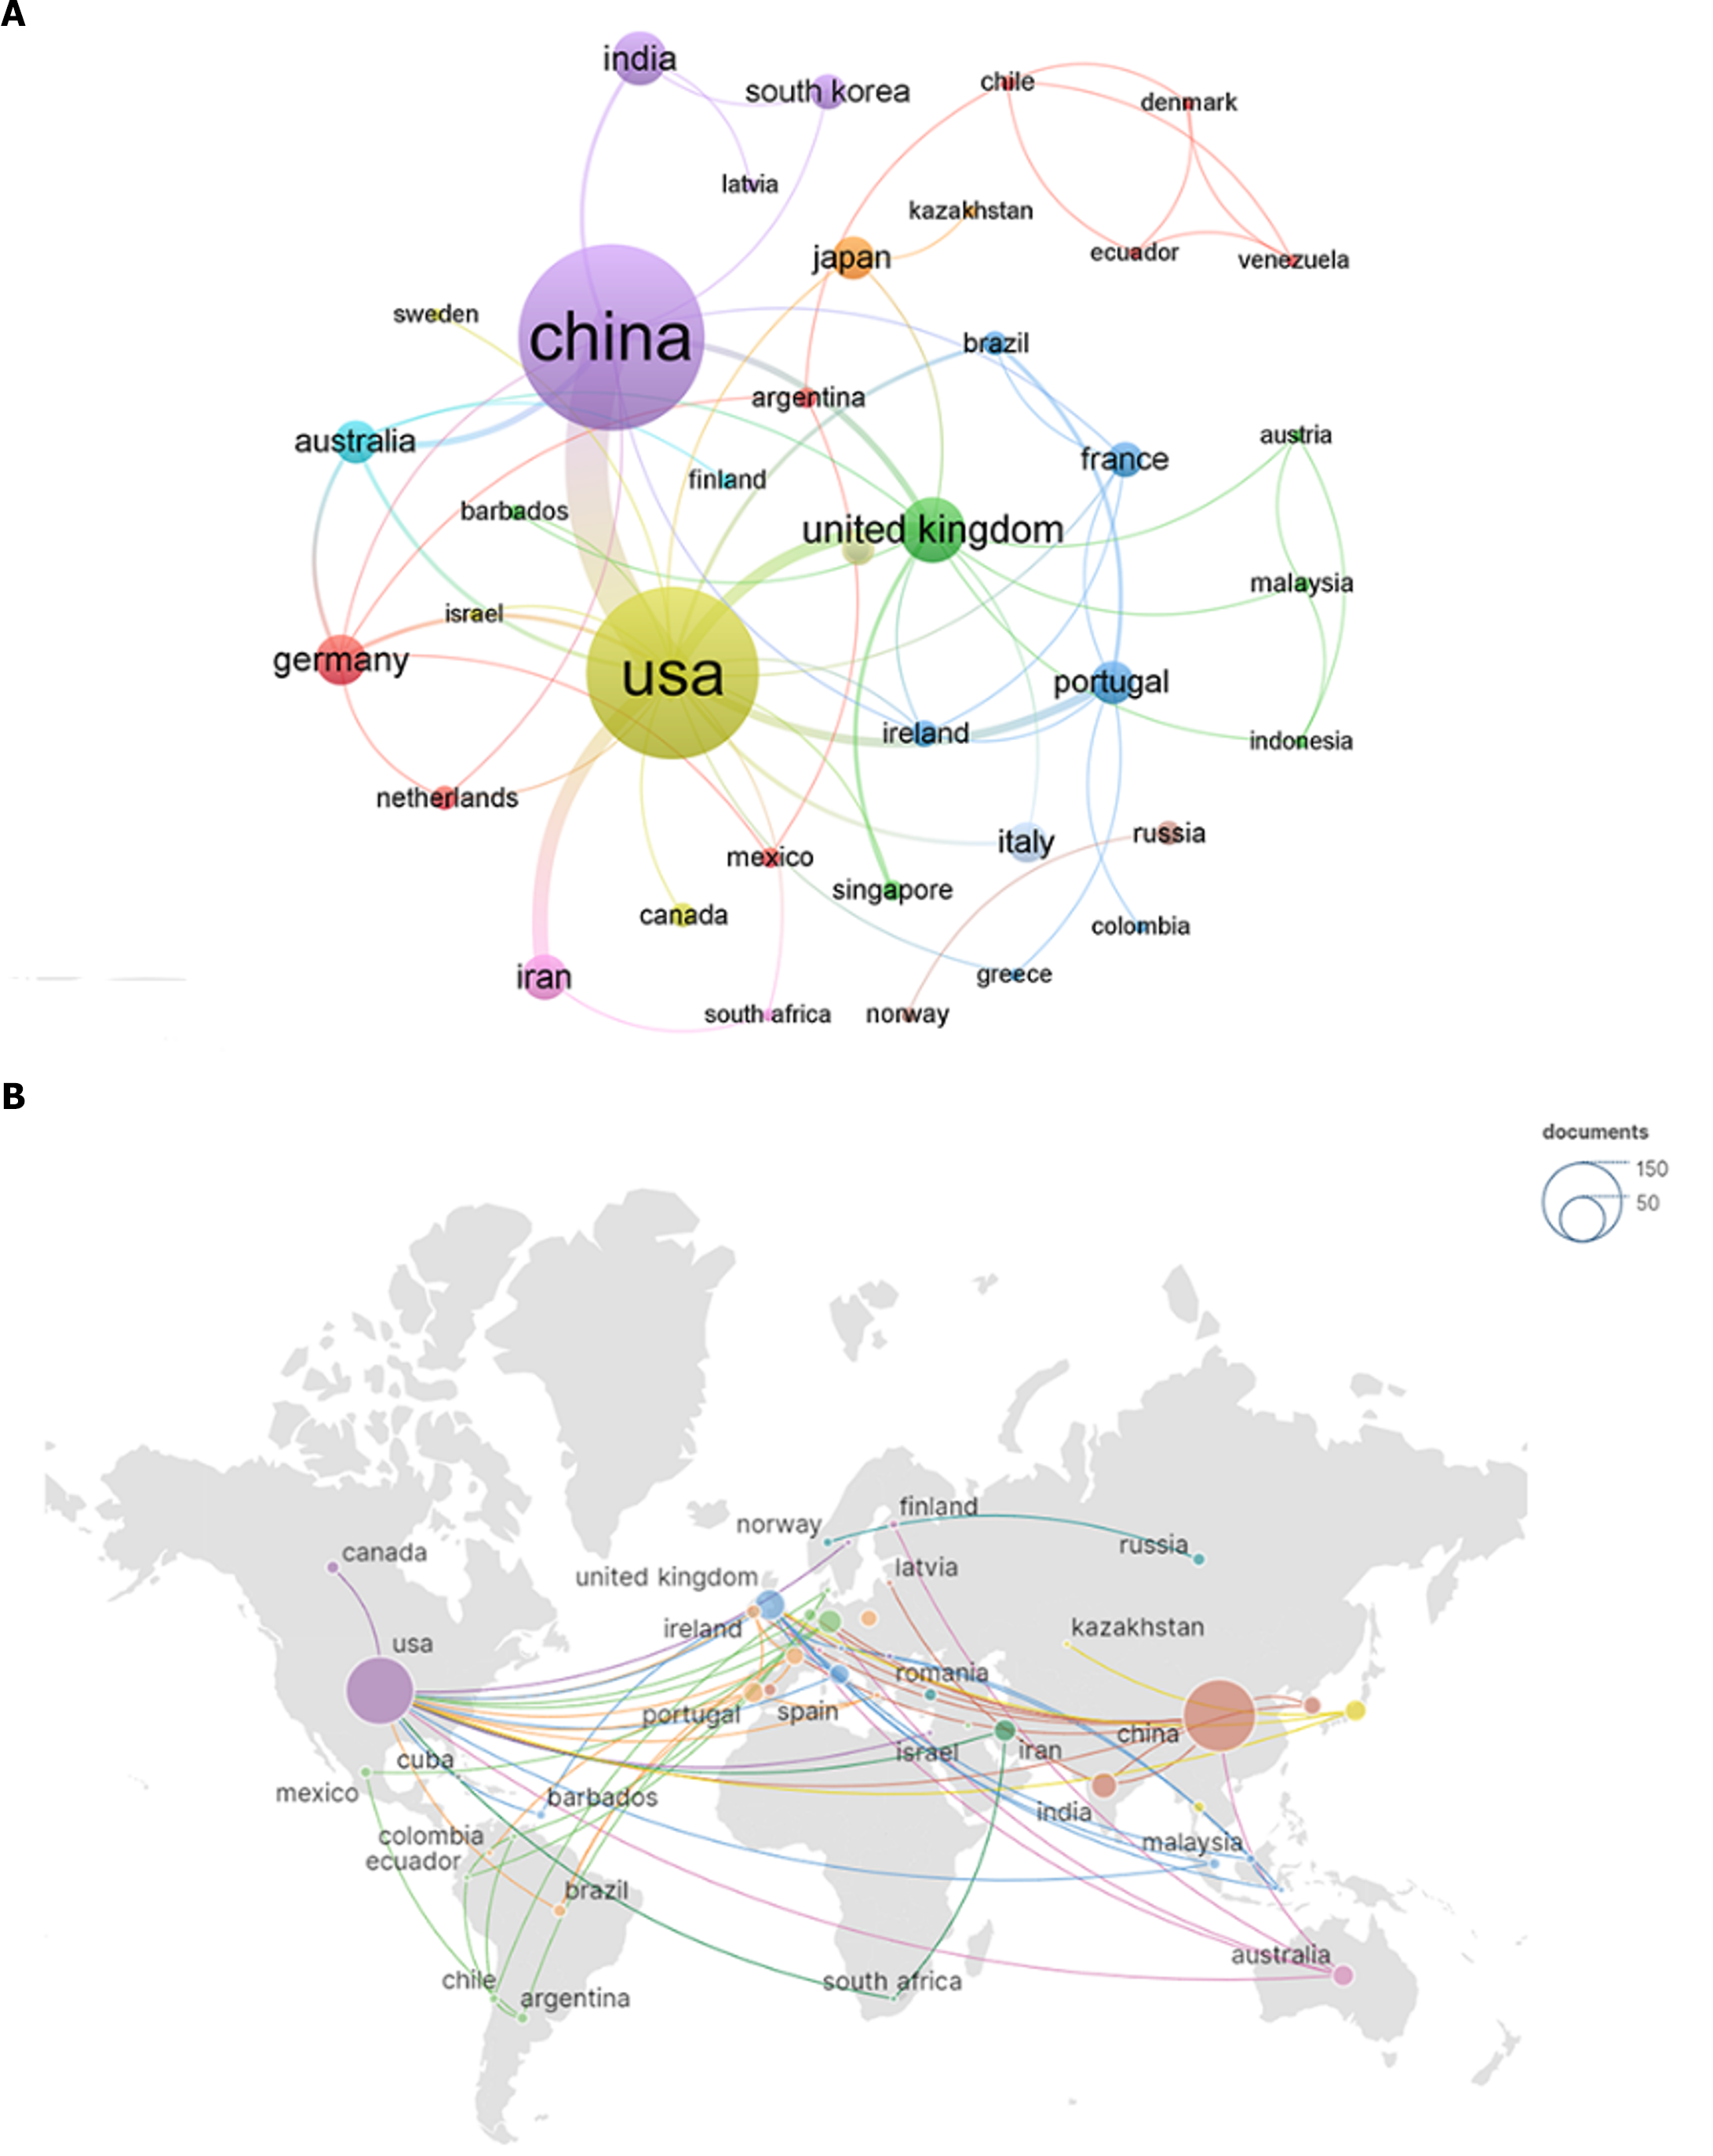
Figure 3 The proportion and country network map associated with this research.
A: The international cooperation analysis among different countries; B: The country network map associated with this research. Each country is represented as a node, and the node size is proportional to the sum of publications. A link between two nodes indicates a cooperative relationship.
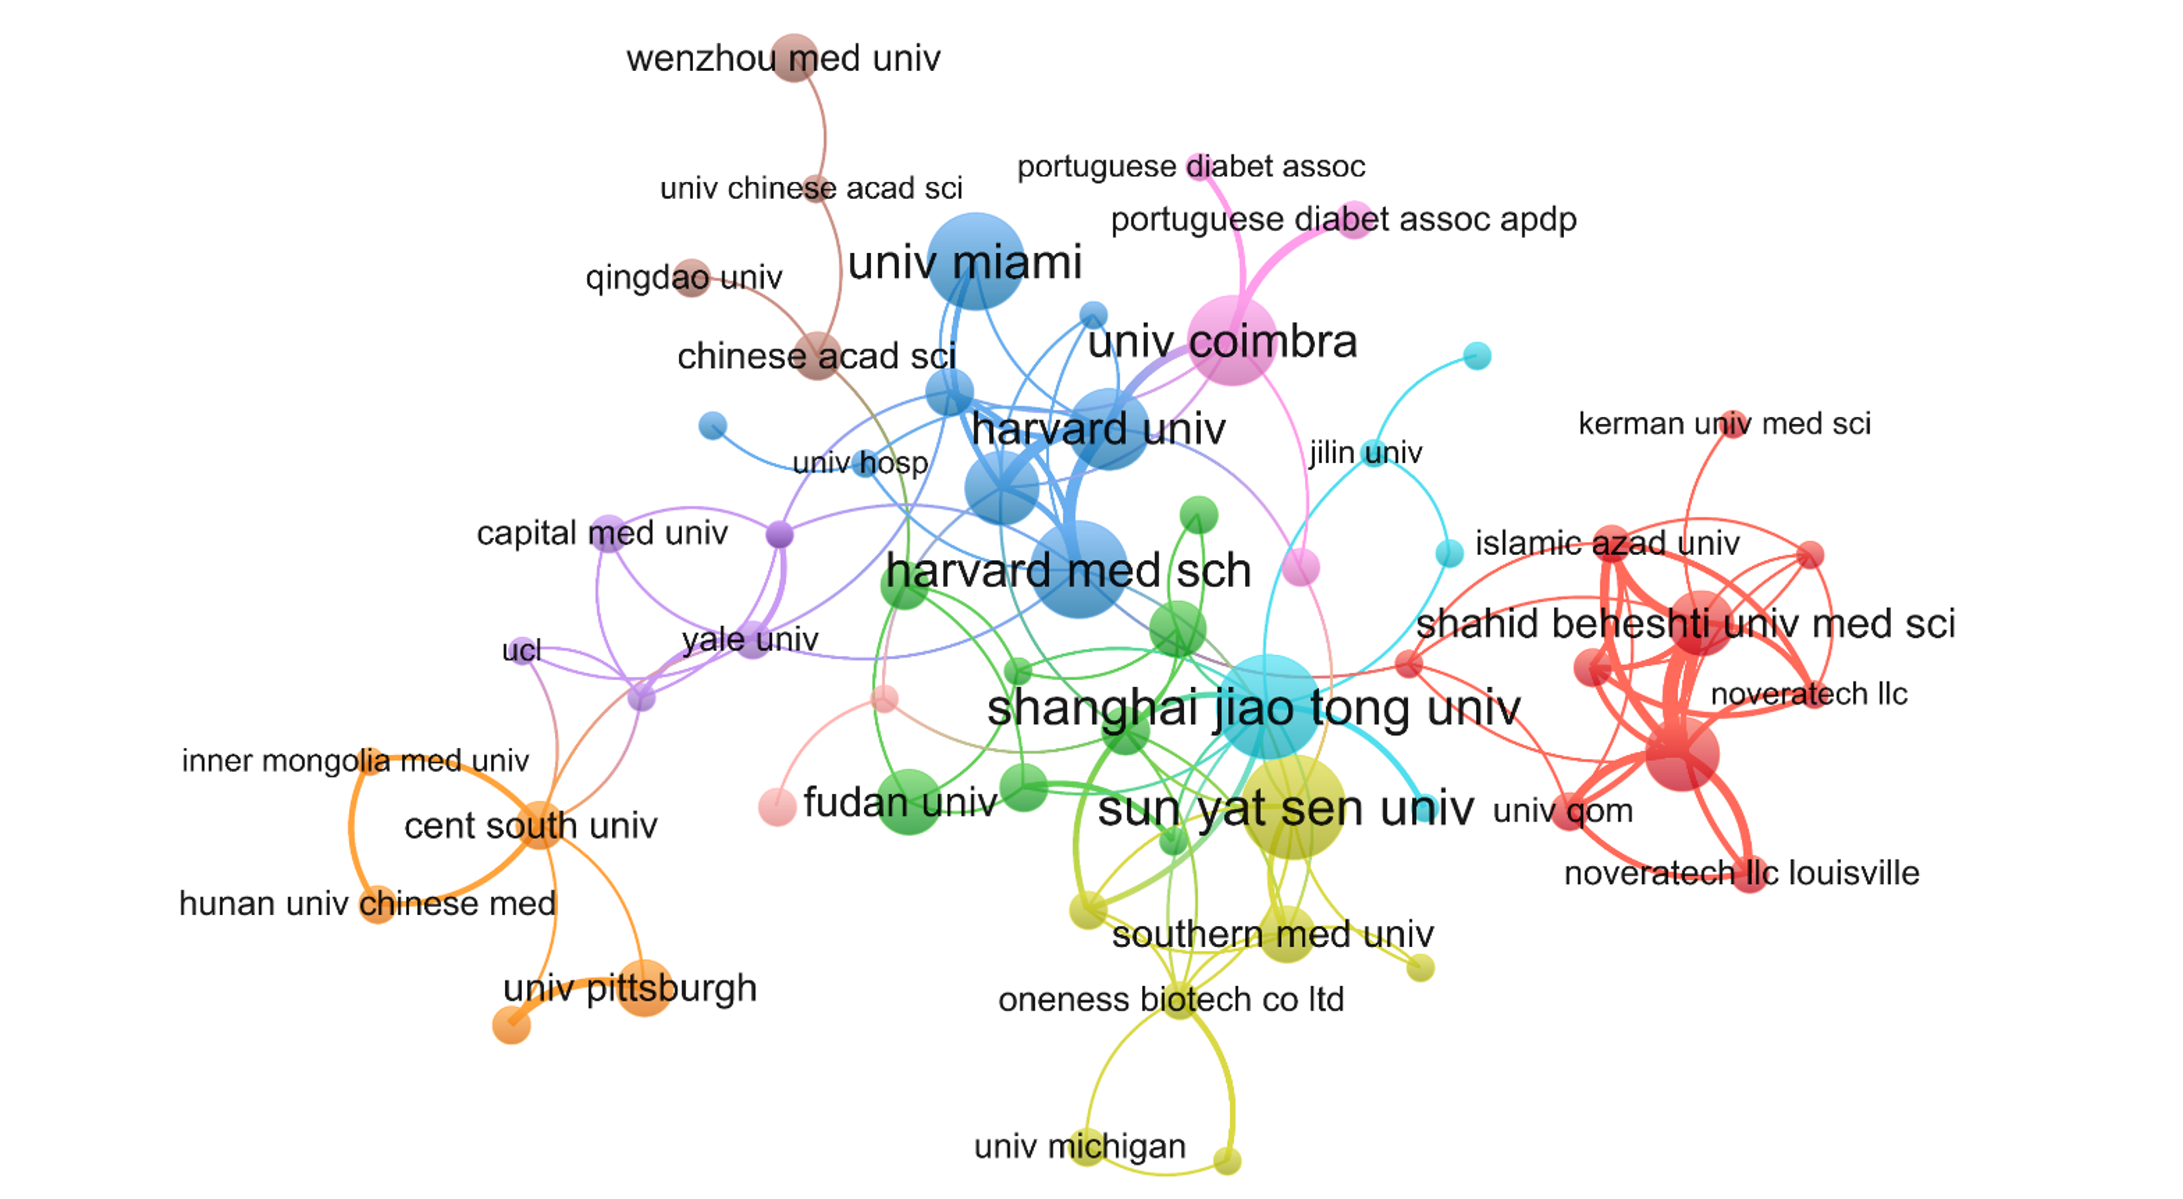
Figure 4 The institutions network diagram associated with this field.
A node represents an institution, and the size of each node represents its relative quantity of research output. Each line represents the strength of the cooperation relationship between two institutions, and strength value is displayed between lines. Threshold excludes institutions with ≥ 2 items published.
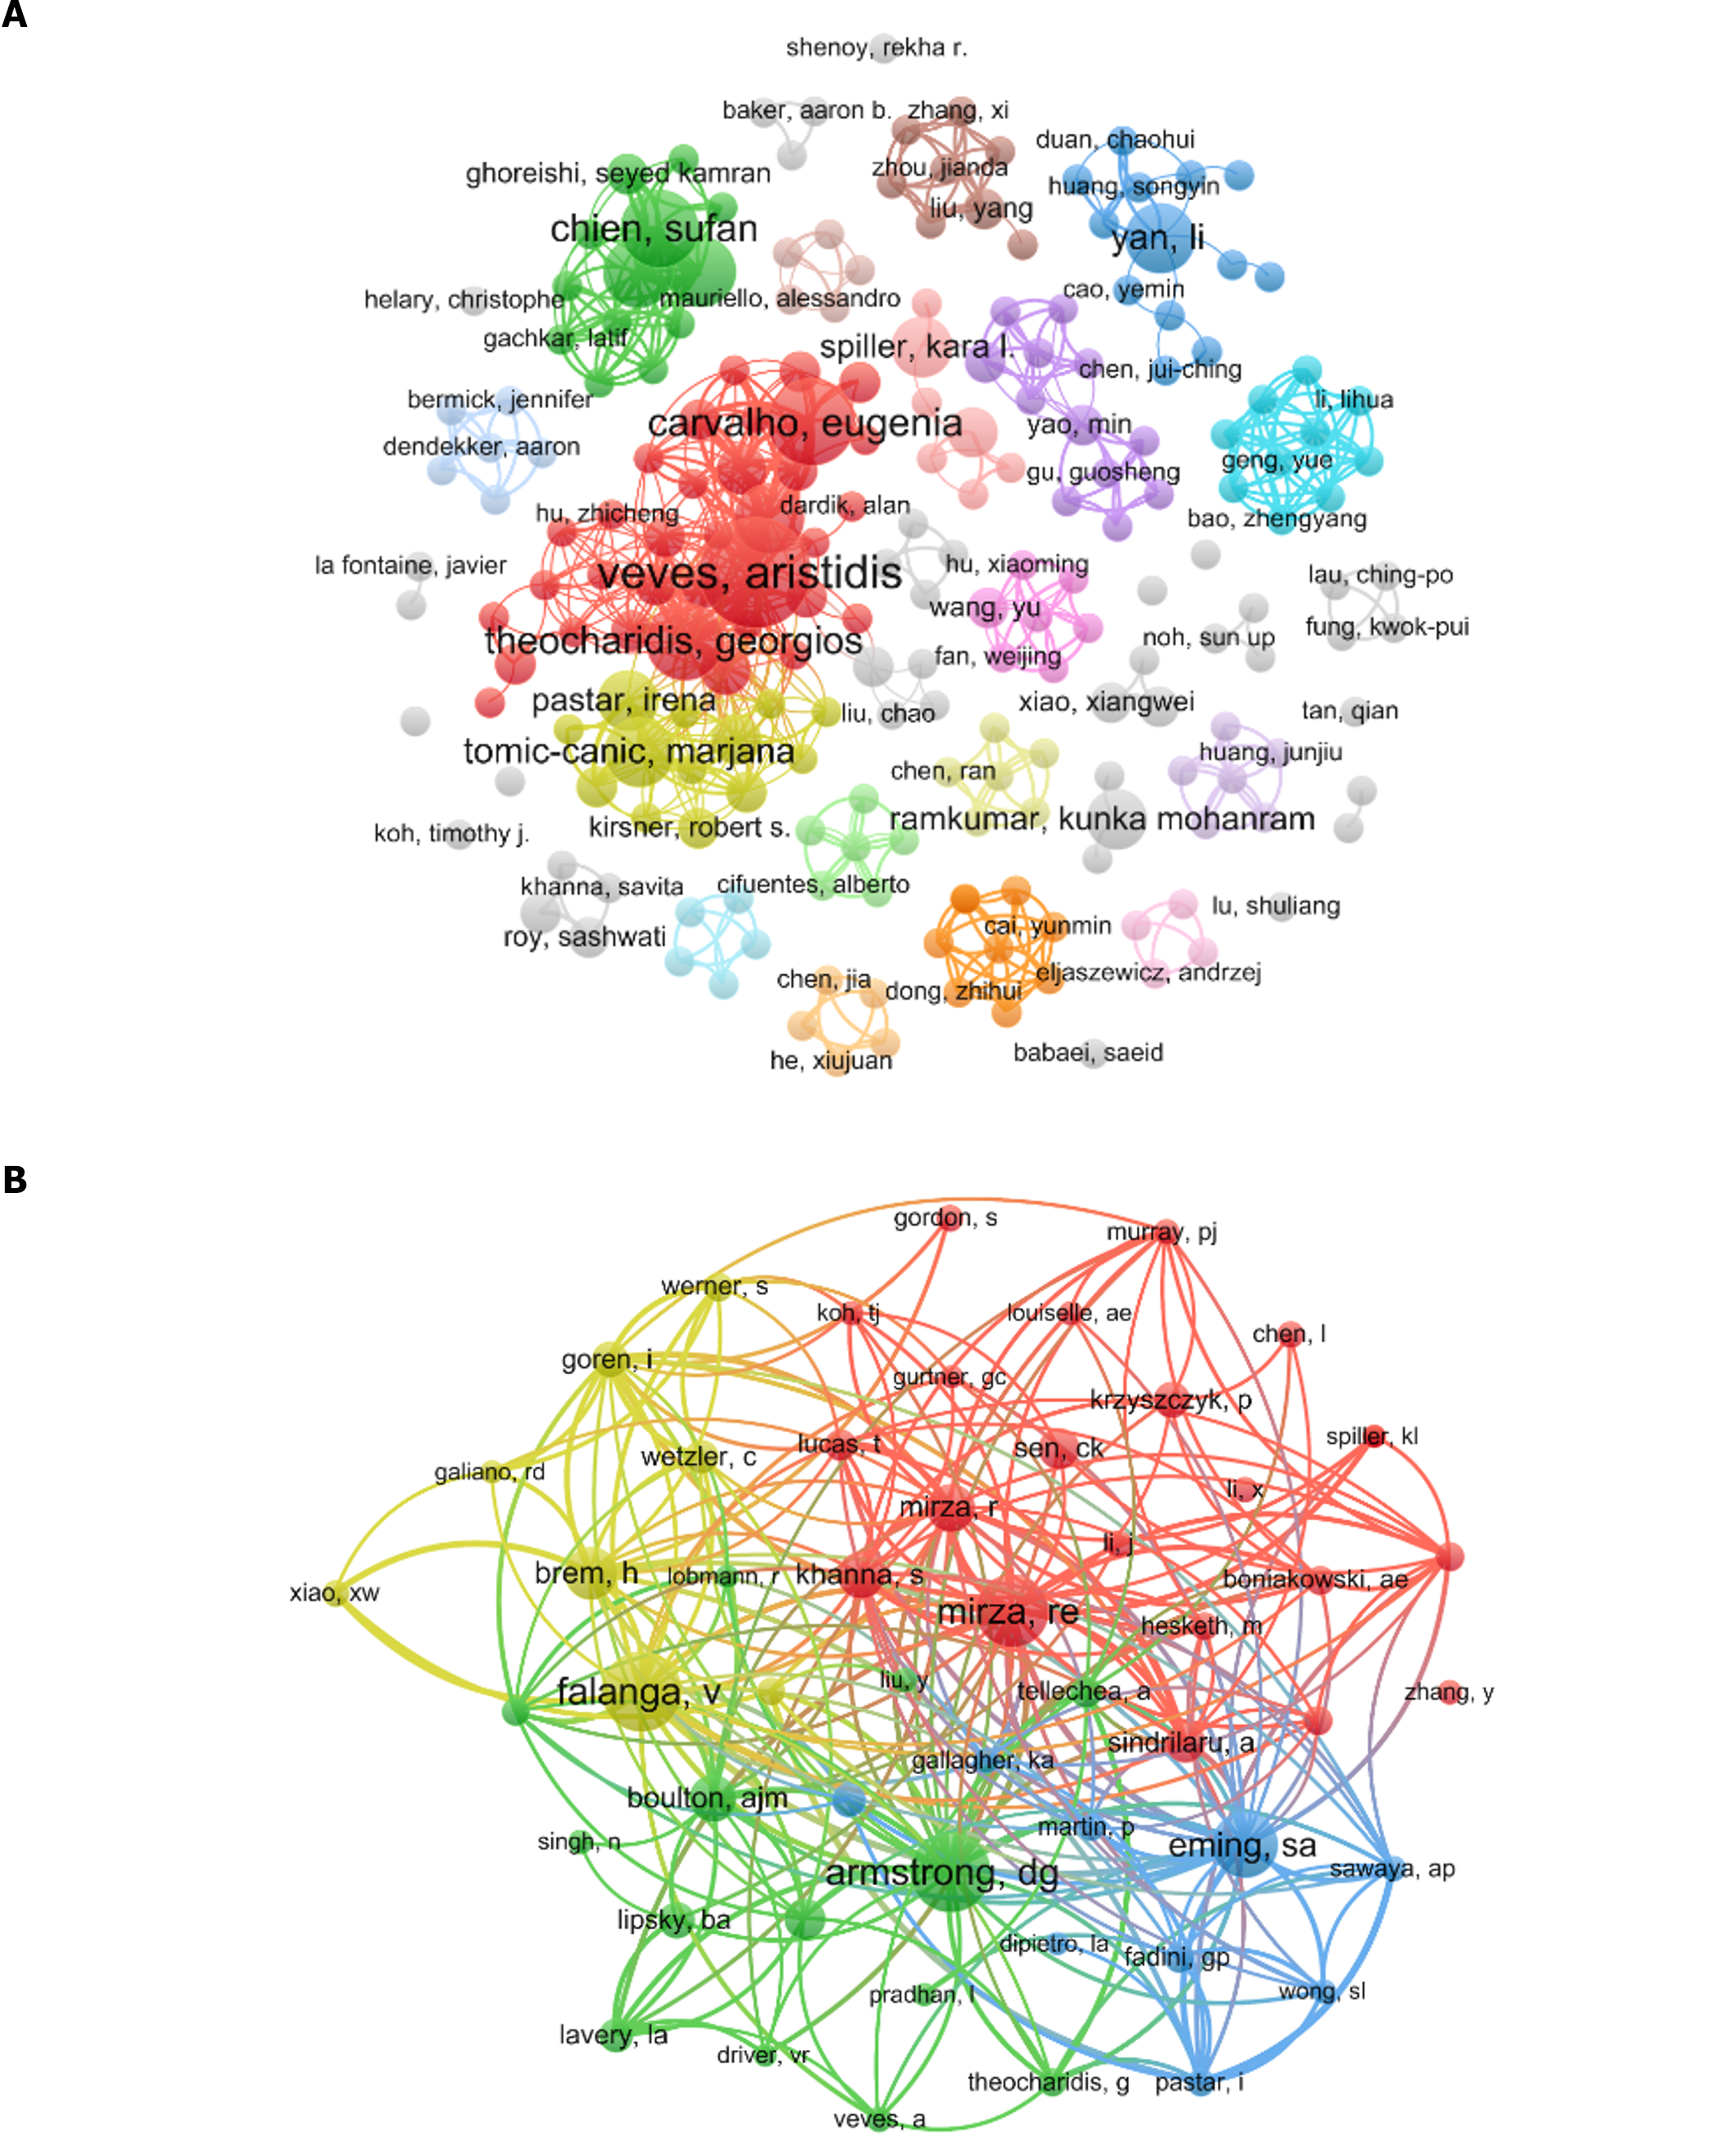
Figure 5 The network visualization map of authors and co-cited authors analysis.
Each author is represented as a node. A: The node size is proportional to the number of publications (T = 2) and a link between two nodes indicates a cooperation relationship; B: The node size is proportional to the sum of citations (T = 20) and a link between two nodes indicates a co-citation relationship. The distance between nodes indicates the relatedness, and a smaller distance implies a higher relatedness and will be assigned to one cluster with the same colors.
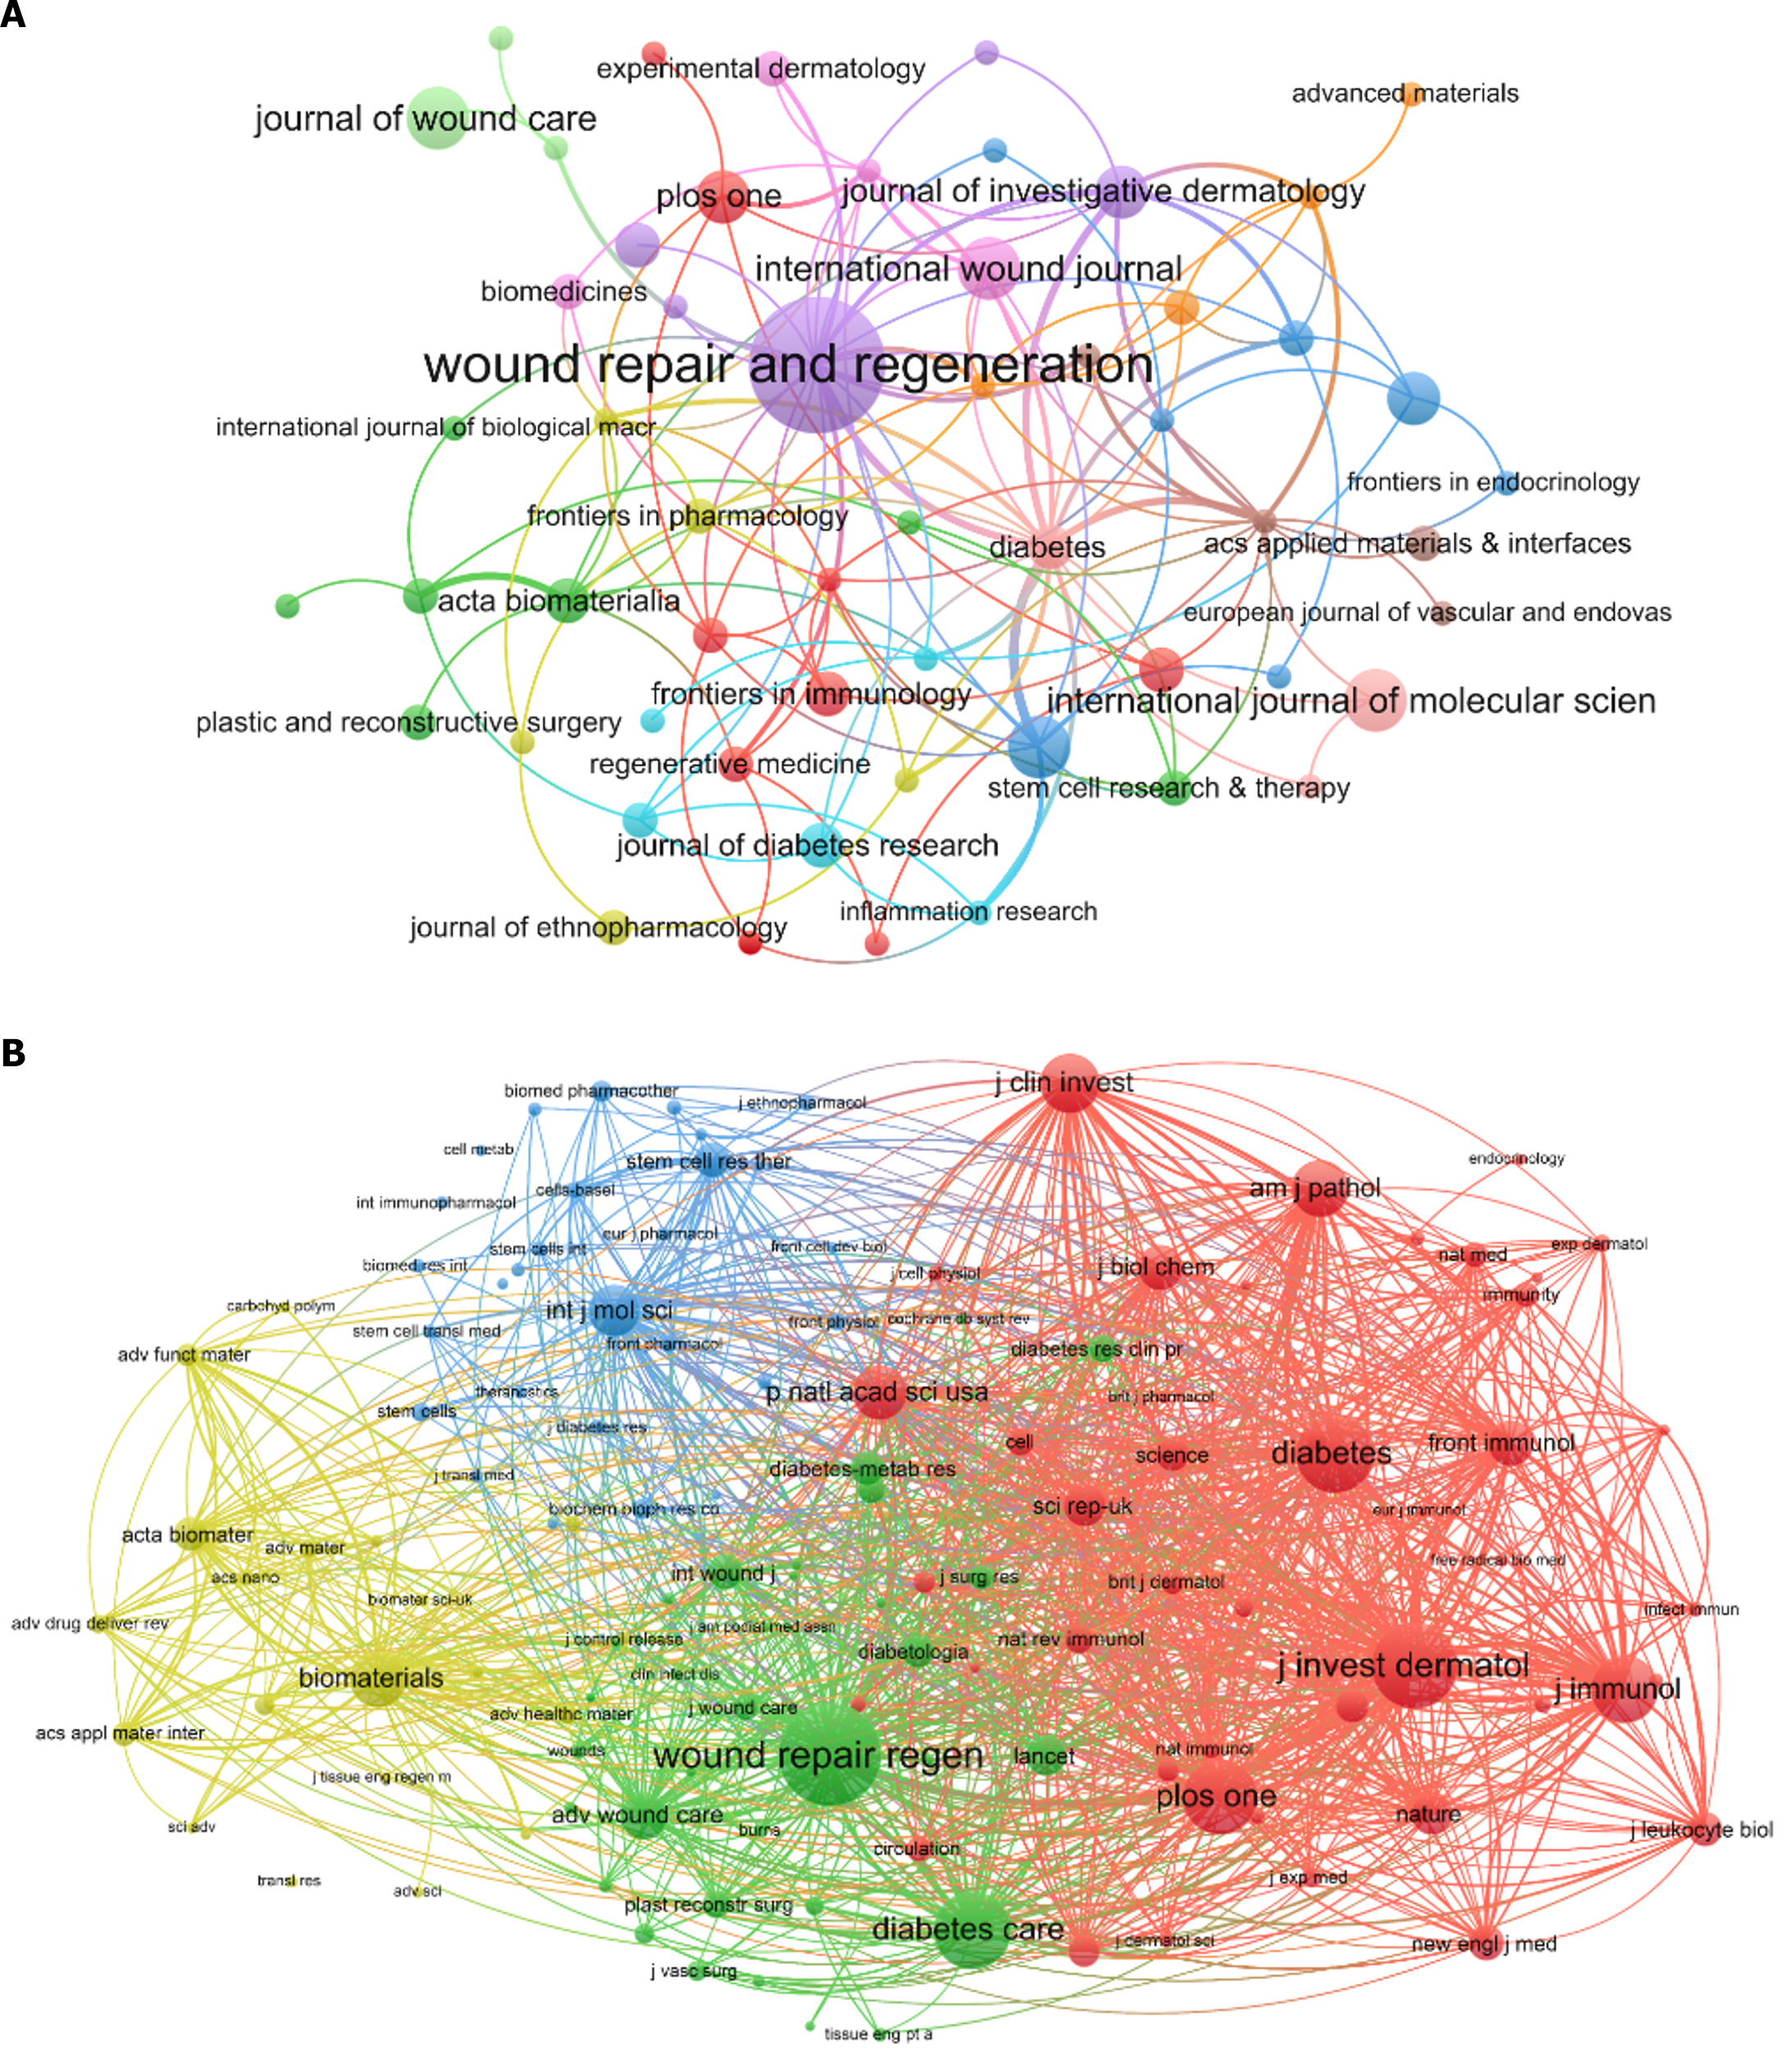
Figure 6 The network visualization map of journals and co-cited academic journals analysis.
Each journal is represented as a node. A: The node size is proportional to the number of publications (T = 2); B: The node size is proportional to the sum of co-citations (T = 30).
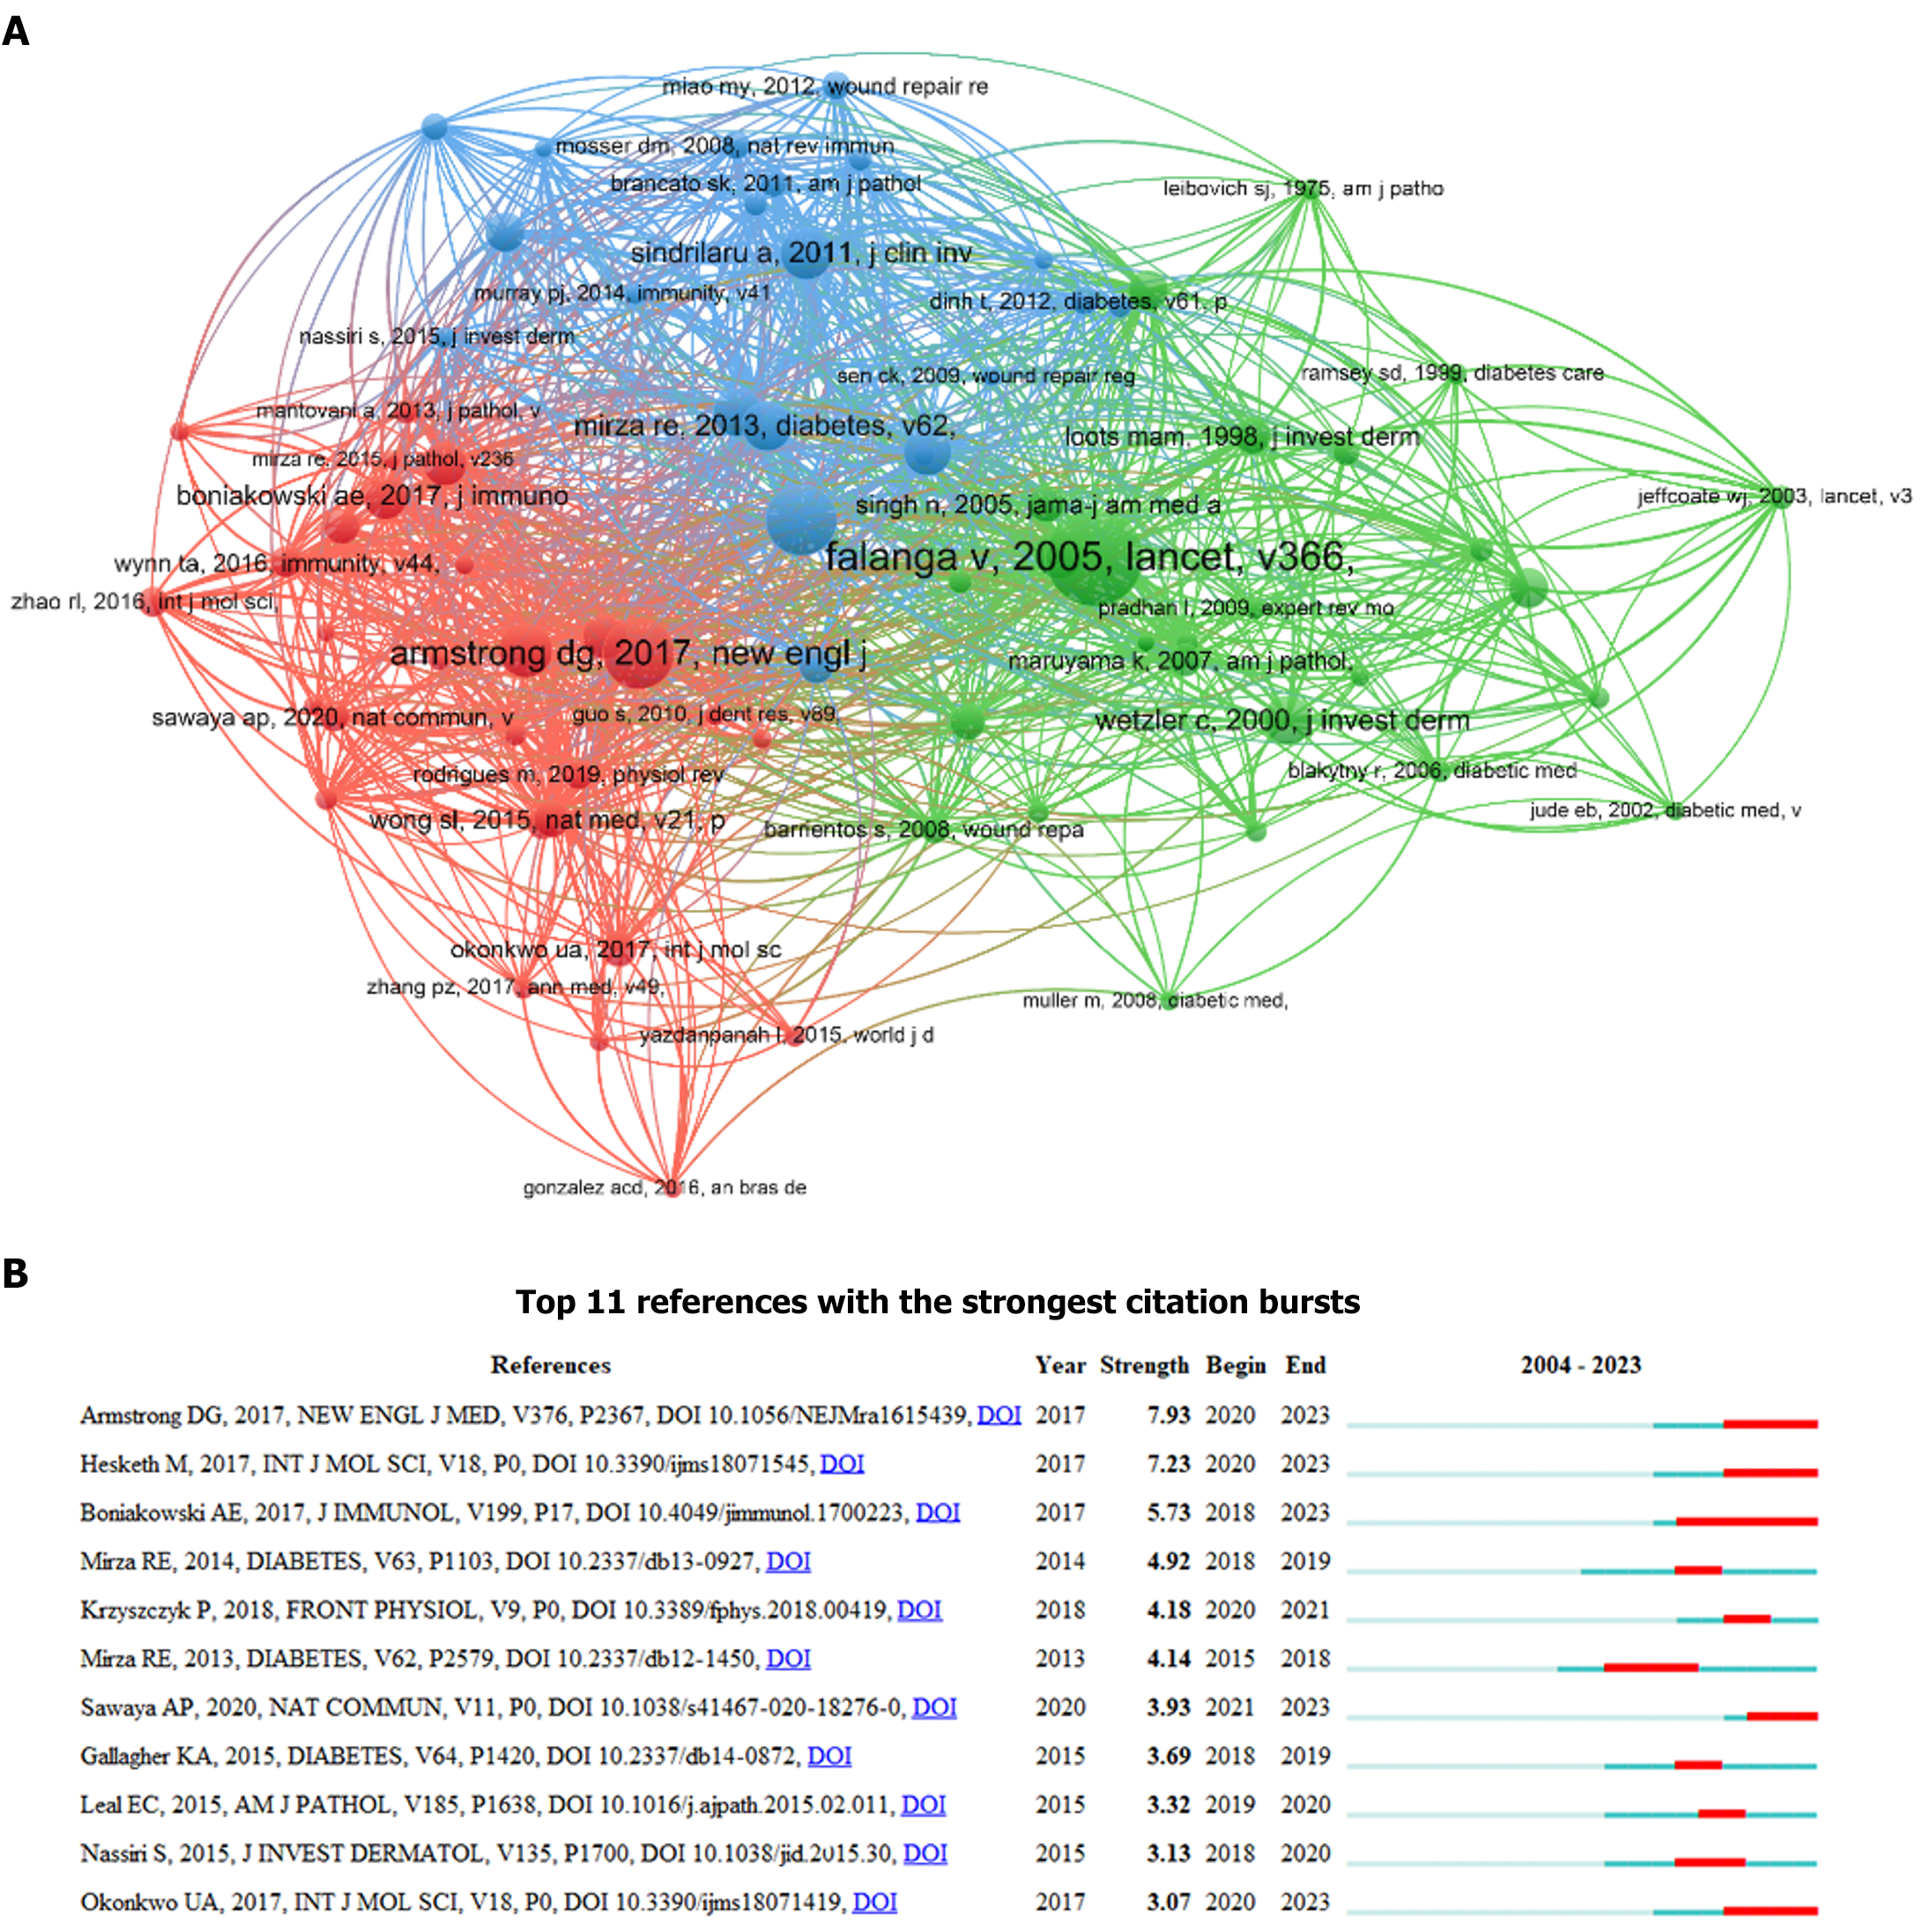
Figure 7 The co-citations network map of papers and top 11 references with the strongest citation bursts.
A: A node represents a reference, and the node size is proportional to the sum of co-citations (T = 10); B: References that were commonly cited are depicted by red bars, whereas references that were rarely cited are represented by blue bars.
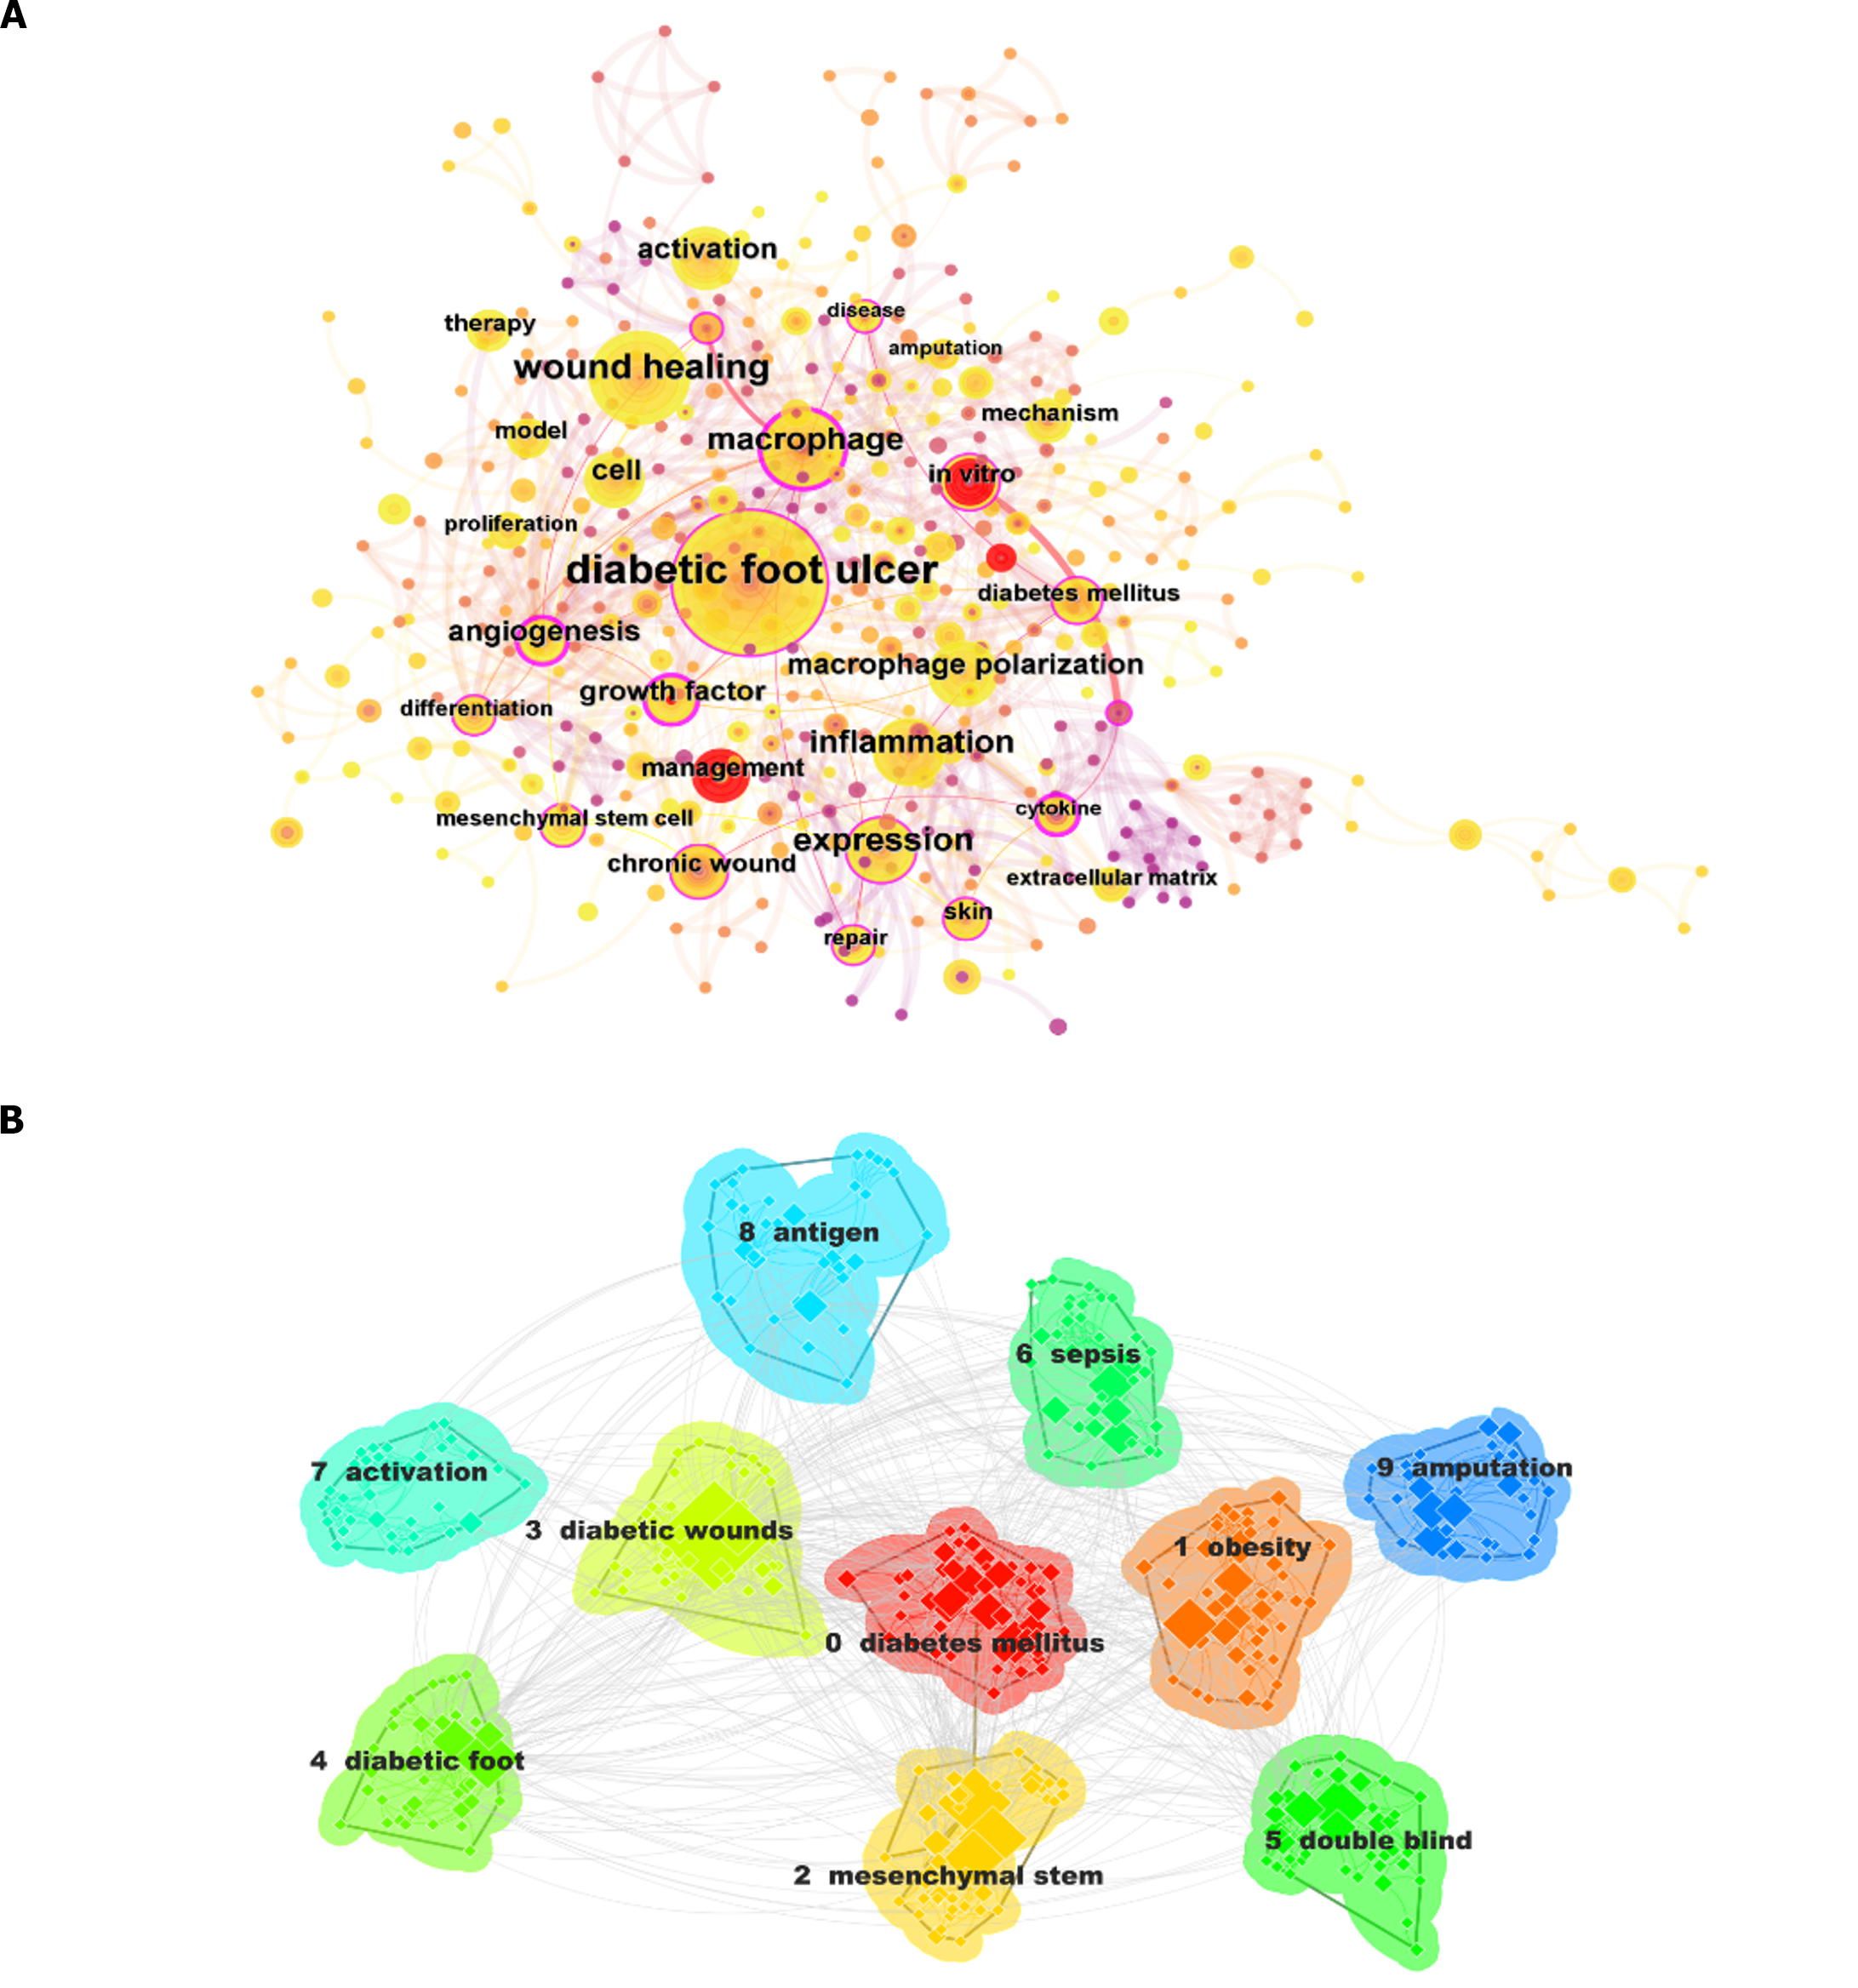
Figure 8 The cooccurrence map of keywords on macrophage-related diabetic foot ulcers research.
A: The size of nodes represents the frequency, while the lines between nodes reflect the cooccurrence relationship (T = 10); B: Top 10 keyword clusters of research involving macrophage-related diabetic foot ulcers. The size of nodes represents the co-occurrence frequency, and different colors represent different clustering of keywords.
- Citation: Wen JP, Ou SJ, Liu JB, Zhang W, Qu YD, Li JX, Xia CL, Yang Y, Qi Y, Xu CP. Global trends in publications regarding macrophages-related diabetic foot ulcers in the last two decades. World J Diabetes 2024; 15(7): 1627-1644
- URL: https://www.wjgnet.com/1948-9358/full/v15/i7/1627.htm
- DOI: https://dx.doi.org/10.4239/wjd.v15.i7.1627


