Copyright
©The Author(s) 2024.
World J Diabetes. Jul 15, 2024; 15(7): 1615-1626
Published online Jul 15, 2024. doi: 10.4239/wjd.v15.i7.1615
Published online Jul 15, 2024. doi: 10.4239/wjd.v15.i7.1615
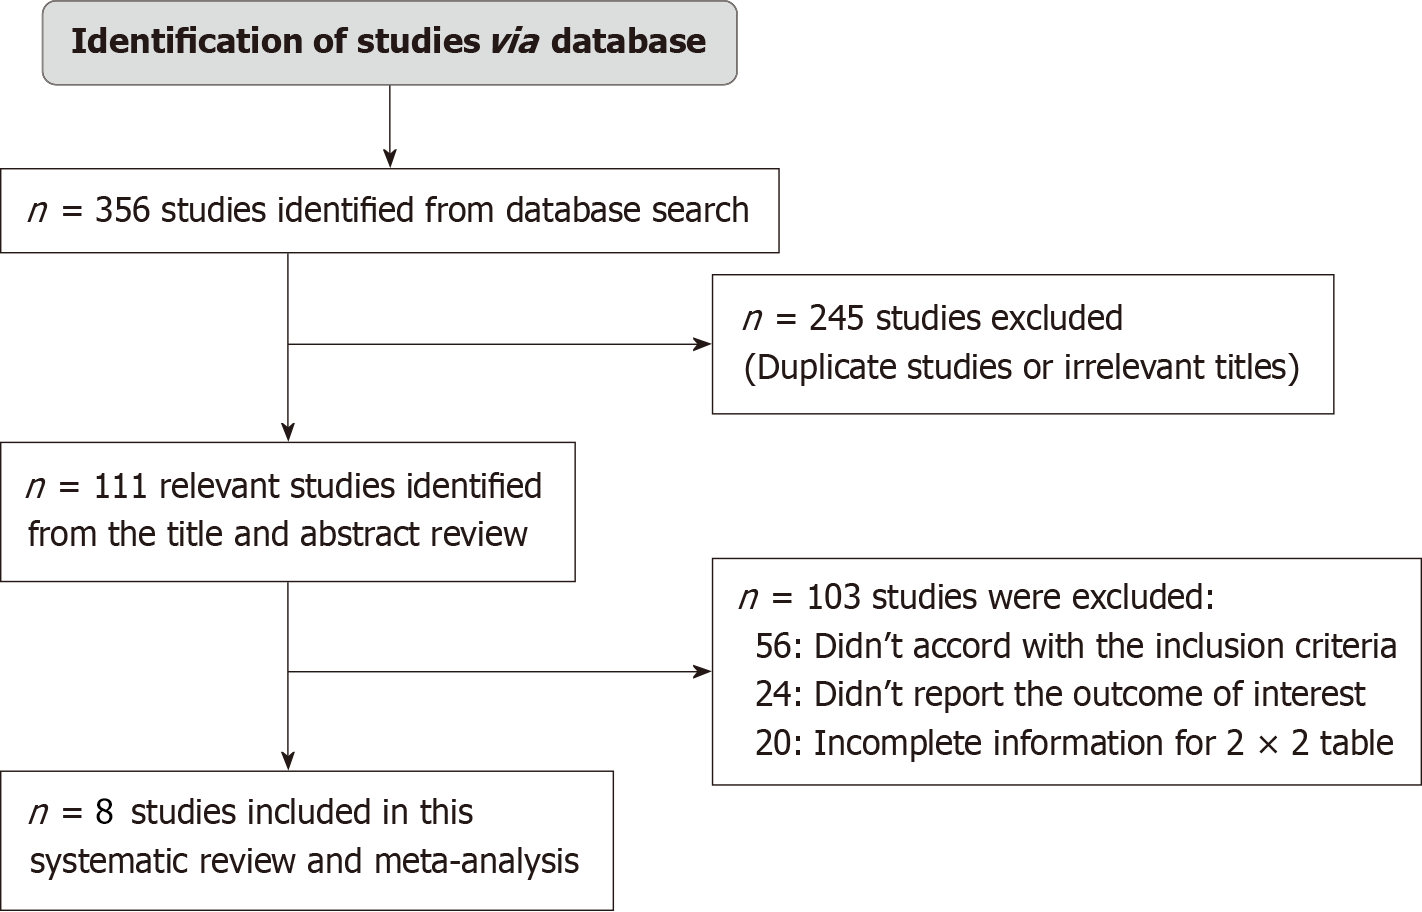
Figure 1
Flow of selection of studies.
Figure 2 Assessment of risk of bias.
A: Traffic light plot for assessment of risk of bias of included studies; B: Summary plot for assessment of risk of bias of included studies.
Figure 3
Funnel plot for assessment of publication bias of included studies.
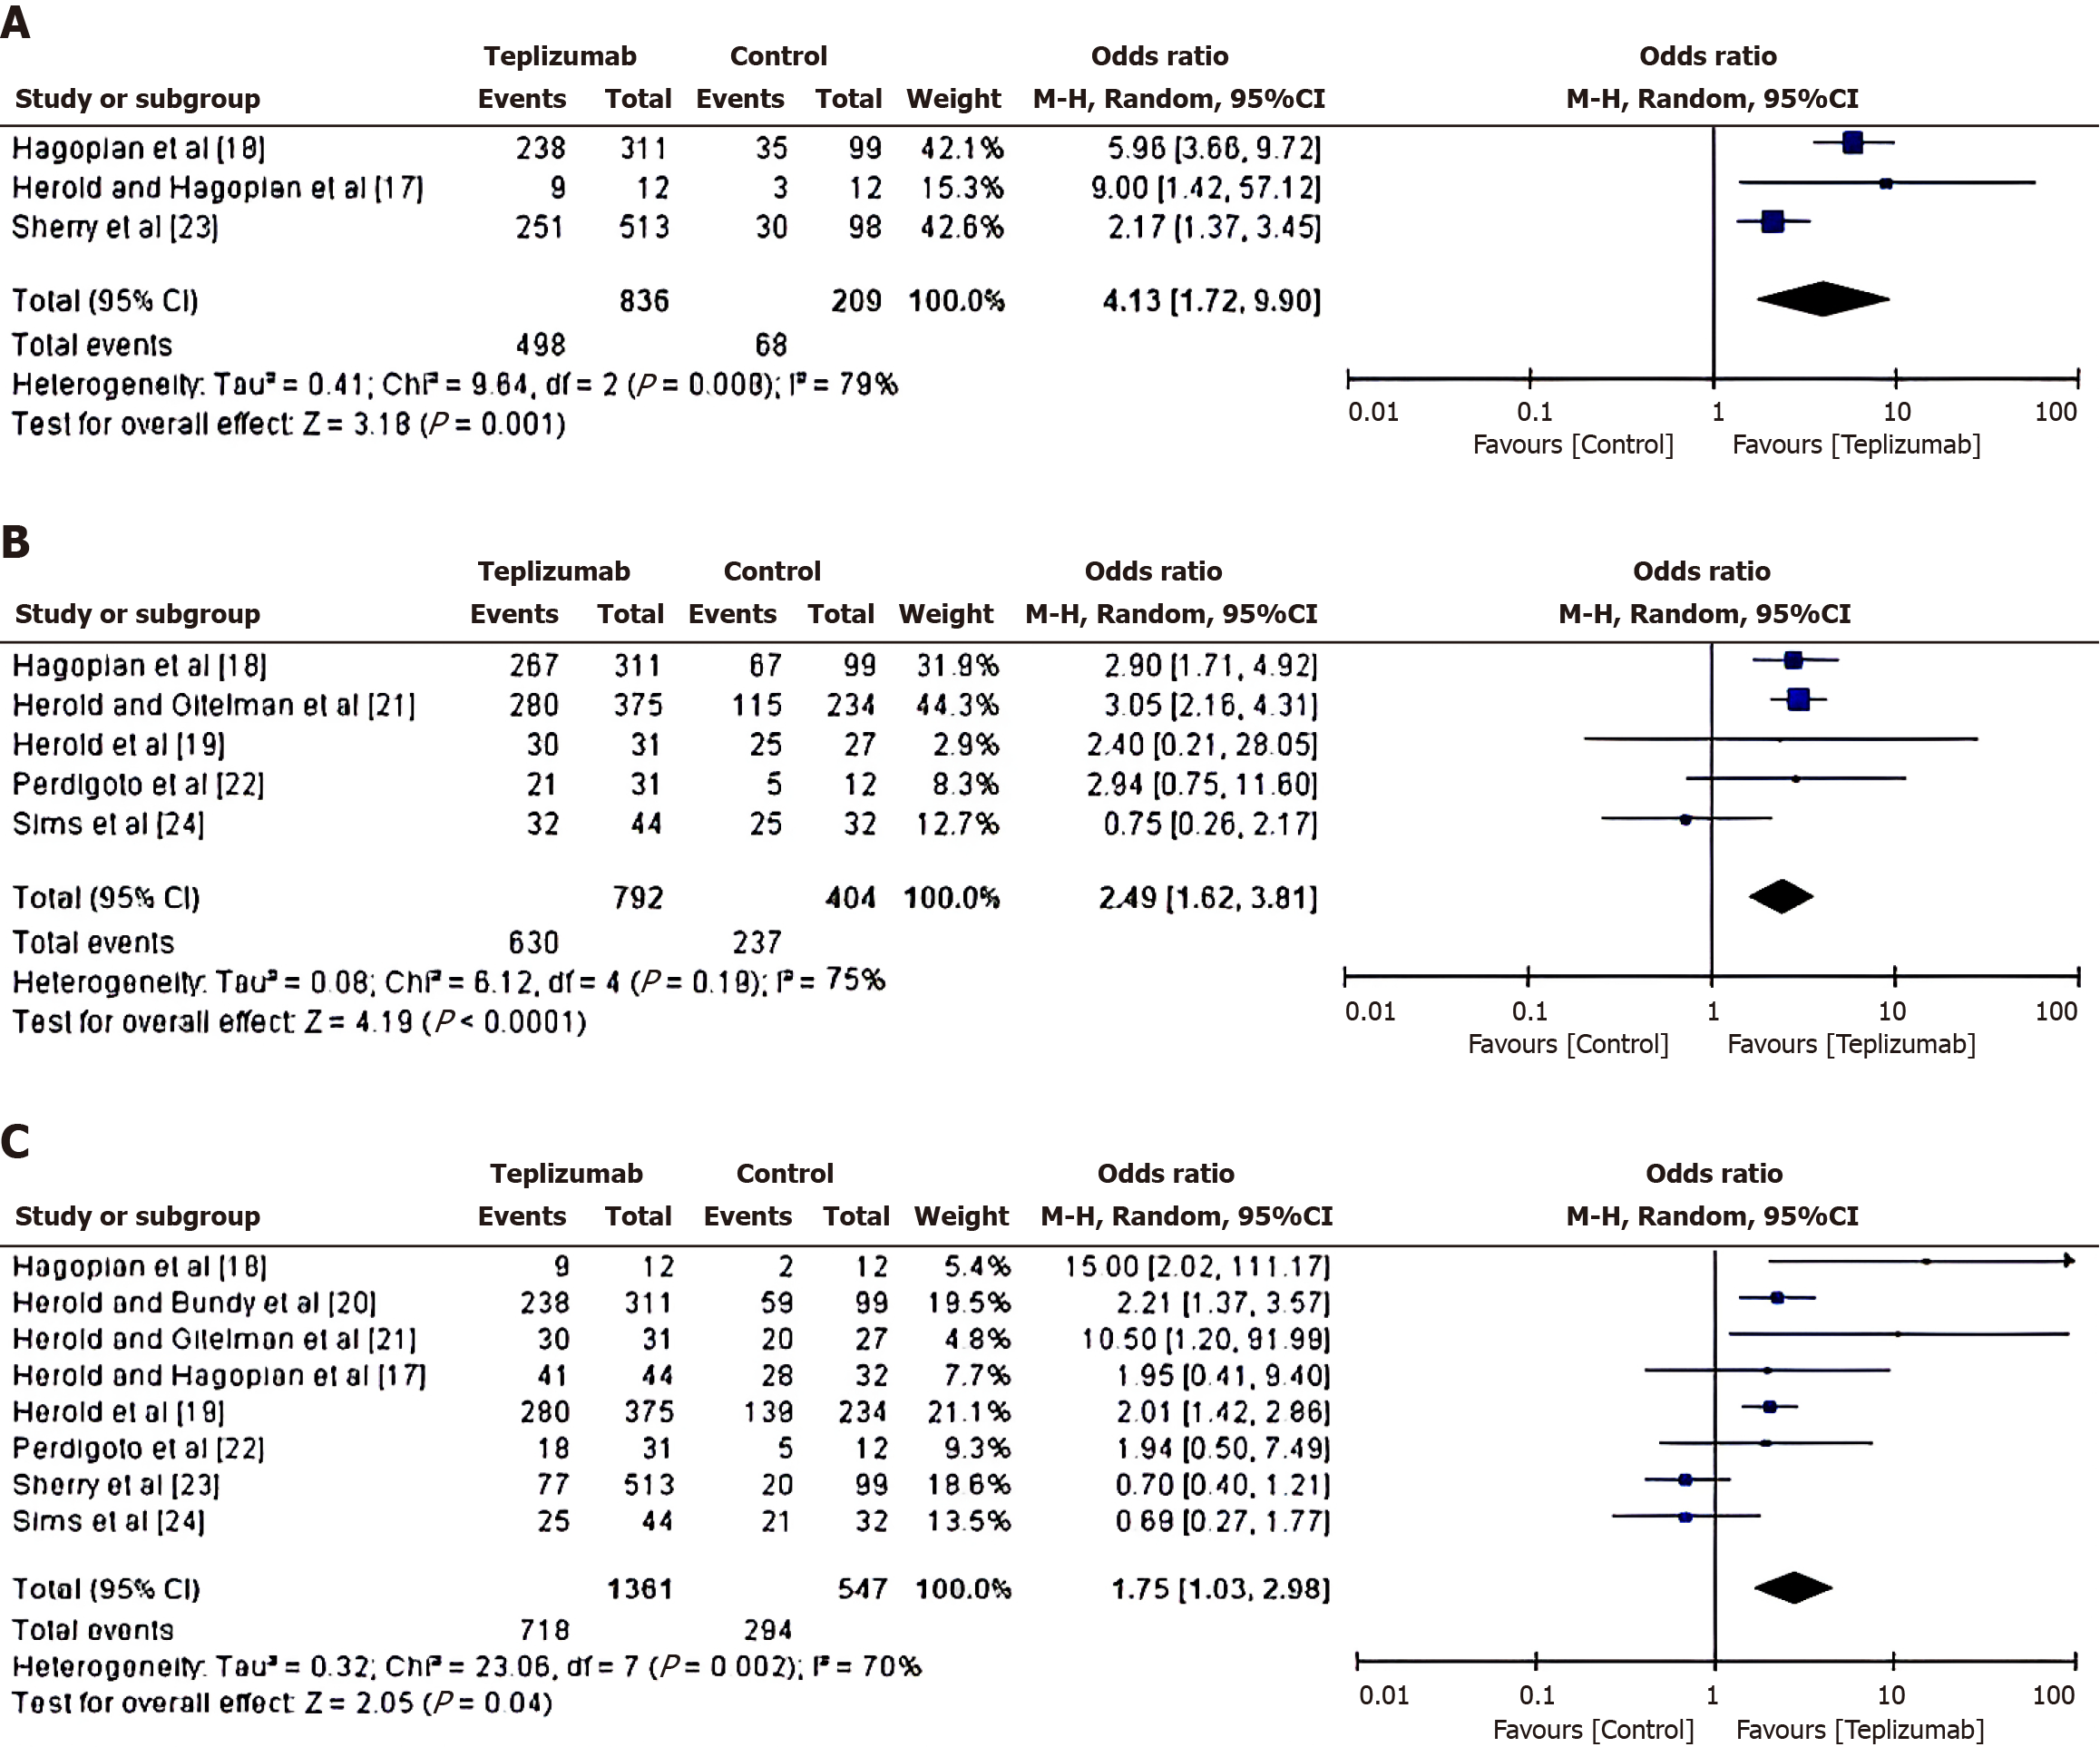
Figure 4 Forest plot for positive outcomes.
A: Reduction in insulin use; B: Change in C-peptide response; C: Change in glycated haemoglobin A1c level in Teplizumab versus control group. HbA1c: Glycated haemoglobin A1c; df: Degree of freedom; M-H: Mantel-Haenszel.
Figure 5 Forest plot for risk of adverse events in teplizumab vs control group.
df: Degree of freedom; M-H: Mantel-Haenszel.
Figure 6
Box and Whisker plot for comparative Glycaemic control in Teplizumab vs control group.
- Citation: Ma XL, Ge D, Hu XJ. Evaluation of teplizumab's efficacy and safety in treatment of type 1 diabetes mellitus: A systematic review and meta-analysis. World J Diabetes 2024; 15(7): 1615-1626
- URL: https://www.wjgnet.com/1948-9358/full/v15/i7/1615.htm
- DOI: https://dx.doi.org/10.4239/wjd.v15.i7.1615


