Copyright
©The Author(s) 2024.
World J Diabetes. Jul 15, 2024; 15(7): 1518-1530
Published online Jul 15, 2024. doi: 10.4239/wjd.v15.i7.1518
Published online Jul 15, 2024. doi: 10.4239/wjd.v15.i7.1518
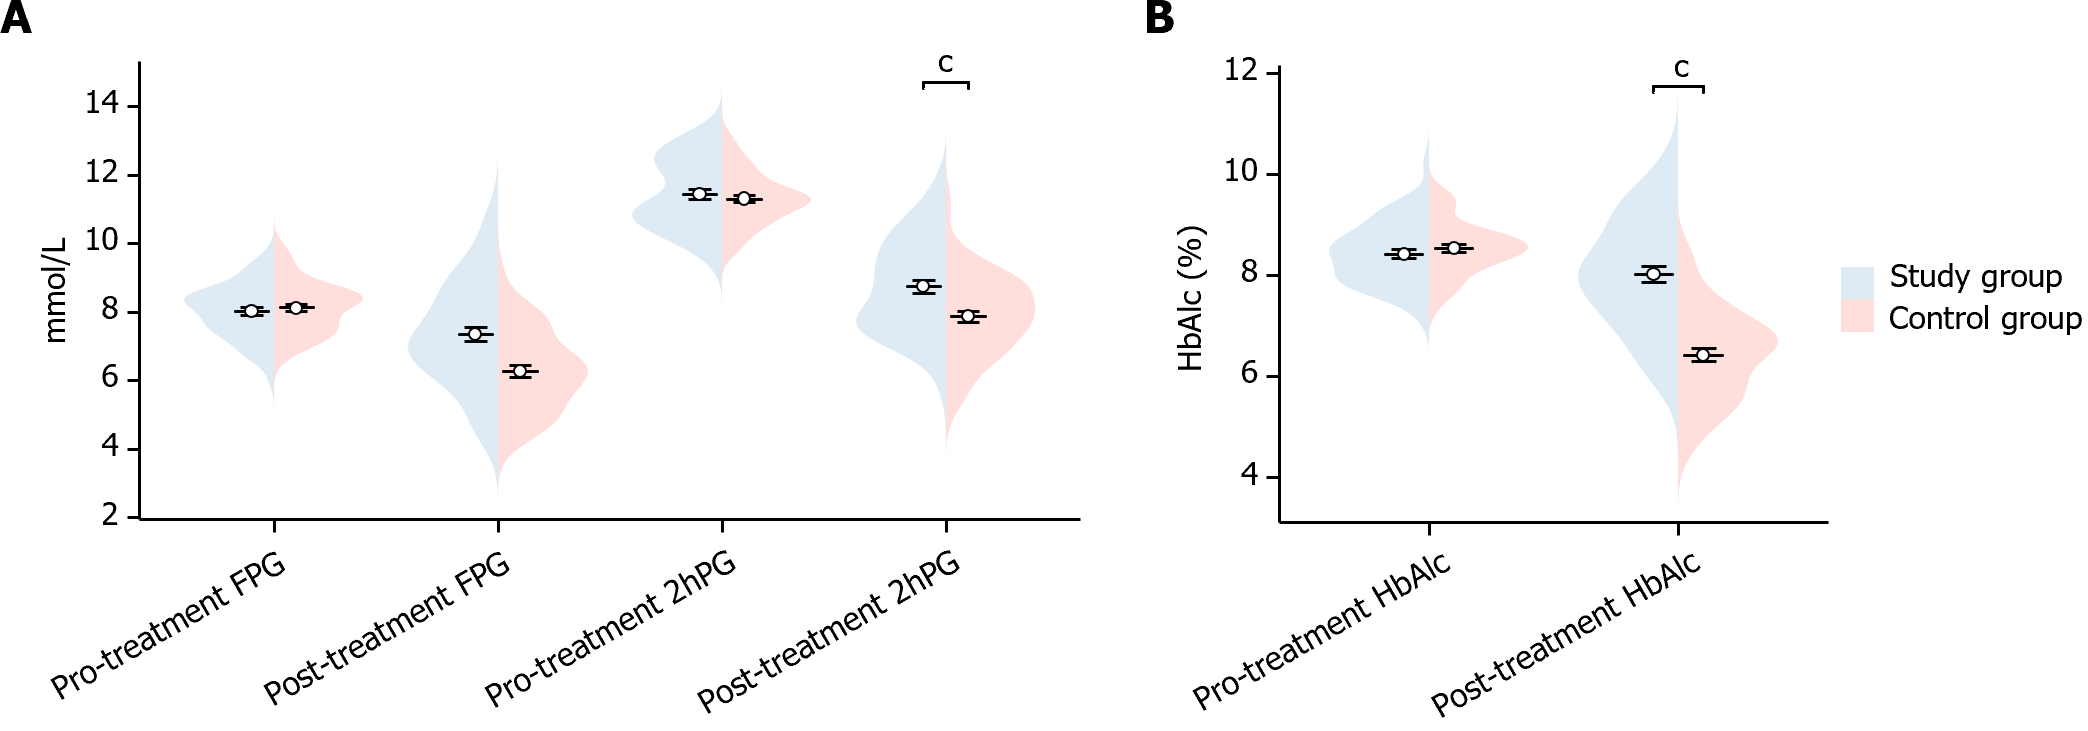
Figure 1 Comparison of glucose changes before and after treatment in two groups of patients.
A: The changes of fasting plasma glucose and 2-h postprandial blood glucose before and after treatment in the two groups; B: The changes of glycated hemoglobin before and after treatment in the two groups. cP < 0.001. 2hPG: 2-h postprandial blood glucose; FPG: Fasting plasma glucose; HbAlc: Glycated hemoglobin.
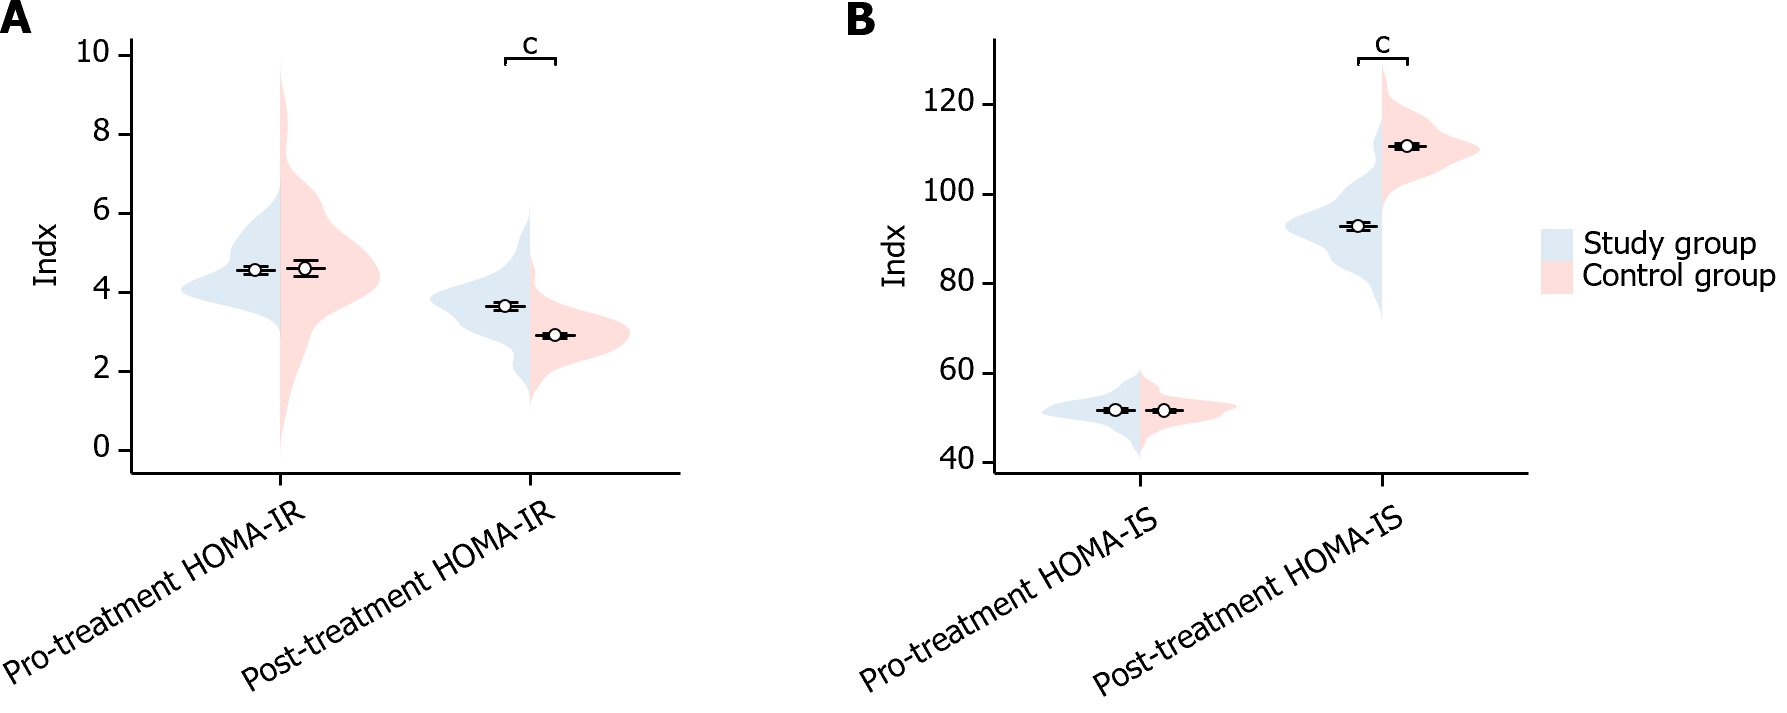
Figure 2 Comparison of insulin changes before and after treatment in two groups of patients.
A: The changes in insulin resistance index before and after treatment in both groups; B: The changes in beta-cell function index before and after treatment in the two groups. cP < 0.001. HOMA-IS: Beta-cell function index; HOMA-IR: Insulin resistance index.
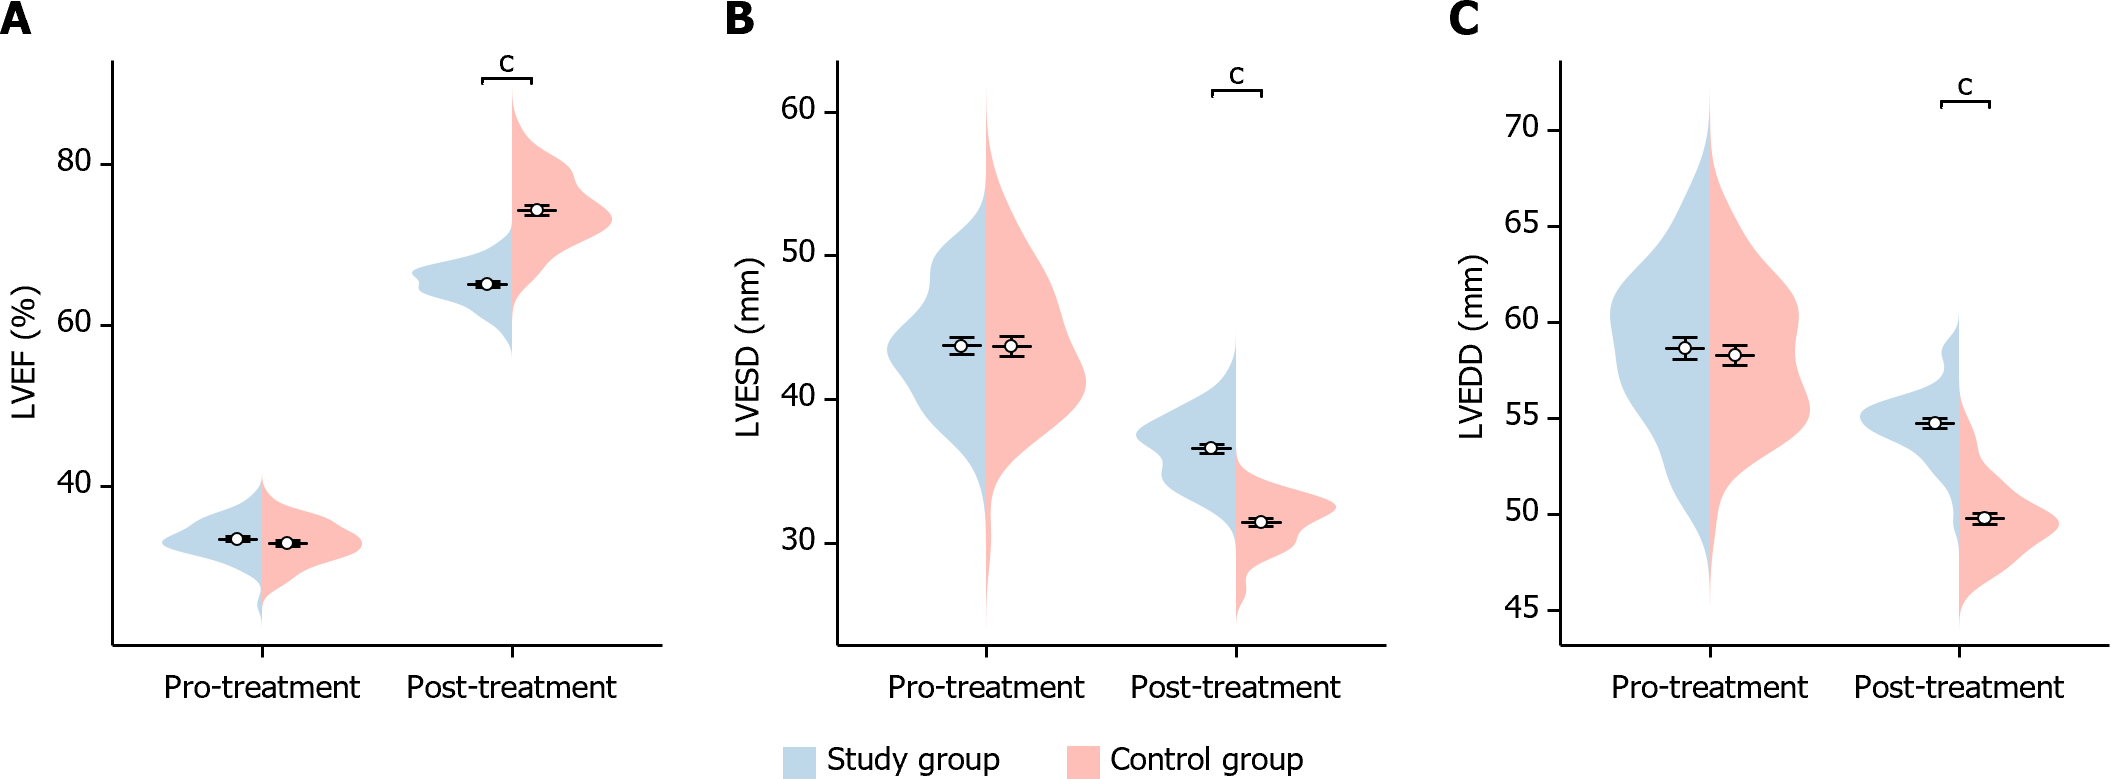
Figure 3 Comparison of changes in cardiac function before and after treatment in two groups of patients.
A: The changes in left ventricular ejection fraction before and after treatment in both groups; B: The changes in left ventricular end-systolic diameter before and after treatment in both groups; C: The changes in left ventricular end-diastolic diameter before and after treatment in the two groups of patients. cP < 0.001. LVEF: Left ventricular ejection fraction; LVEDD: Left ventricular end-diastolic diameter; LVESD: Left ventricular end-systolic diameter.
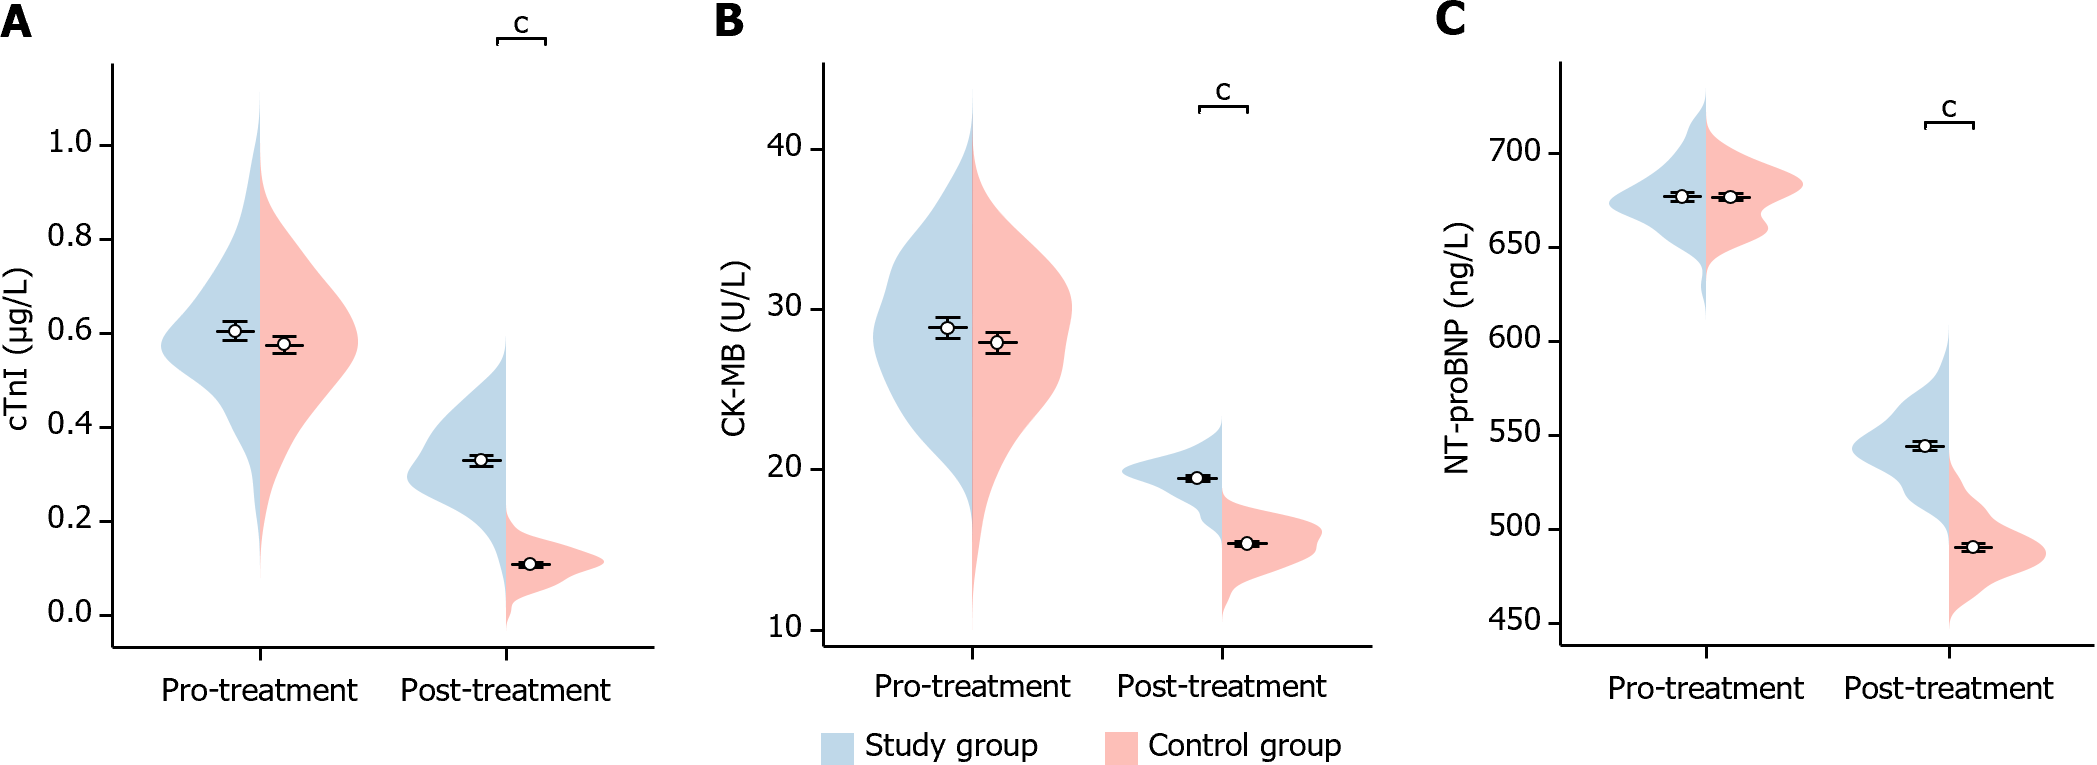
Figure 4 Comparison of changes in markers of myocardial infarction before and after treatment in two groups of patients.
A: The changes of cardiac troponin I before and after treatment in two groups of patients; B: The changes of Creatine Kinase-MB before and after treatment in the two groups; C: The changes of N-Terminal pro b-type Natriuretic Peptide Precursor before and after treatment in the two groups. cP < 0.001. cTnI: Cardiac troponin I; CK-MB: Creatine Kinase-MB; NT-proBNP: N-Terminal pro b-type Natriuretic Peptide Precursor.
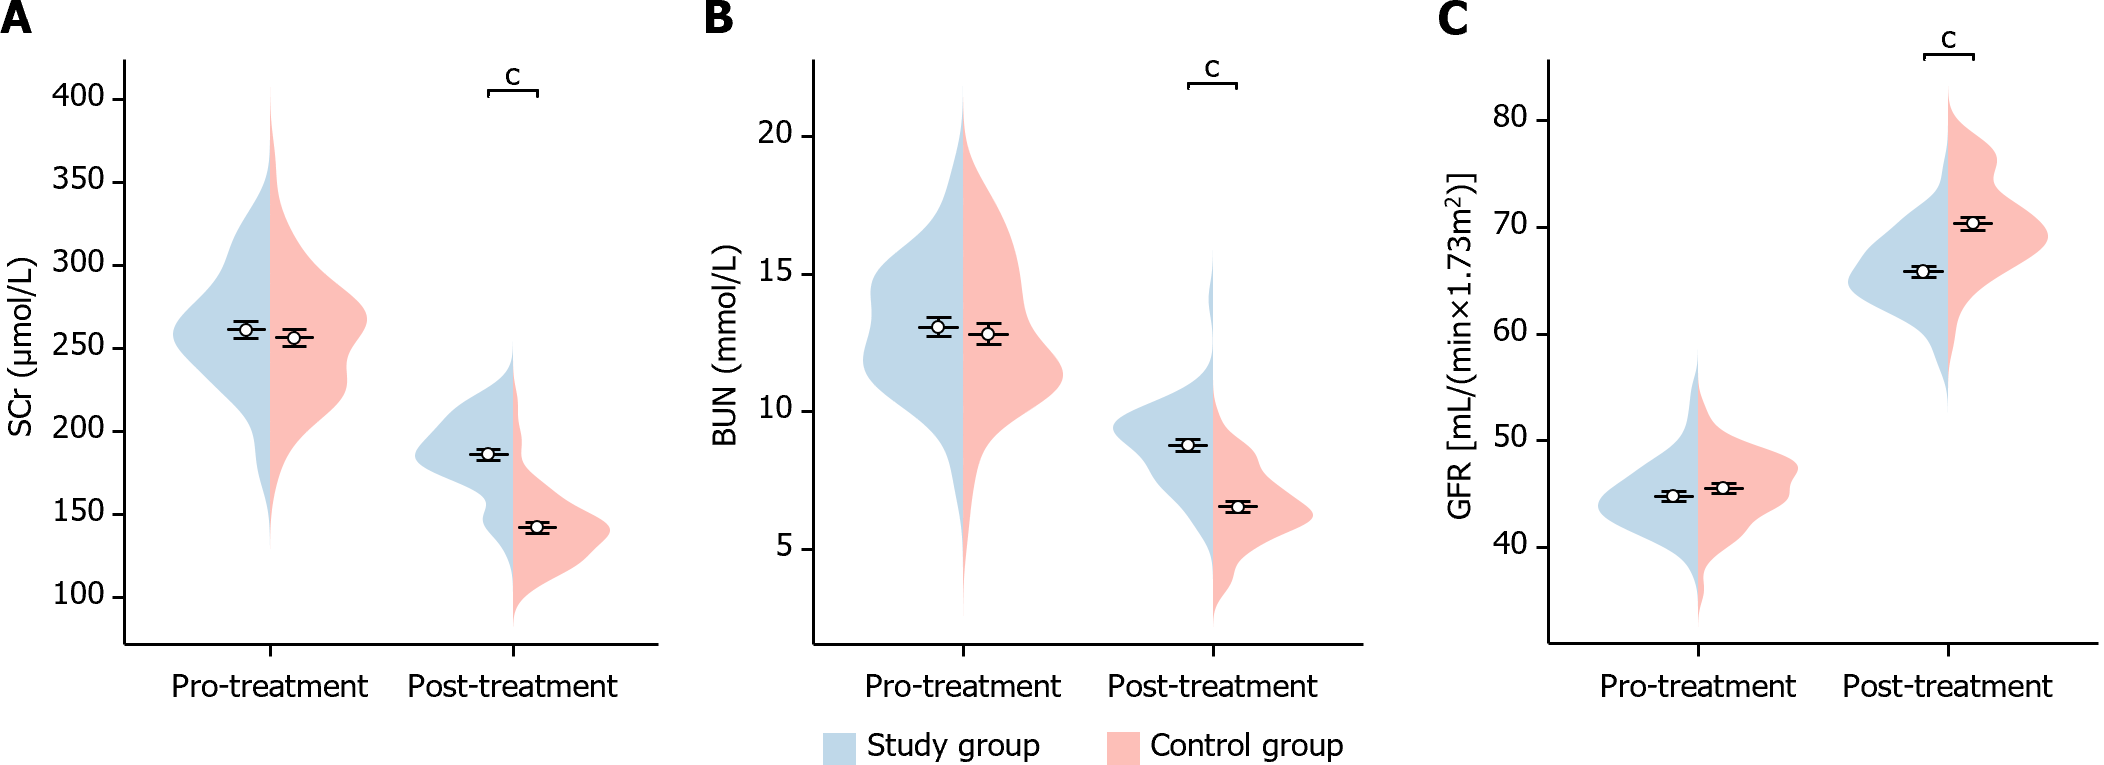
Figure 5 Comparison of changes in renal function before and after treatment in the two groups of patients.
A: The changes in serum creatinine before and after treatment in the two groups; B: The changes in blood urea nitrogen before and after treatment in both groups; C: The changes in glomerular filtration rate before and after treatment in the two groups. cP < 0.001. Scr: Serum creatinine; BUN: Blood urea nitrogen; GFR: Glomerular filtration rate.
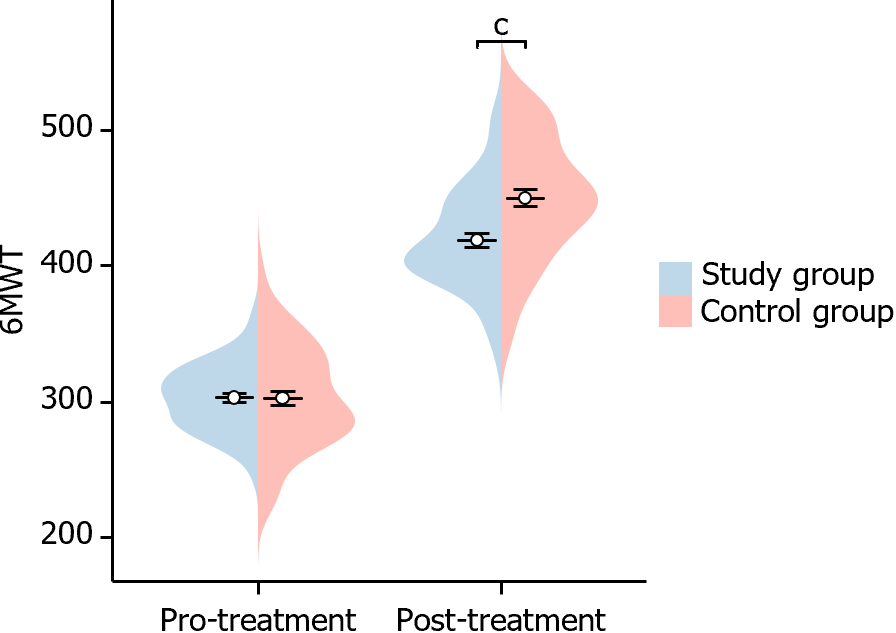
Figure 6 The comparison of 6-min walking test before and after treatment between the two groups.
cP < 0.001. 6MWT: 6-min walking test.
- Citation: Yu PL, Yu Y, Li S, Mu BC, Nan MH, Pang M. Dapagliflozin in heart failure and type 2 diabetes: Efficacy, cardiac and renal effects, safety. World J Diabetes 2024; 15(7): 1518-1530
- URL: https://www.wjgnet.com/1948-9358/full/v15/i7/1518.htm
- DOI: https://dx.doi.org/10.4239/wjd.v15.i7.1518


