Copyright
©The Author(s) 2024.
World J Diabetes. Jul 15, 2024; 15(7): 1489-1498
Published online Jul 15, 2024. doi: 10.4239/wjd.v15.i7.1489
Published online Jul 15, 2024. doi: 10.4239/wjd.v15.i7.1489
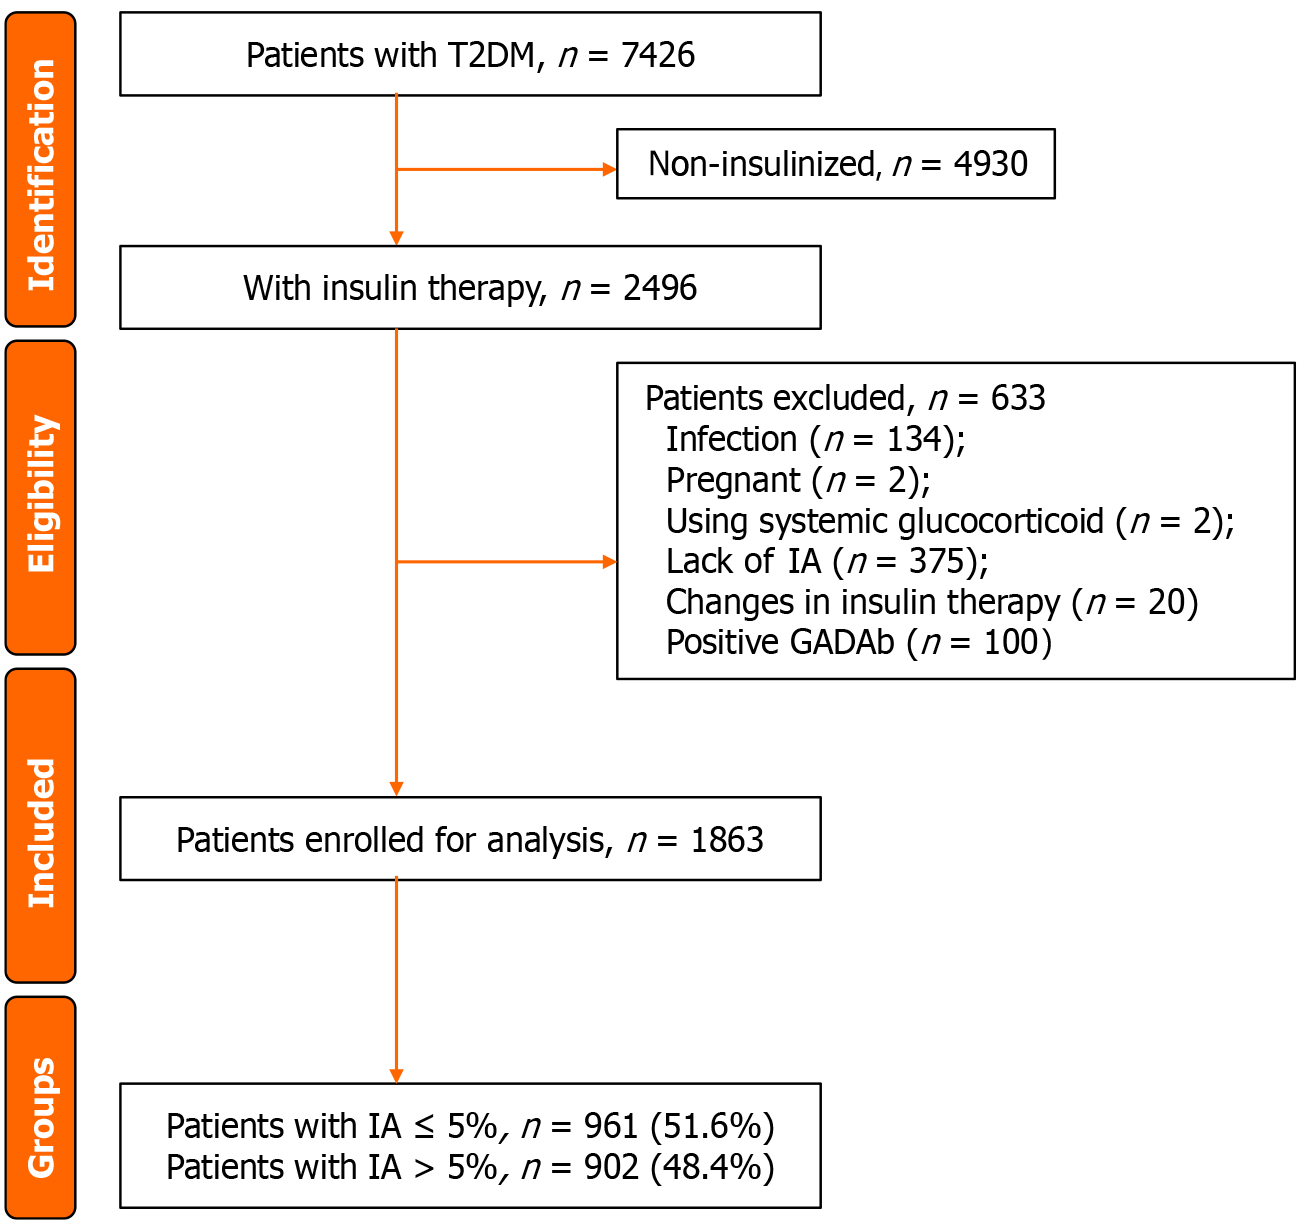
Figure 1 Flow diagram of patient screening.
T2DM: Type 2 diabetes; IA: Insulin antibody; GADAb: Glutamic acid decarboxylase antibody.
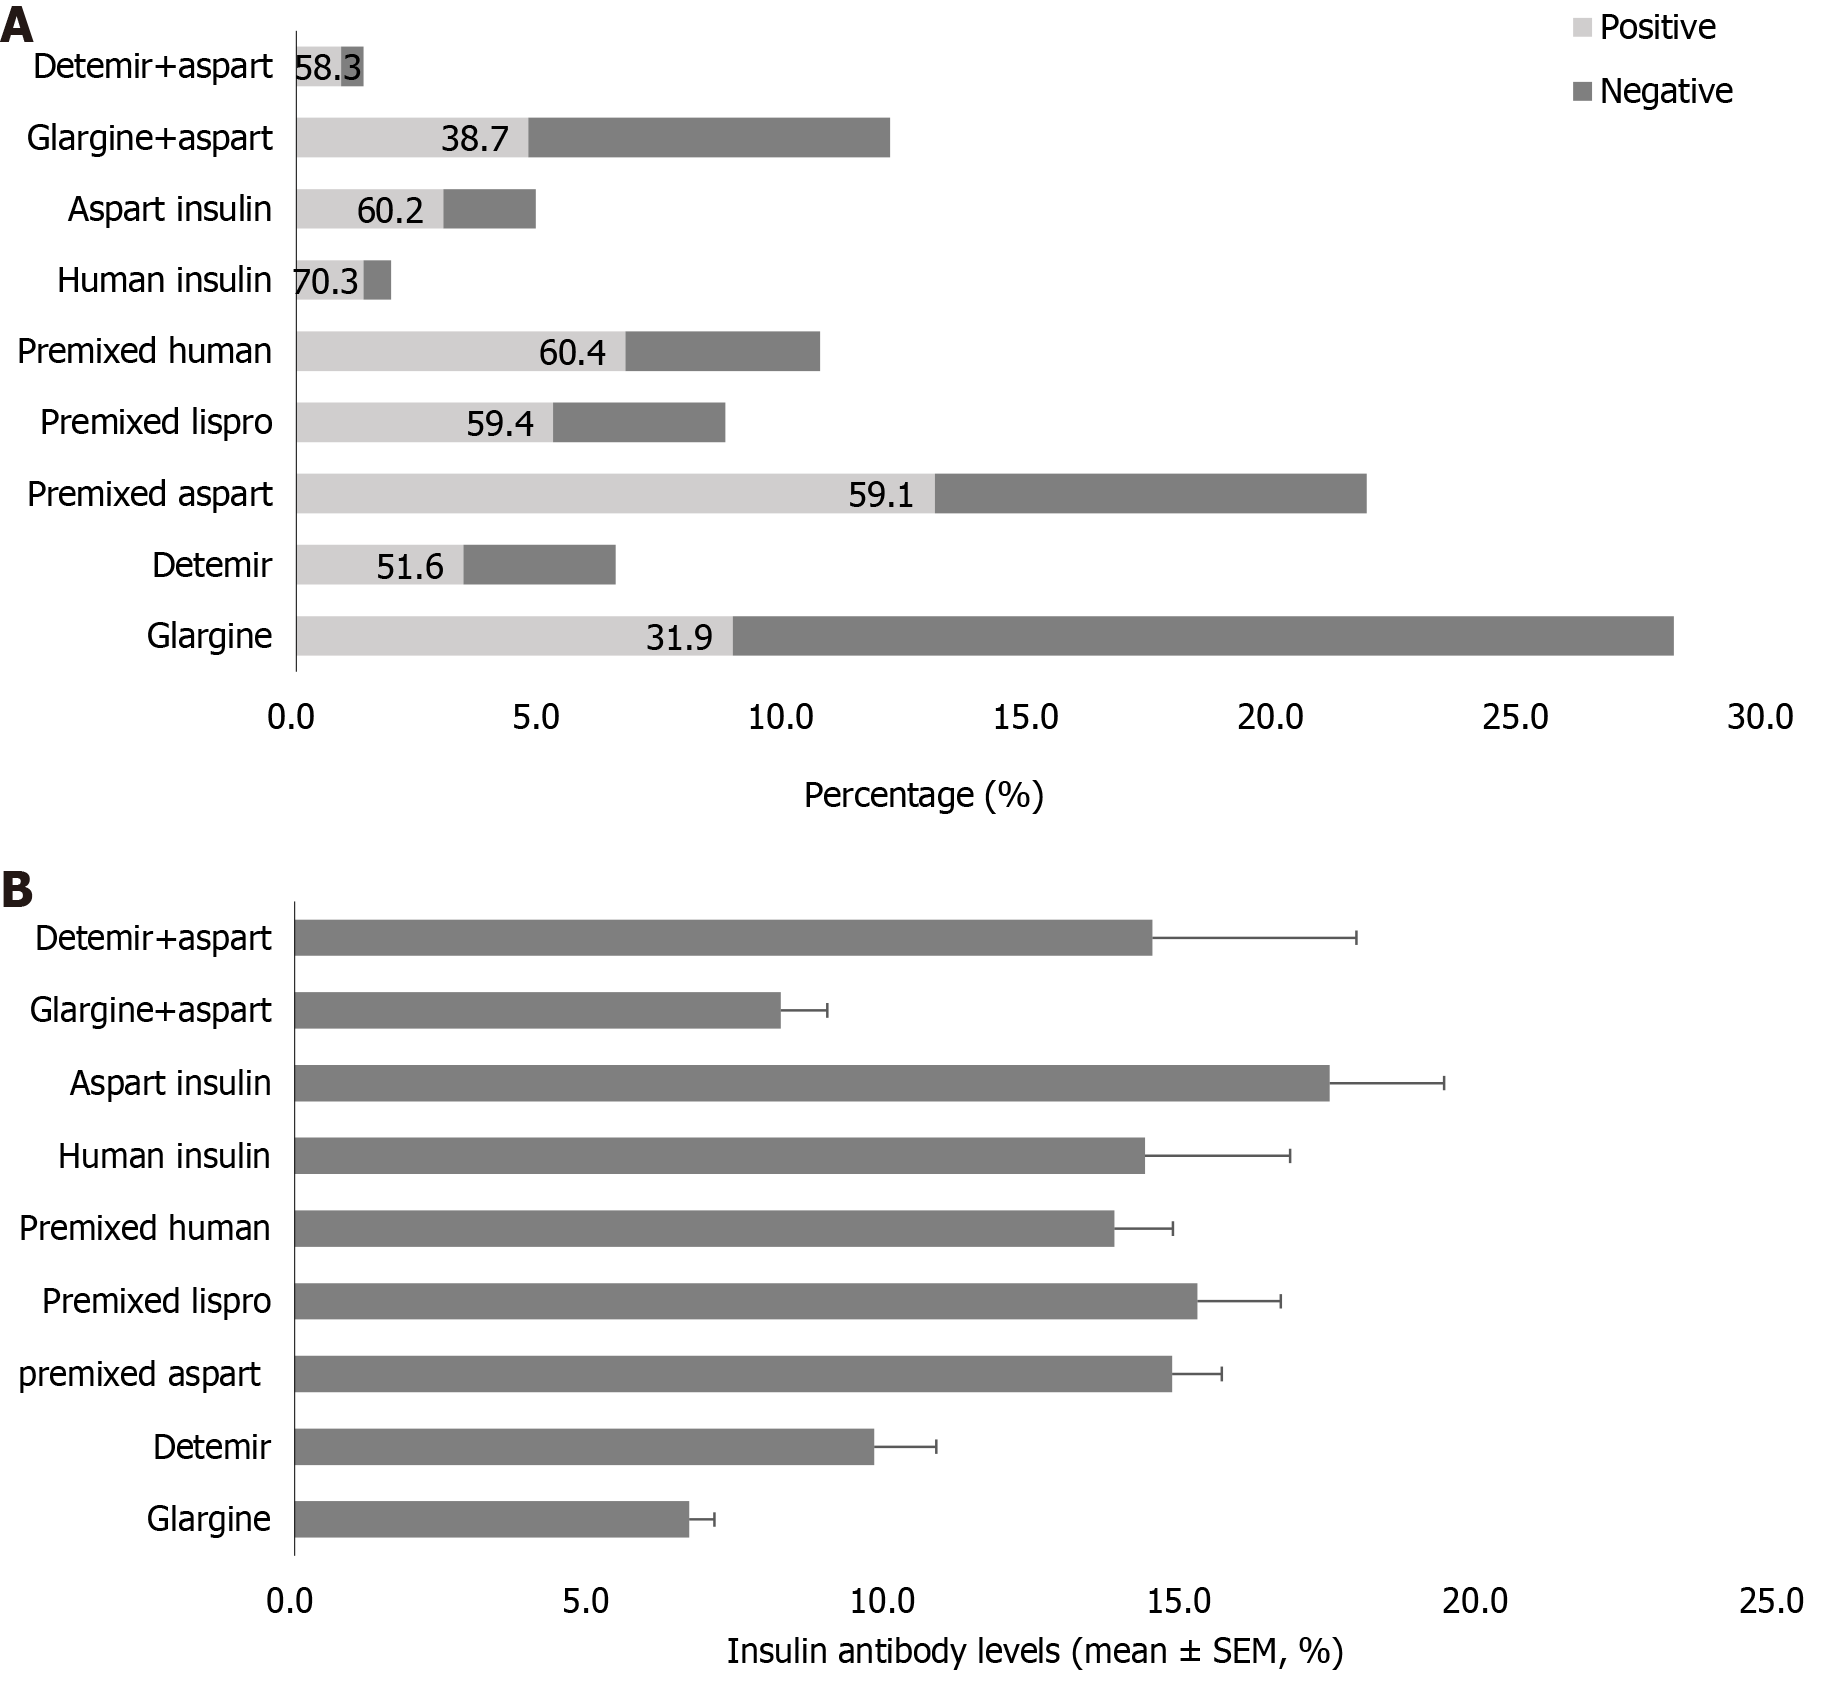
Figure 2 Insulin antibody levels in patients using different insulin regimens.
A: Percentage of patients using different insulin regimens, and the proportion of positive insulin antibodies (IAs) in patients using different insulin regimens; B: IA levels in patients using different insulin regimens. SEM: Standard error of the mean.
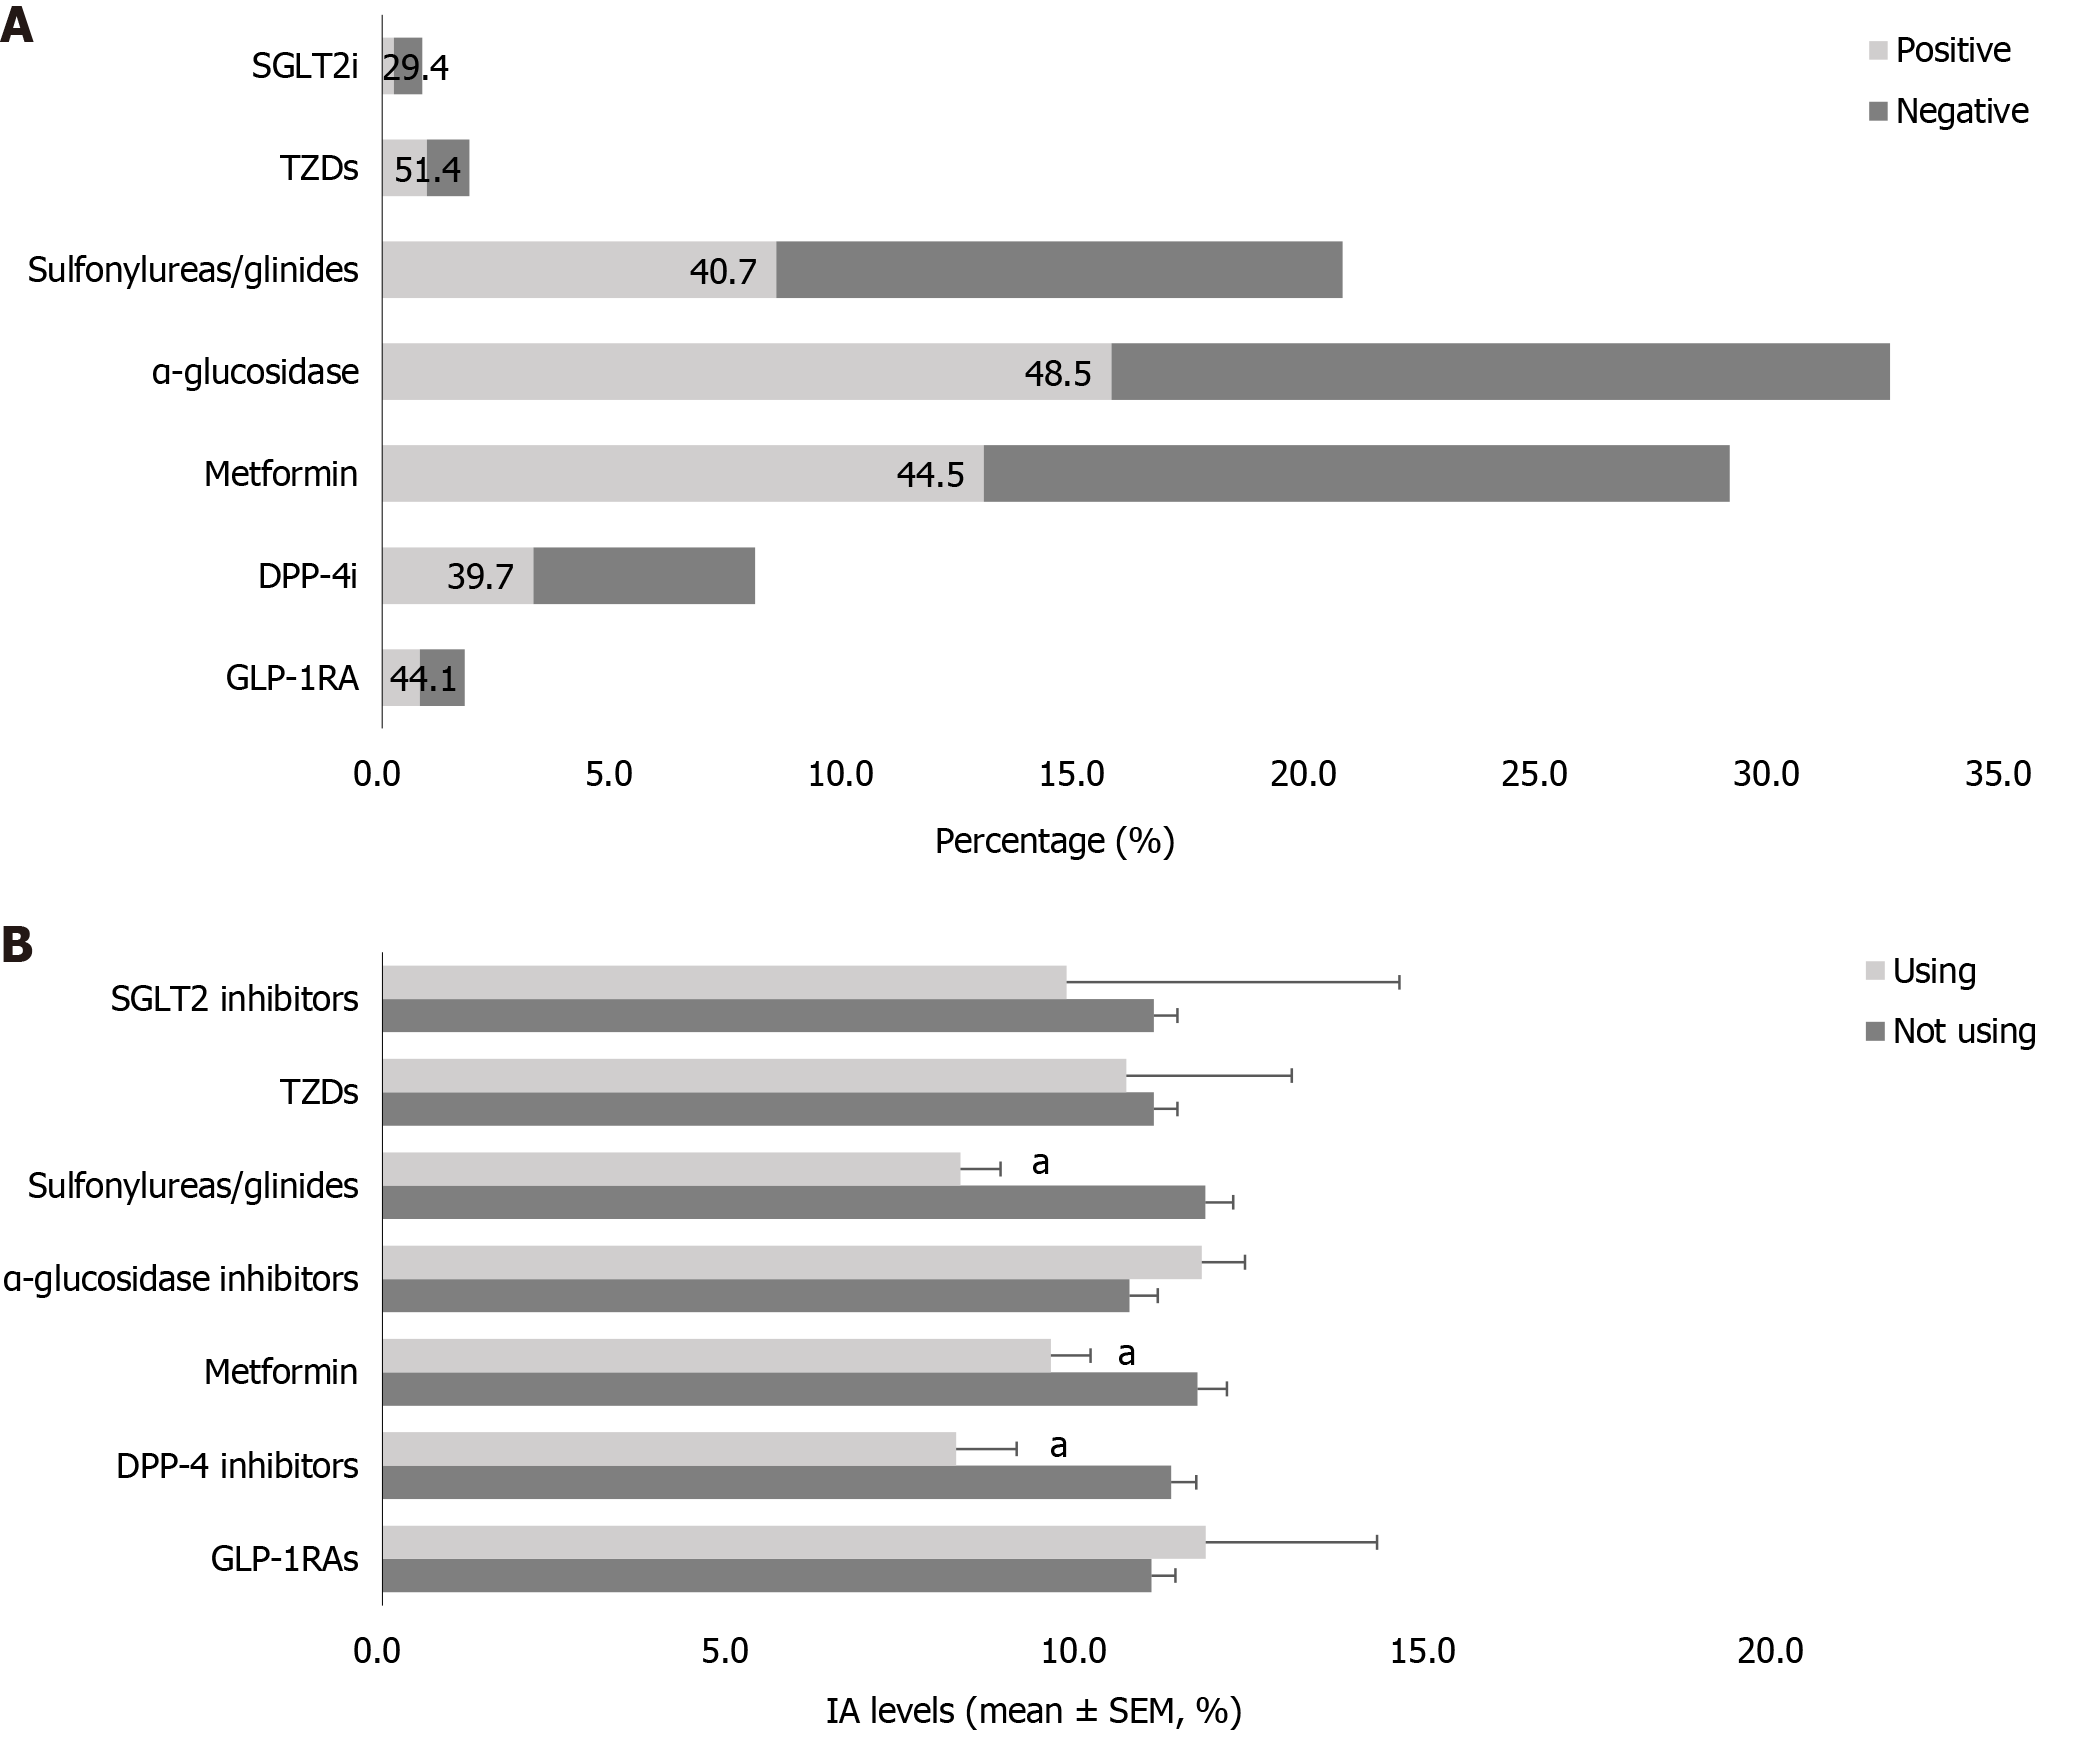
Figure 3 Insulin antibody levels in patients using different oral hypoglycemic agents and glucagon-like peptide 1 receptor agonists.
A: Proportion of patients using different oral hypoglycemic agents and the rate of positive insulin antibodies (IAs) in patients using different drugs; B: IA levels in patients using different oral hypoglycemic agents and glucagon-like peptide 1 receptor agonists. aP < 0.01 vs patients not using the drug. SGLT2i: Sodium-dependent glucose transporters 2 inhibitors; TZDs: Thiazolidinediones; DPP-4i: Dipeptidyl peptidase-4 inhibitors; GLP-1RAs: Glucagon-like peptide 1 receptor agonists.
- Citation: Zhang P, Jiang Q, Ding B, Yan RN, Hu Y, Ma JH. Association between glucose-lowering drugs and circulating insulin antibodies induced by insulin therapy in patients with type 2 diabetes. World J Diabetes 2024; 15(7): 1489-1498
- URL: https://www.wjgnet.com/1948-9358/full/v15/i7/1489.htm
- DOI: https://dx.doi.org/10.4239/wjd.v15.i7.1489


