Copyright
©The Author(s) 2024.
World J Diabetes. Jul 15, 2024; 15(7): 1477-1488
Published online Jul 15, 2024. doi: 10.4239/wjd.v15.i7.1477
Published online Jul 15, 2024. doi: 10.4239/wjd.v15.i7.1477
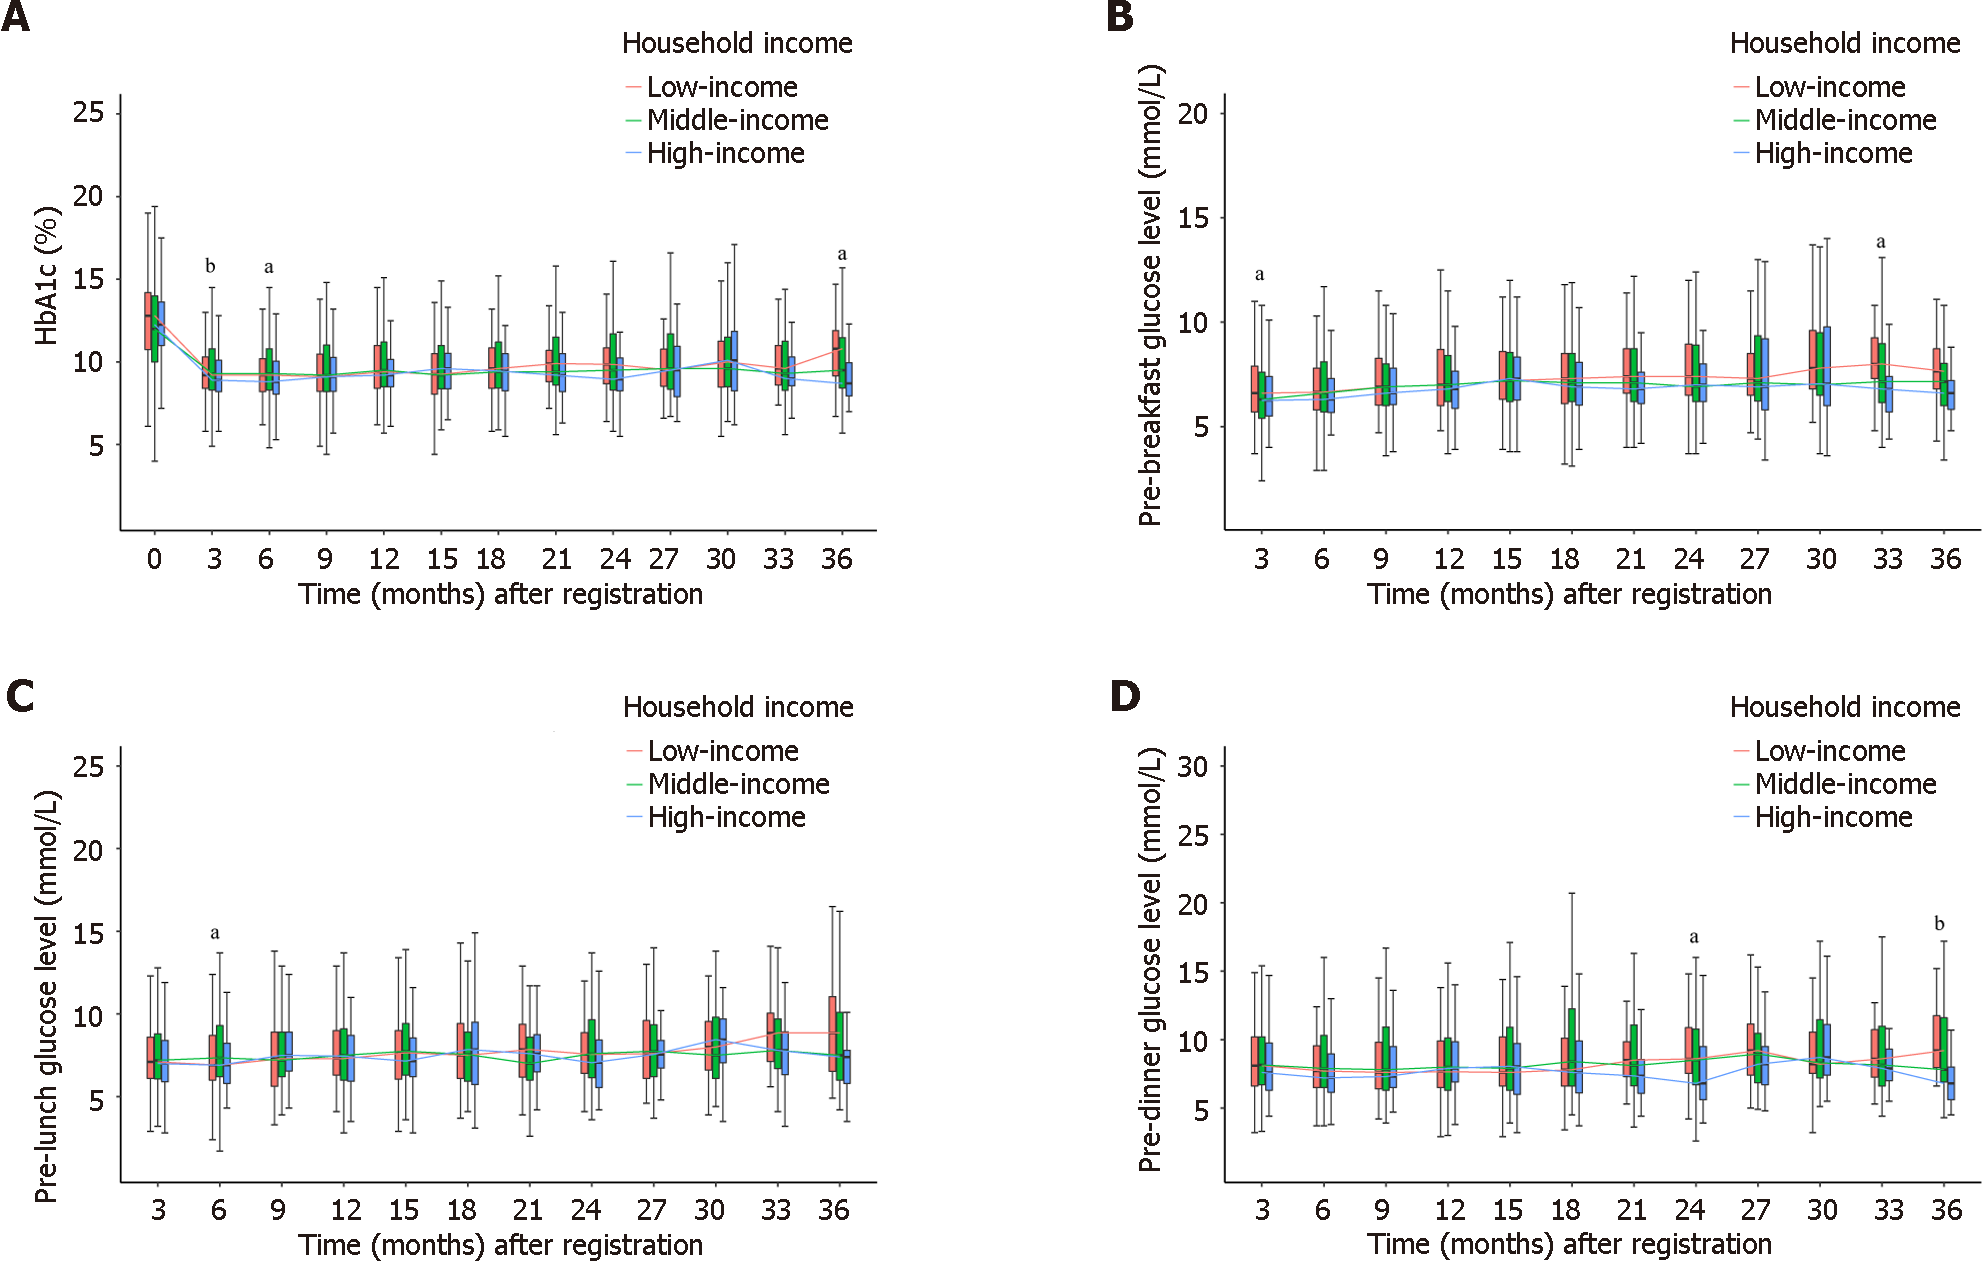
Figure 1 Comparison of hemoglobin A1c and preprandial blood glucose level: Low vs middle vs high household income groups.
A: Comparison of hemoglobin A1c level among three groups; B: Comparison of pre-breakfast blood glucose level among three groups; C: Comparison of pre-lunch blood glucose level among three groups; D: Comparison of pre-dinner blood glucose level among three groups. aP < 0.05; bP < 0.01. HbA1c: Hemoglobin A1c.
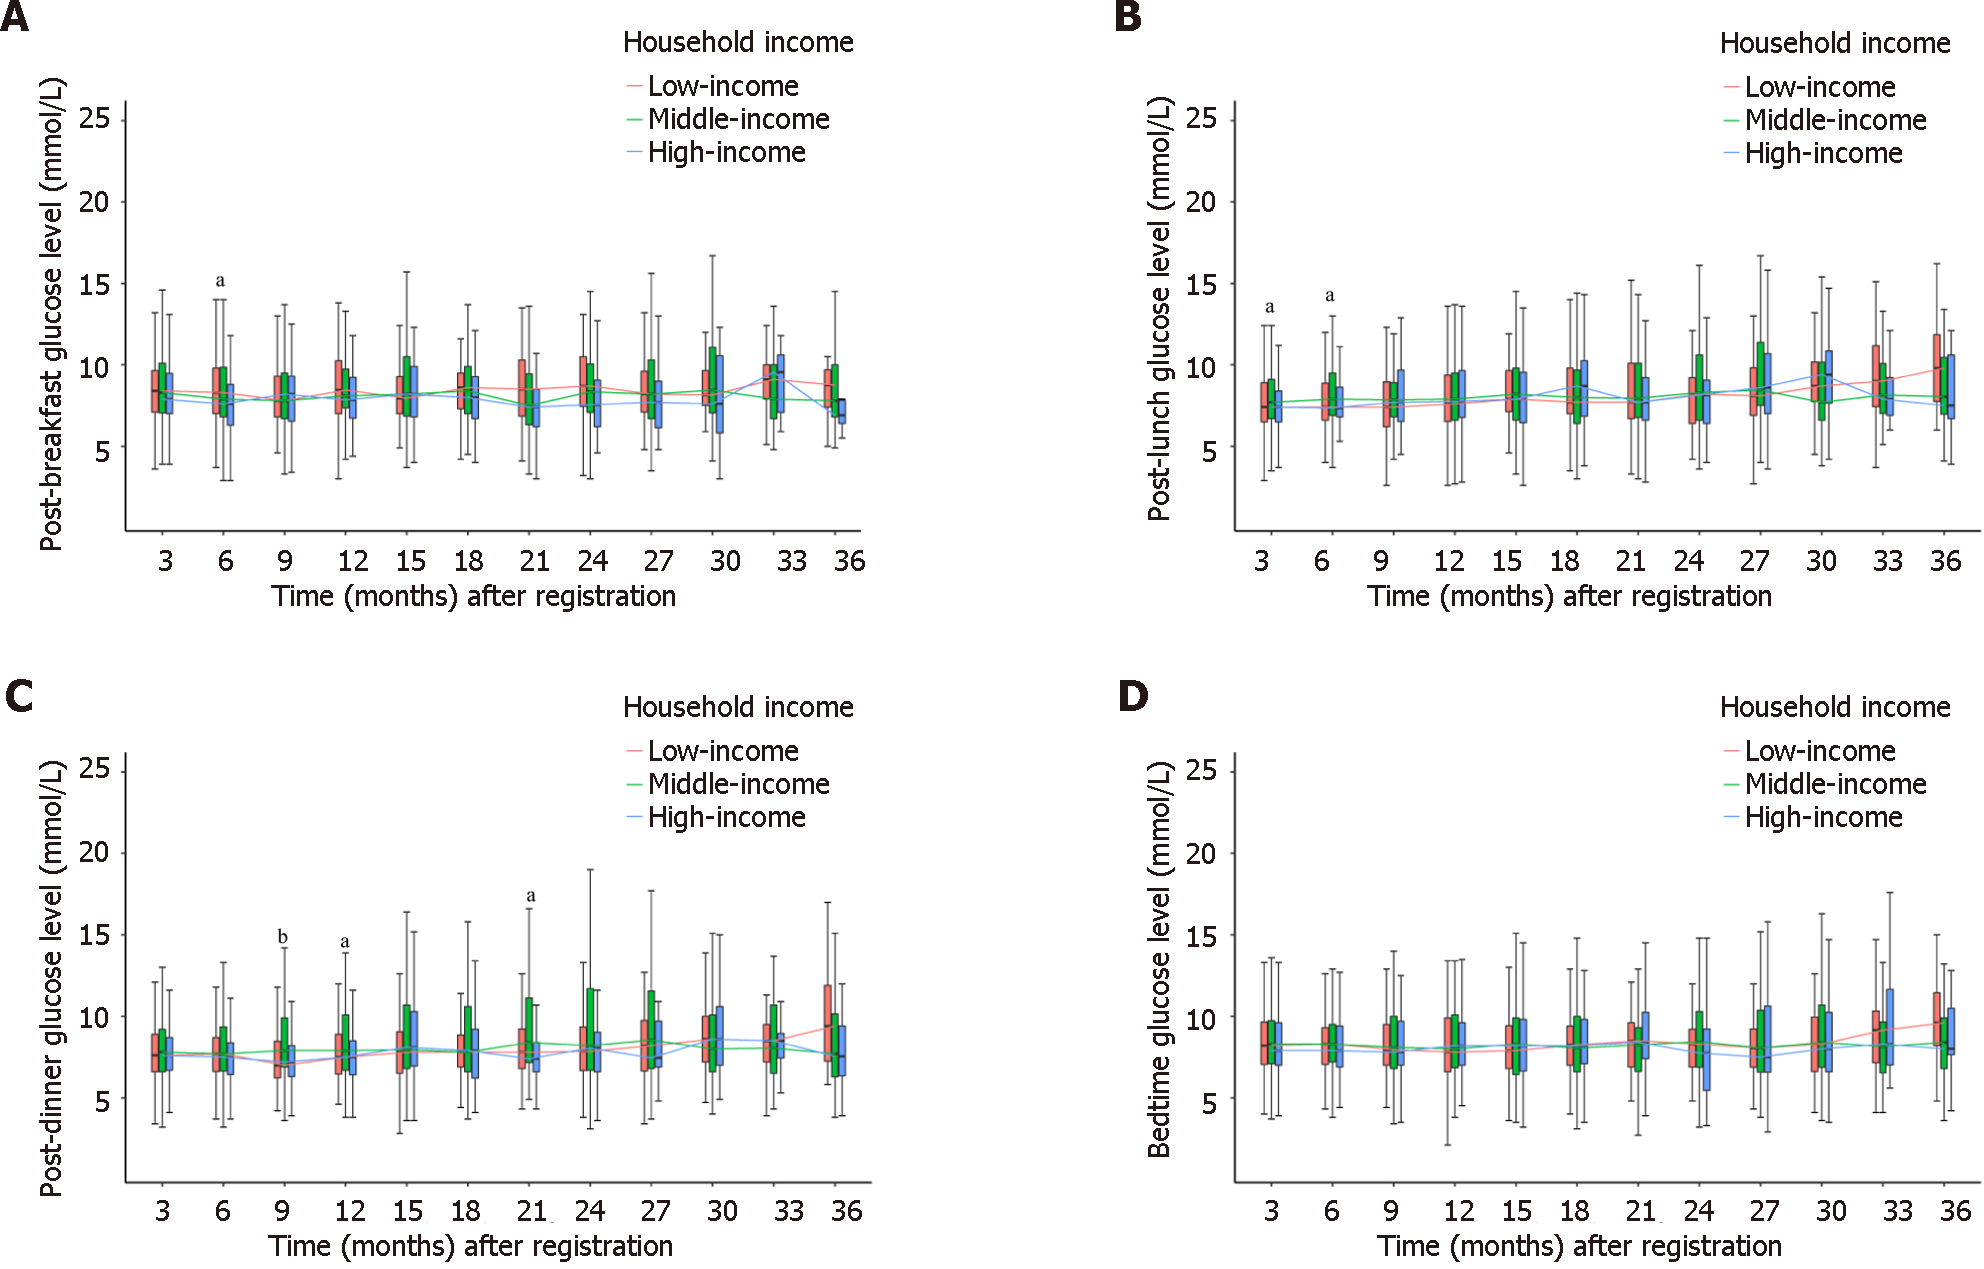
Figure 2 Comparison of postprandial and bedtime blood glucose level: Low vs Middle vs High household income groups.
A: Comparison of post-breakfast 2 h blood glucose level among three groups; B: Comparison of post-lunch 2 h blood glucose level among three groups; C: Comparison of post-dinner 2 h blood glucose level among three groups; D: Comparison of bedtime blood glucose level among three groups. aP < 0.05; bP < 0.01. HbA1c: Hemoglobin A1c.
- Citation: Zhang WH, Wang CF, Wang H, Tang J, Zhang HQ, Zhu JY, Zheng XY, Luo SH, Ding Y. Association between glucose levels of children with type 1 diabetes and parental economic status in mobile health application. World J Diabetes 2024; 15(7): 1477-1488
- URL: https://www.wjgnet.com/1948-9358/full/v15/i7/1477.htm
- DOI: https://dx.doi.org/10.4239/wjd.v15.i7.1477


