Copyright
©The Author(s) 2024.
World J Diabetes. Jun 15, 2024; 15(6): 1291-1298
Published online Jun 15, 2024. doi: 10.4239/wjd.v15.i6.1291
Published online Jun 15, 2024. doi: 10.4239/wjd.v15.i6.1291
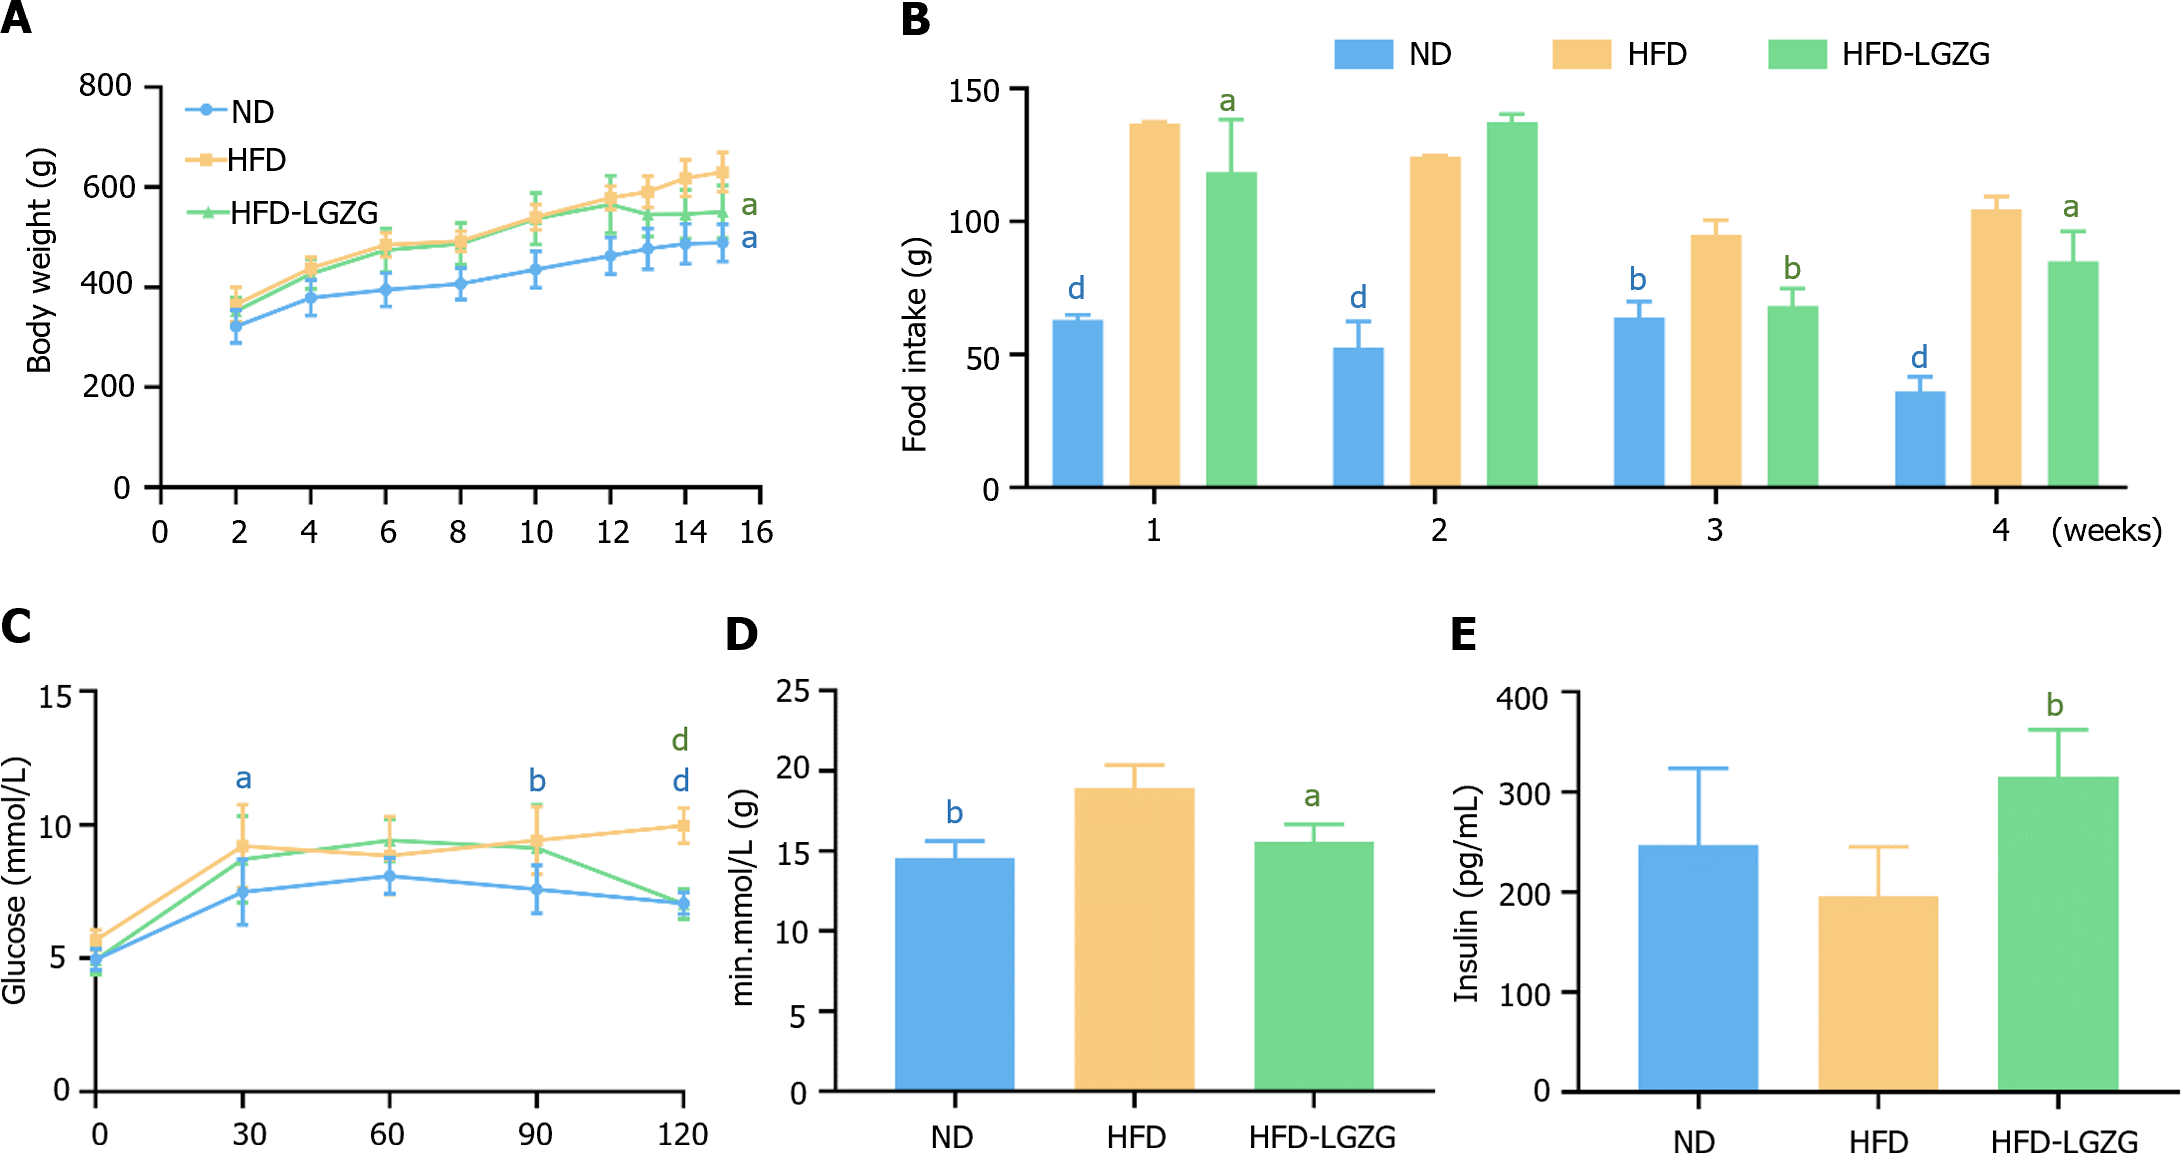
Figure 1 The effects of Lingguizhugan on rats with high-fat diet-induced insulin resistance were analyzed through various measurements.
A: Weekly body weight curves were recorded; B: Weekly food intake was monitored; C: Blood glucose levels were measured during the oral glucose tolerance test (OGTT); D: The area under the OGTT curve was calculated; E: Fasting plasma insulin levels were determined. The data are presented as the mean ± SD (n = 6-10 for each group) and were corrected using the spherical test. Statistical significance was indicated as aP < 0.05, bP < 0.01, dP < 0.0001 vs the high-fat diet group. ND: Normal diet; HFD: High-fat diet; LGZG: Lingguizhugan.
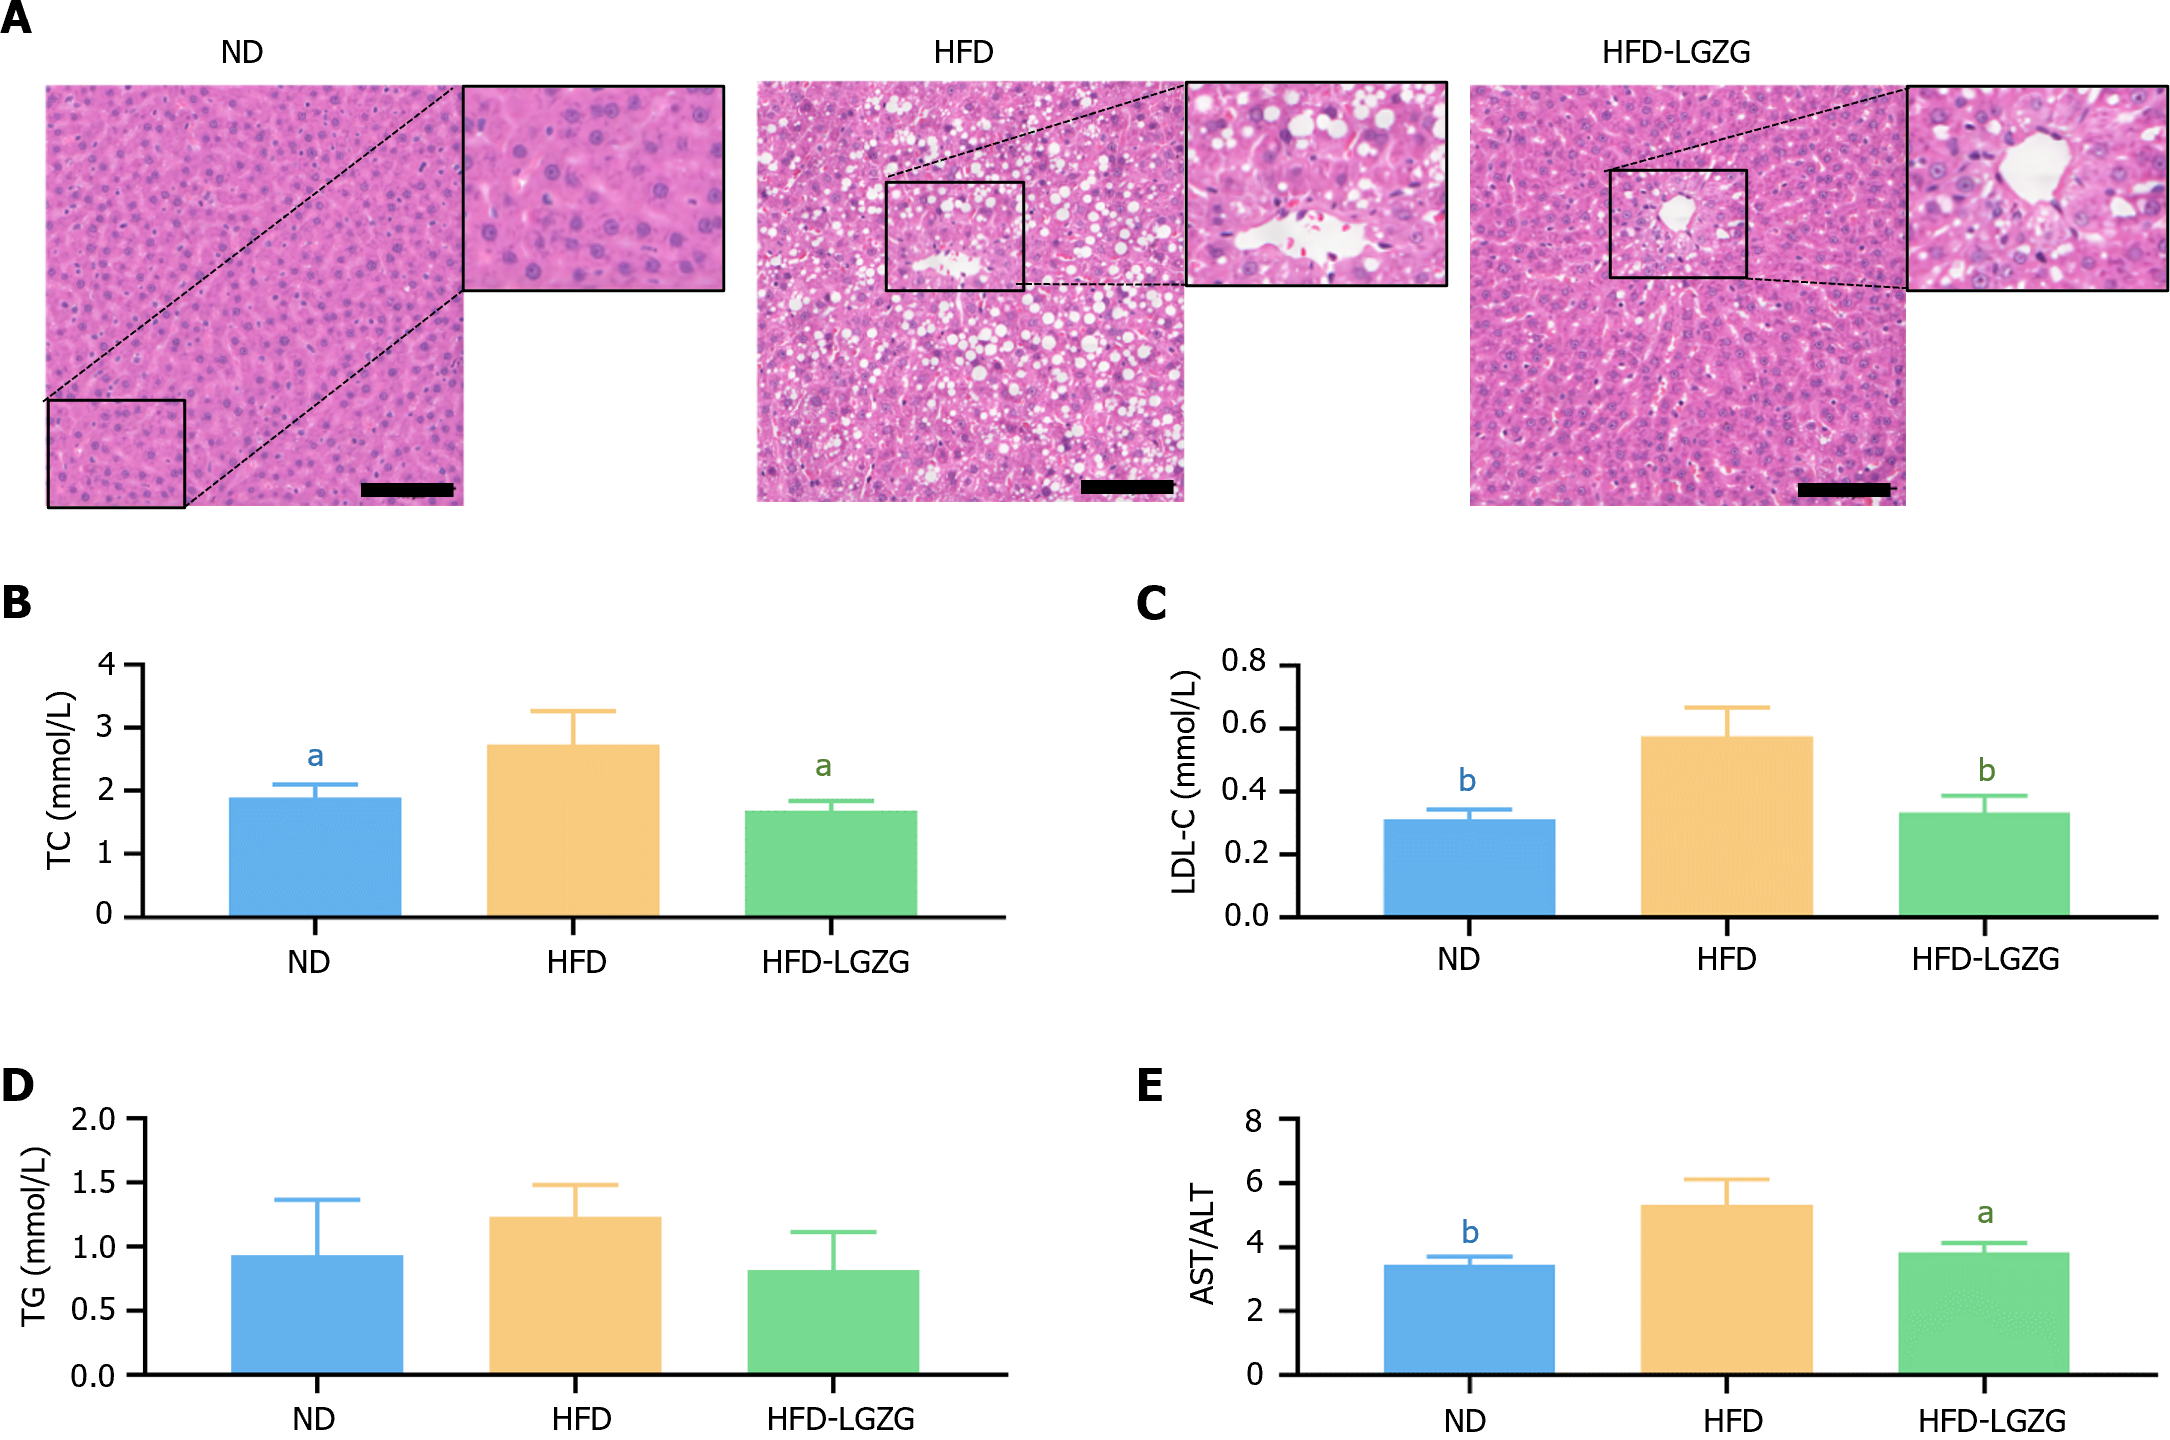
Figure 2 Lingguizhugan treatment significantly reduces hepatic steatosis in rats.
A: Liver sections stained with H&E showed decreased fat accumulation in rats administered Lingguizhugan compared to high-fat diet (HFD)-fed rats (scale bar, 100 μm); B: Triglyceride; C: Total cholesterol; D: Low-density lipoprotein cholesterol E: Aspartate aminotransferase/alanine aminotransferase ratio were measured. The data are presented as the mean ± SD (n = 5 for each group) and were analyzed using a spherical test. Statistical comparisons were made compared to the HFD group, aP < 0.05, bP < 0.01. ND: Normal diet; HFD: High-fat diet; LGZG: Lingguizhugan; TC: Total cholesterol; TG: Triglyceride; LDL-C: Low-density lipoprotein cholesterol; AST: Aspartate aminotransferase; ALT: Alanine aminotransferase ratio.
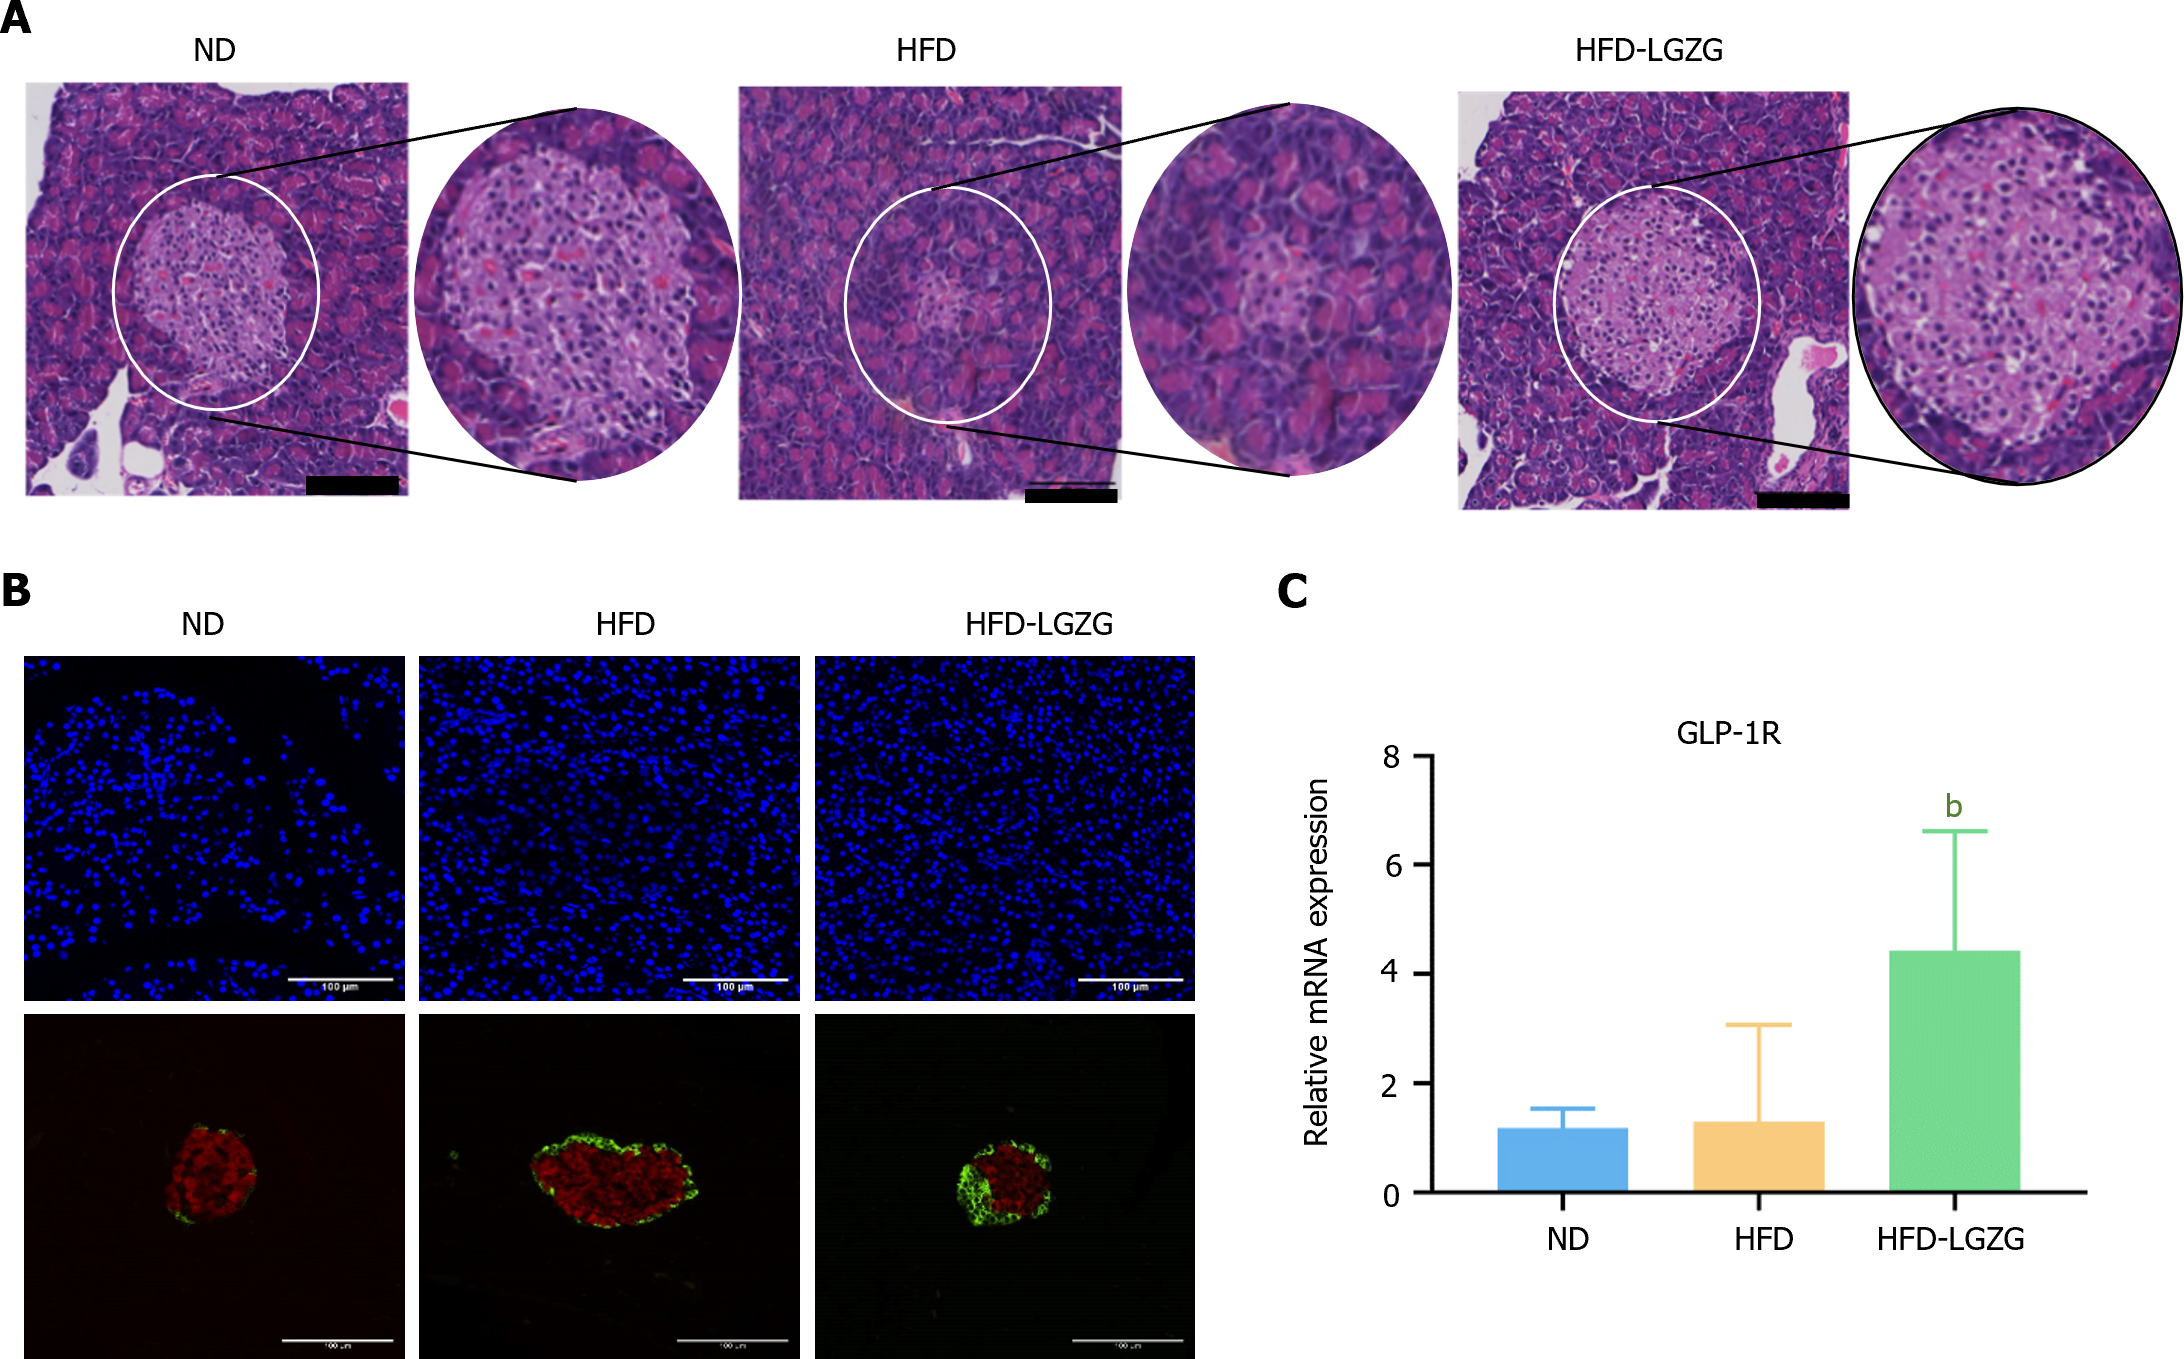
Figure 3 Lingguizhugan effectively preserves the morphology of pancreatic islet cells in insulin resistance rats.
A: The pancreatic tissue sections were stained with HE to visualize the cellular structure (scale bar, 100 μm); B: IF analysis was performed to quantify the expression of insulin (red) and GLP-1R (green) in the pancreas; C: The expression of pancreatic GLP-1R was evaluated. The data are presented as the mean ± SD (n = 5 per group) and were statistically analyzed using ANOVA. bP < 0.01, high-fat diet (HFD)-Lingguizhugan vs HFD. ND: Normal diet; HFD: High-fat diet; LGZG: Lingguizhugan.
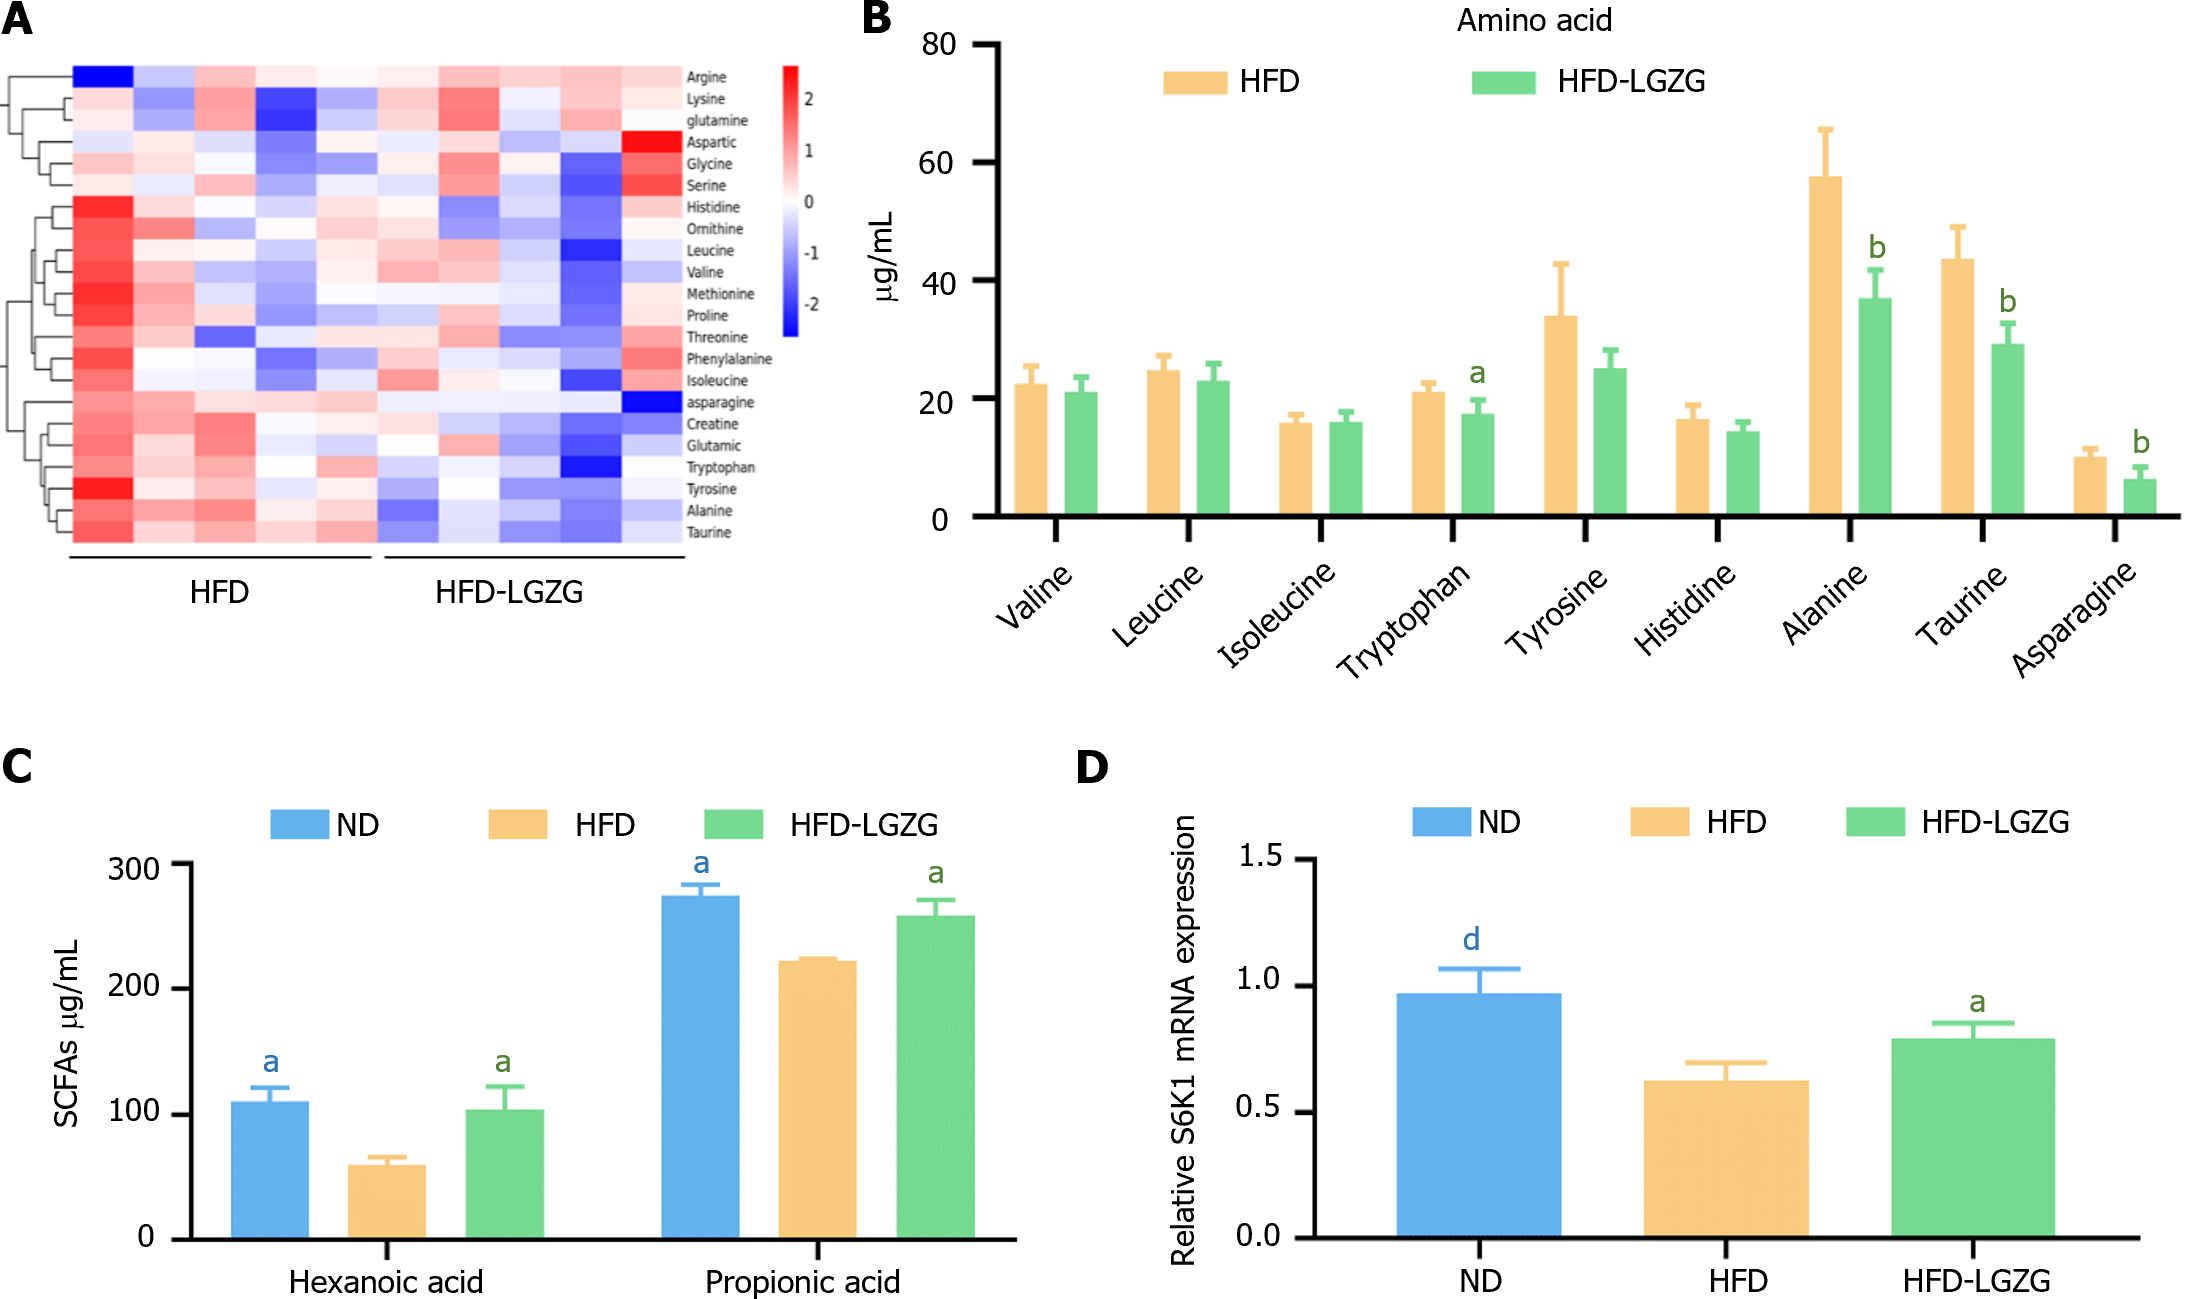
Figure 4 The relative abundance of amino acids.
A-C: Representative quantification of amino acids (B) and short-chain fatty acids (C) are shown; D: The expression of S6K1 in liver tissue is also presented. The data are expressed as the mean ± SD (n = 3-5 per group), and a t test with normalization was used to compare the two groups. All comparisons were made with the high-fat diet group. aP < 0.05, bP < 0.01 and dP < 0.001 indicated statistical significance. ND: Normal diet; HFD: High-fat diet; LGZG: Lingguizhugan.
- Citation: Liu XM, Yuan SQ, Ning Y, Nie SJ, Wang XQ, Jia HY, Zheng XL. Therapeutic effects of Lingguizhugan decoction in a rat model of high-fat diet-induced insulin resistance. World J Diabetes 2024; 15(6): 1291-1298
- URL: https://www.wjgnet.com/1948-9358/full/v15/i6/1291.htm
- DOI: https://dx.doi.org/10.4239/wjd.v15.i6.1291


