Copyright
©The Author(s) 2024.
World J Diabetes. Jun 15, 2024; 15(6): 1254-1262
Published online Jun 15, 2024. doi: 10.4239/wjd.v15.i6.1254
Published online Jun 15, 2024. doi: 10.4239/wjd.v15.i6.1254
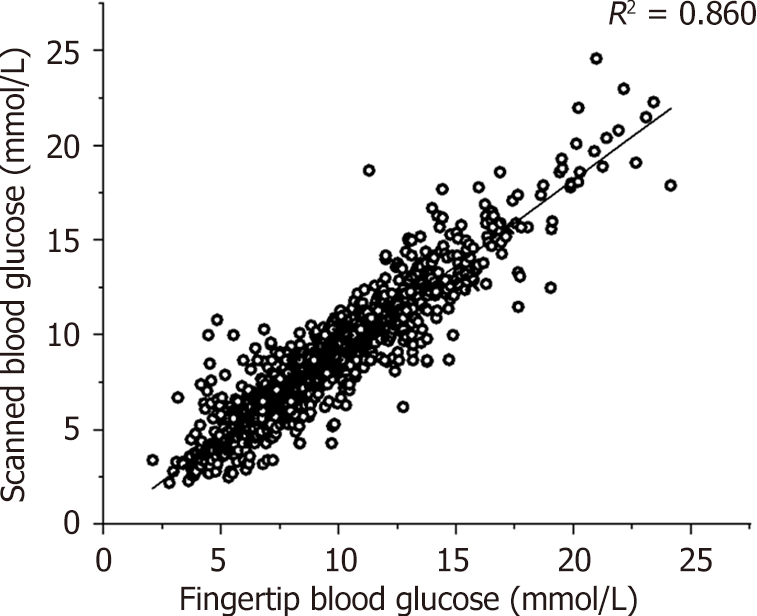
Figure 1 Correlation analysis of scanned and fingertip blood glucose levels.
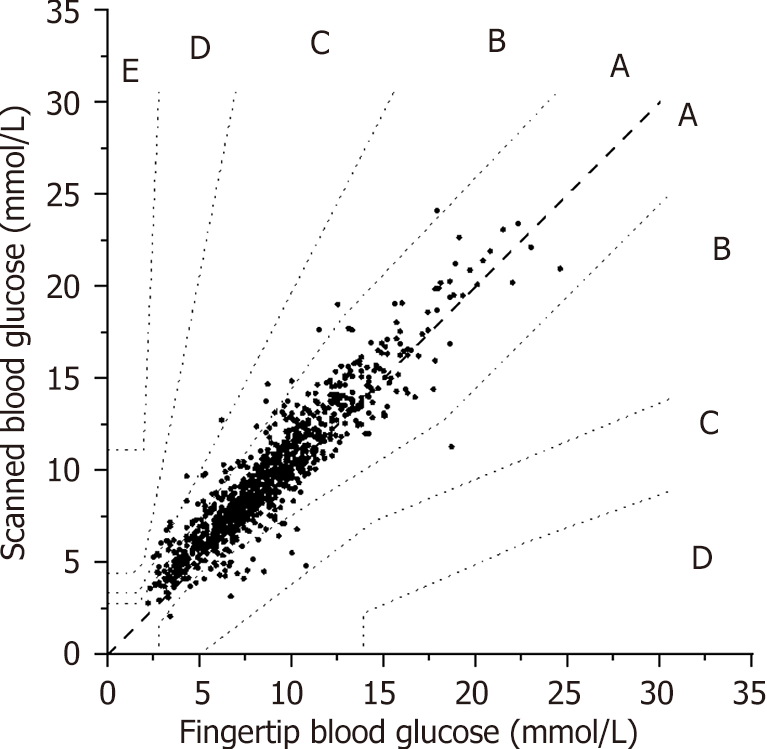
Figure 2 Consistency analysis of scanned and fingertip blood glucose levels.
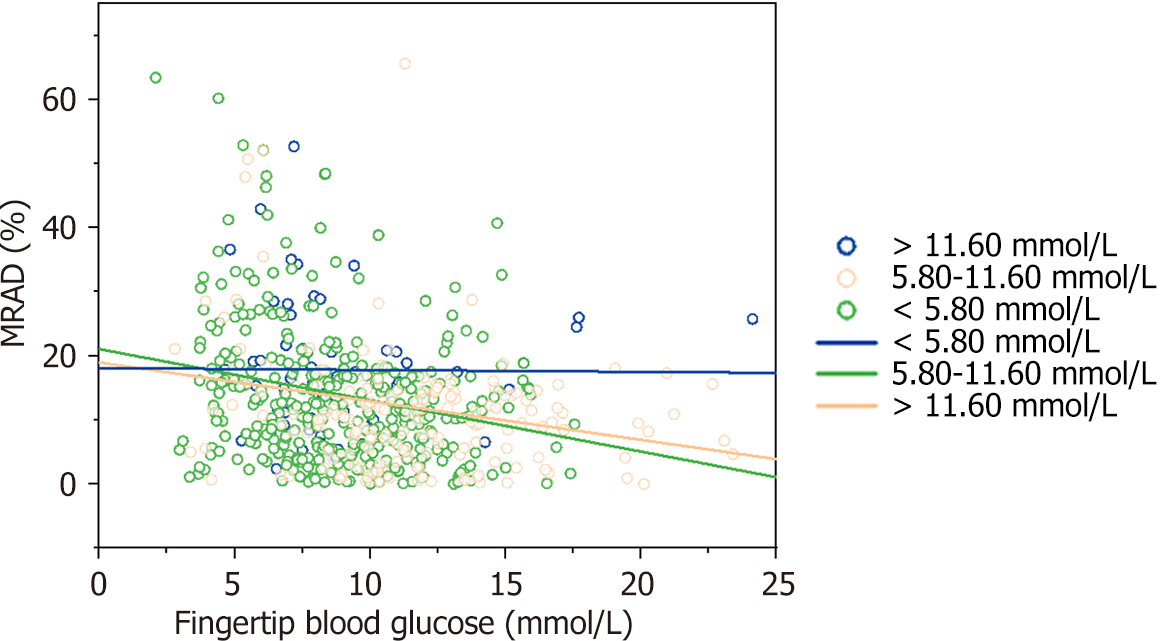
Figure 3 Trend plot representing the mean absolute relative difference and blood glucose levels in different blood glucose fluctuation groups.
MARD: Mean absolute relative difference.
- Citation: Sun ZM, Du YZ, Wang SY, Sun SY, Ye Y, Sun XP, Li MX, He H, Long WC, Zhang CH, Yao XY, Fan WY, Wang L, Wu YH. Accuracy of FreeStyle Libre flash glucose monitoring in patients with type 2 diabetes who migrated from highlands to plains. World J Diabetes 2024; 15(6): 1254-1262
- URL: https://www.wjgnet.com/1948-9358/full/v15/i6/1254.htm
- DOI: https://dx.doi.org/10.4239/wjd.v15.i6.1254


