Copyright
©The Author(s) 2024.
World J Diabetes. Jun 15, 2024; 15(6): 1242-1253
Published online Jun 15, 2024. doi: 10.4239/wjd.v15.i6.1242
Published online Jun 15, 2024. doi: 10.4239/wjd.v15.i6.1242
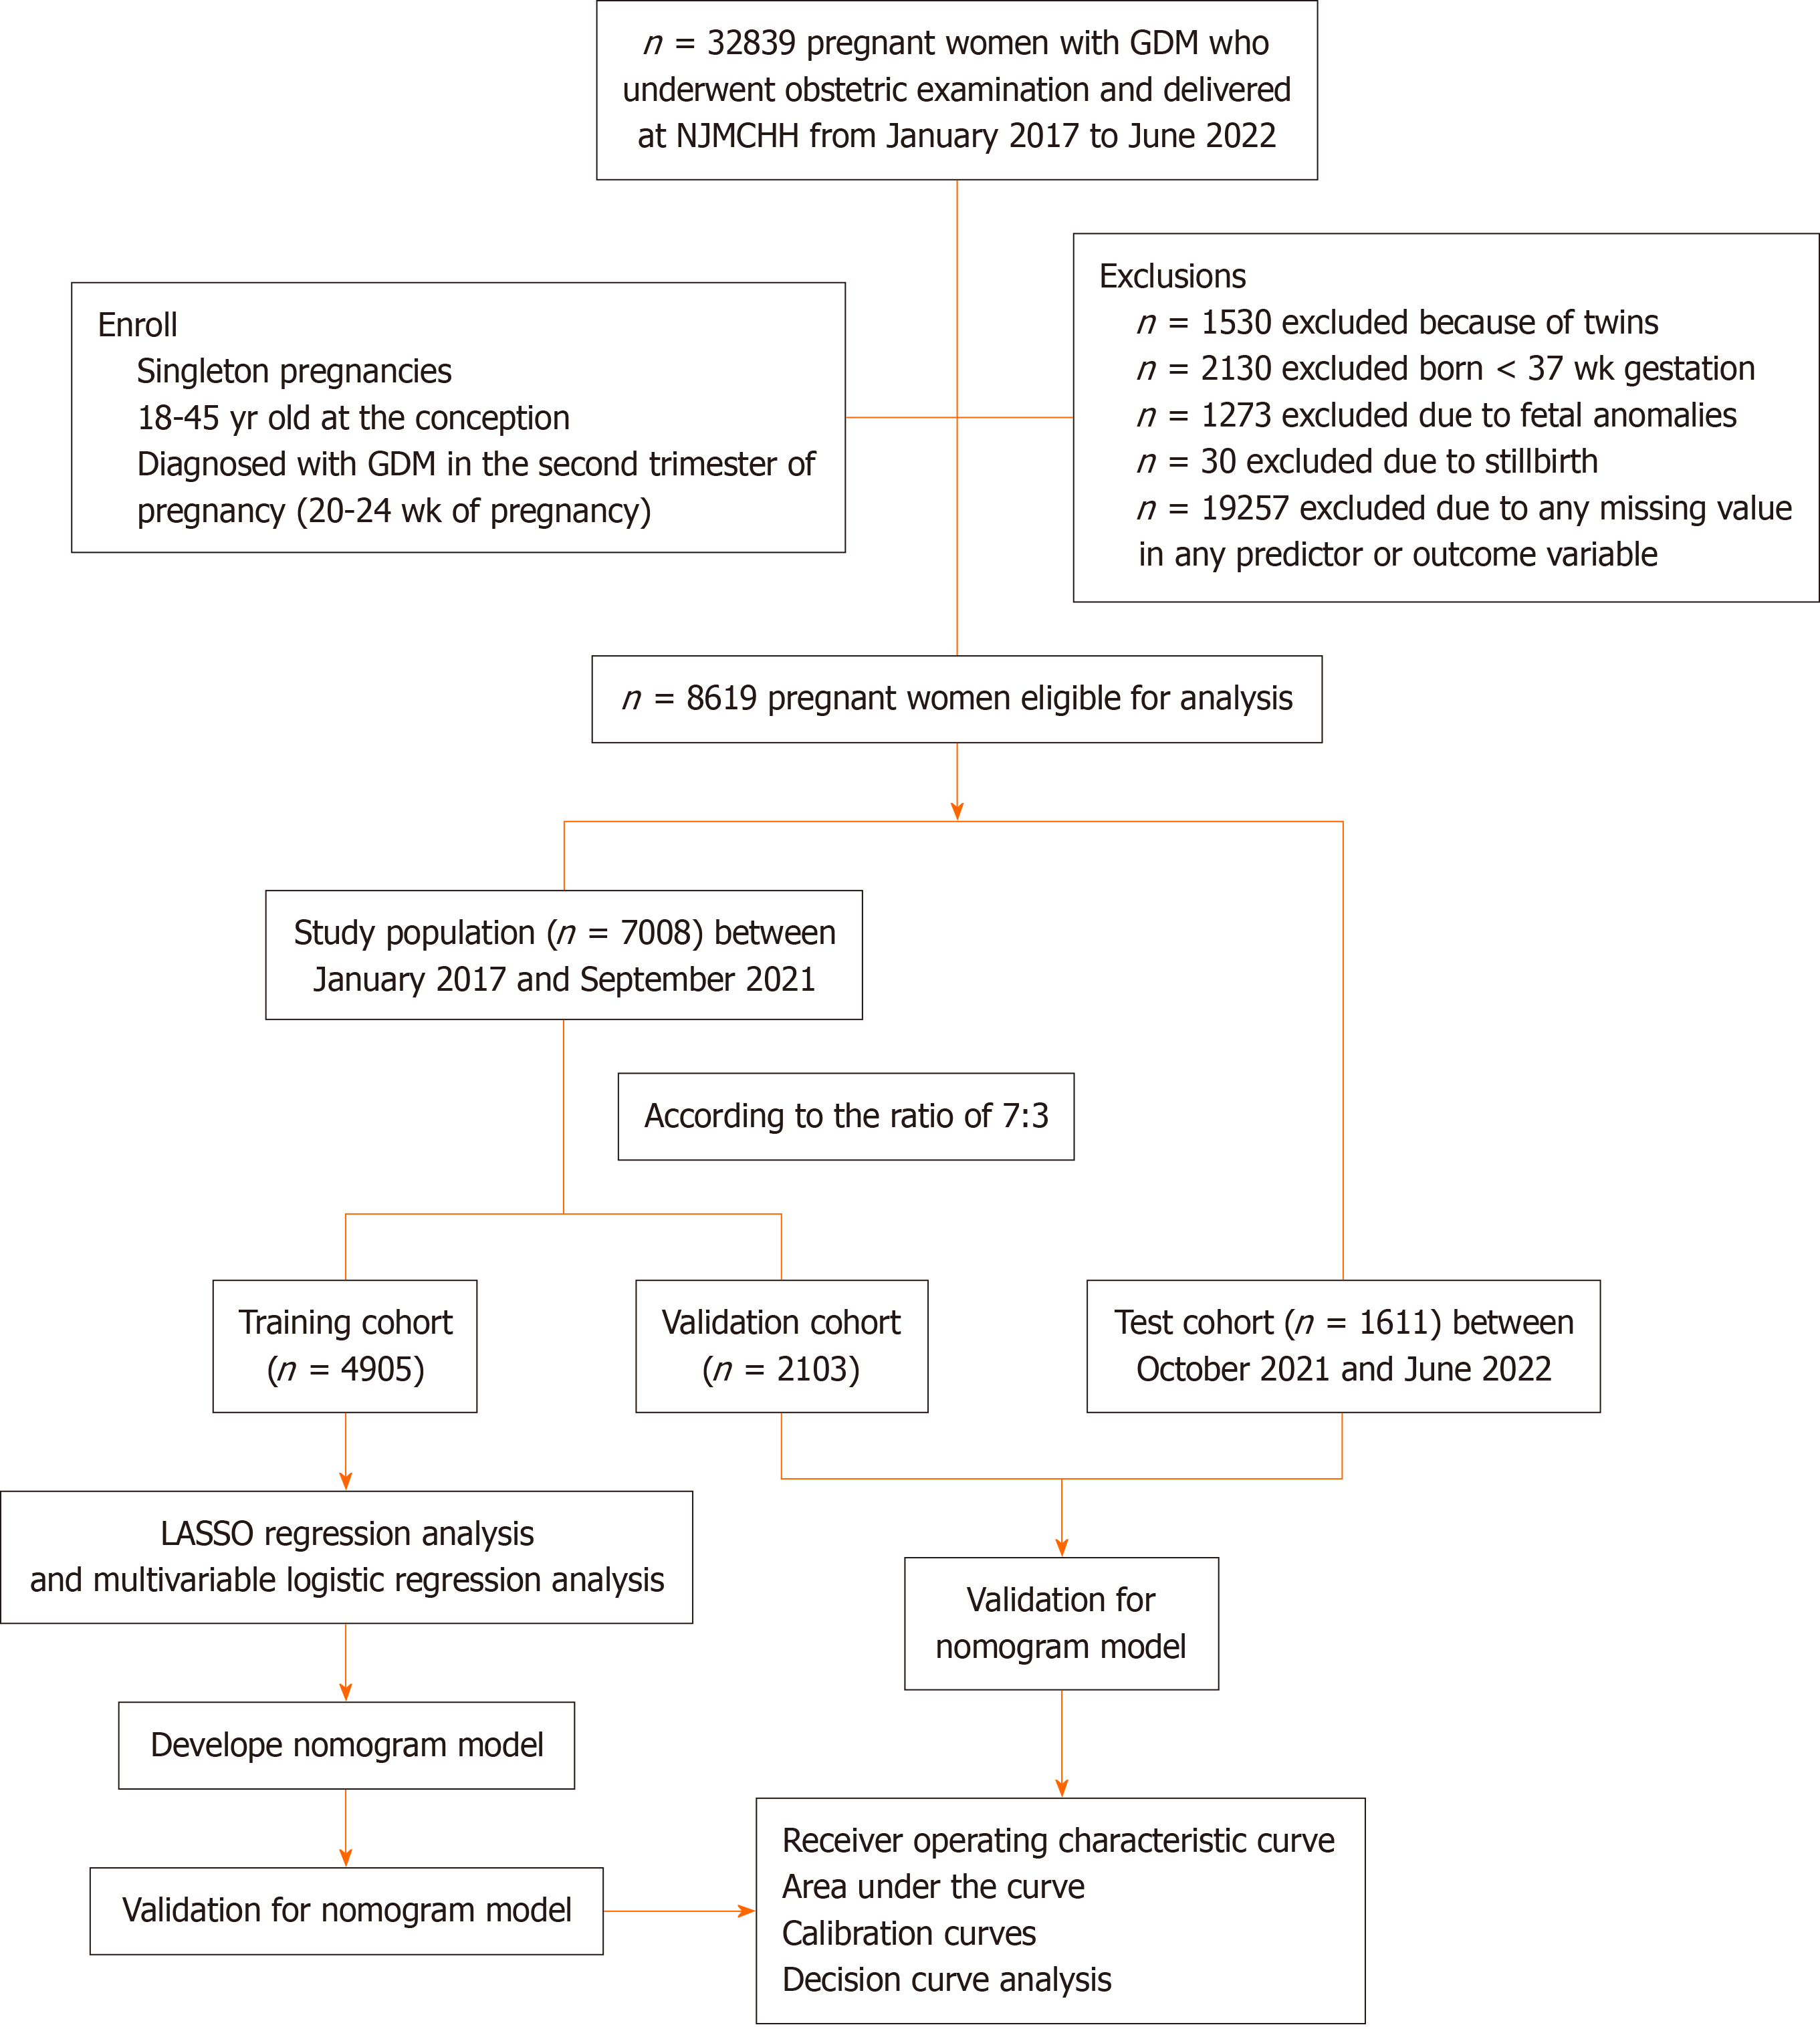
Figure 1 Flowchart of the study population selection and data availability.
GDM: Gestational diabetes mellitus; LASSO: Least Absolute Shrinkage and Selection Operator.
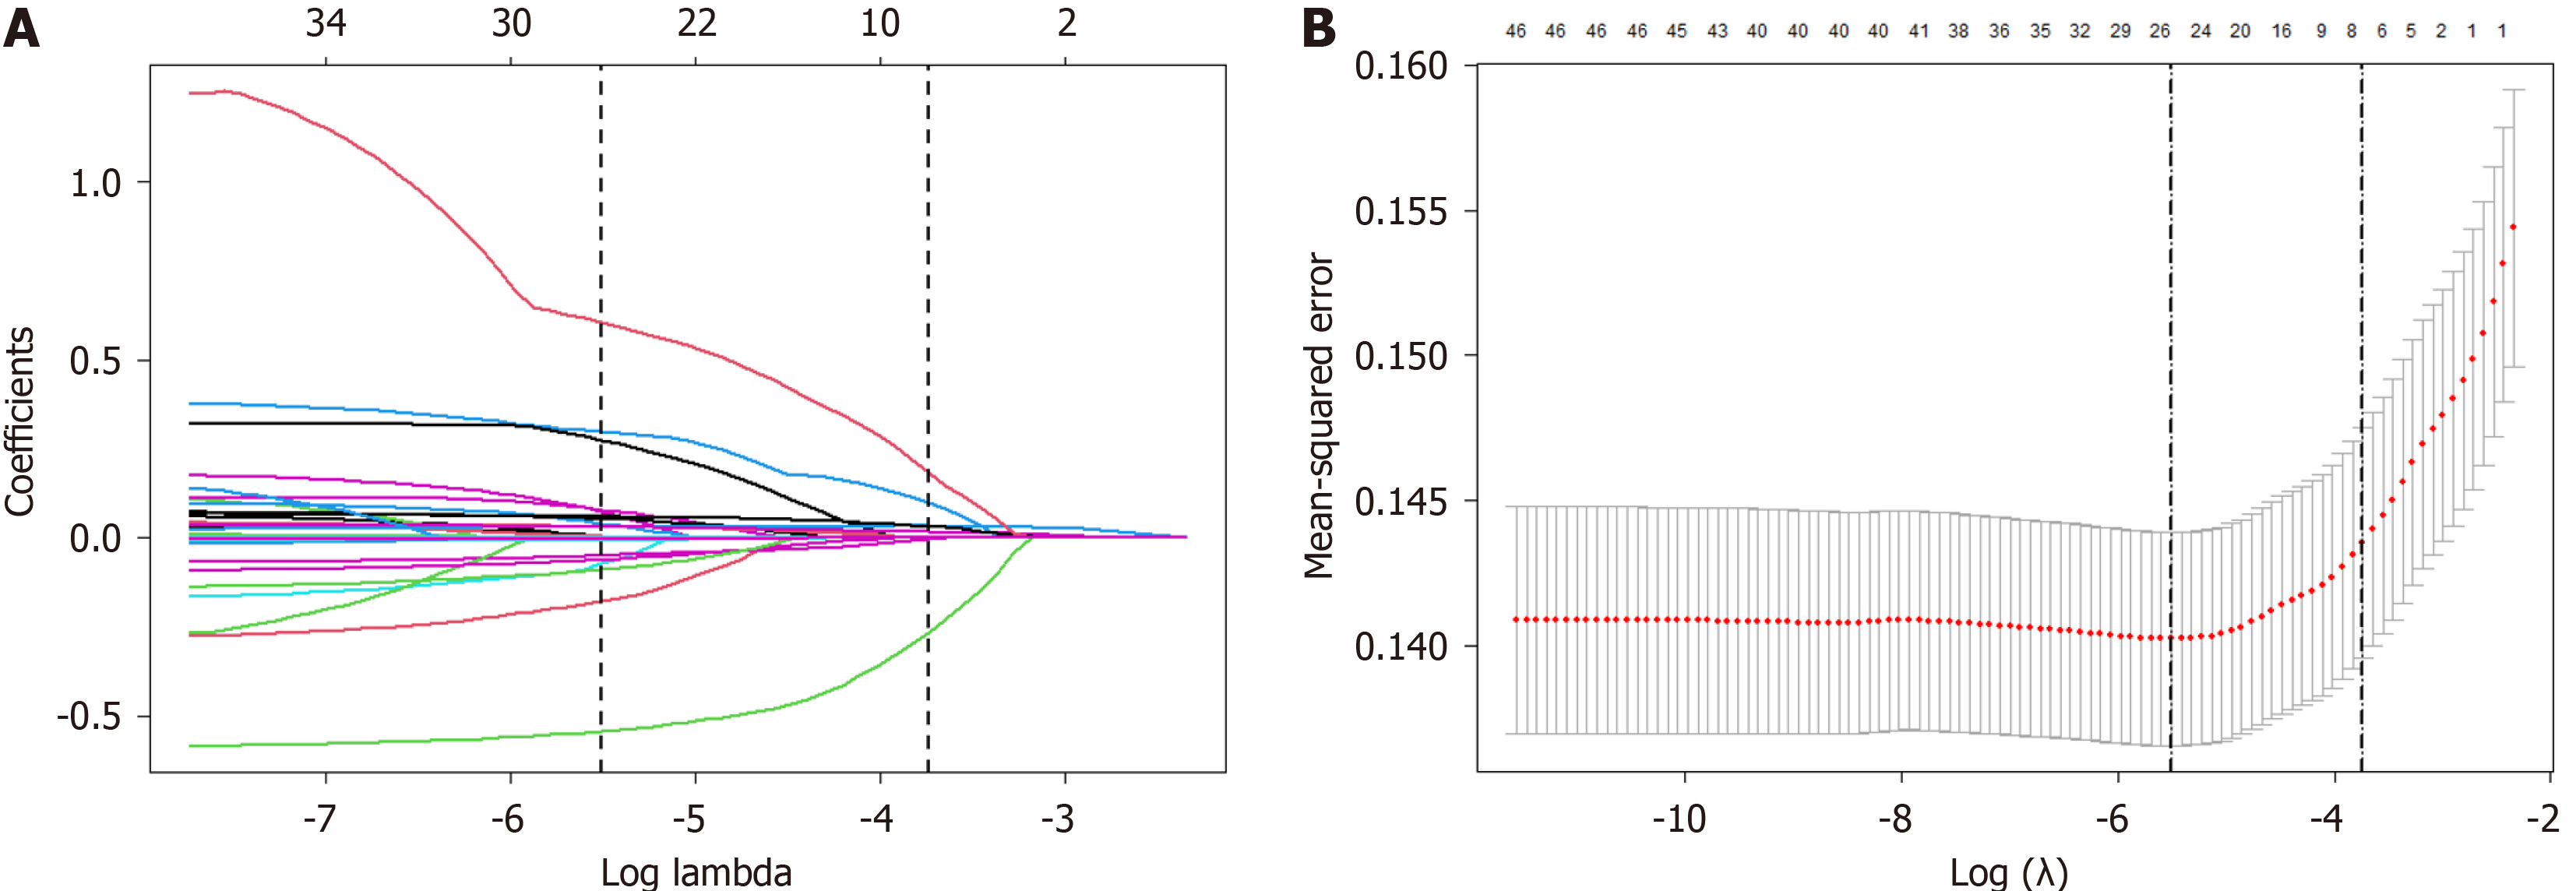
Figure 2 The potential predictors selected by the Least Absolute Shrinkage and Selection Operator regression analysis model.
A: Regression coefficient path diagram; B: Cross verification curve.
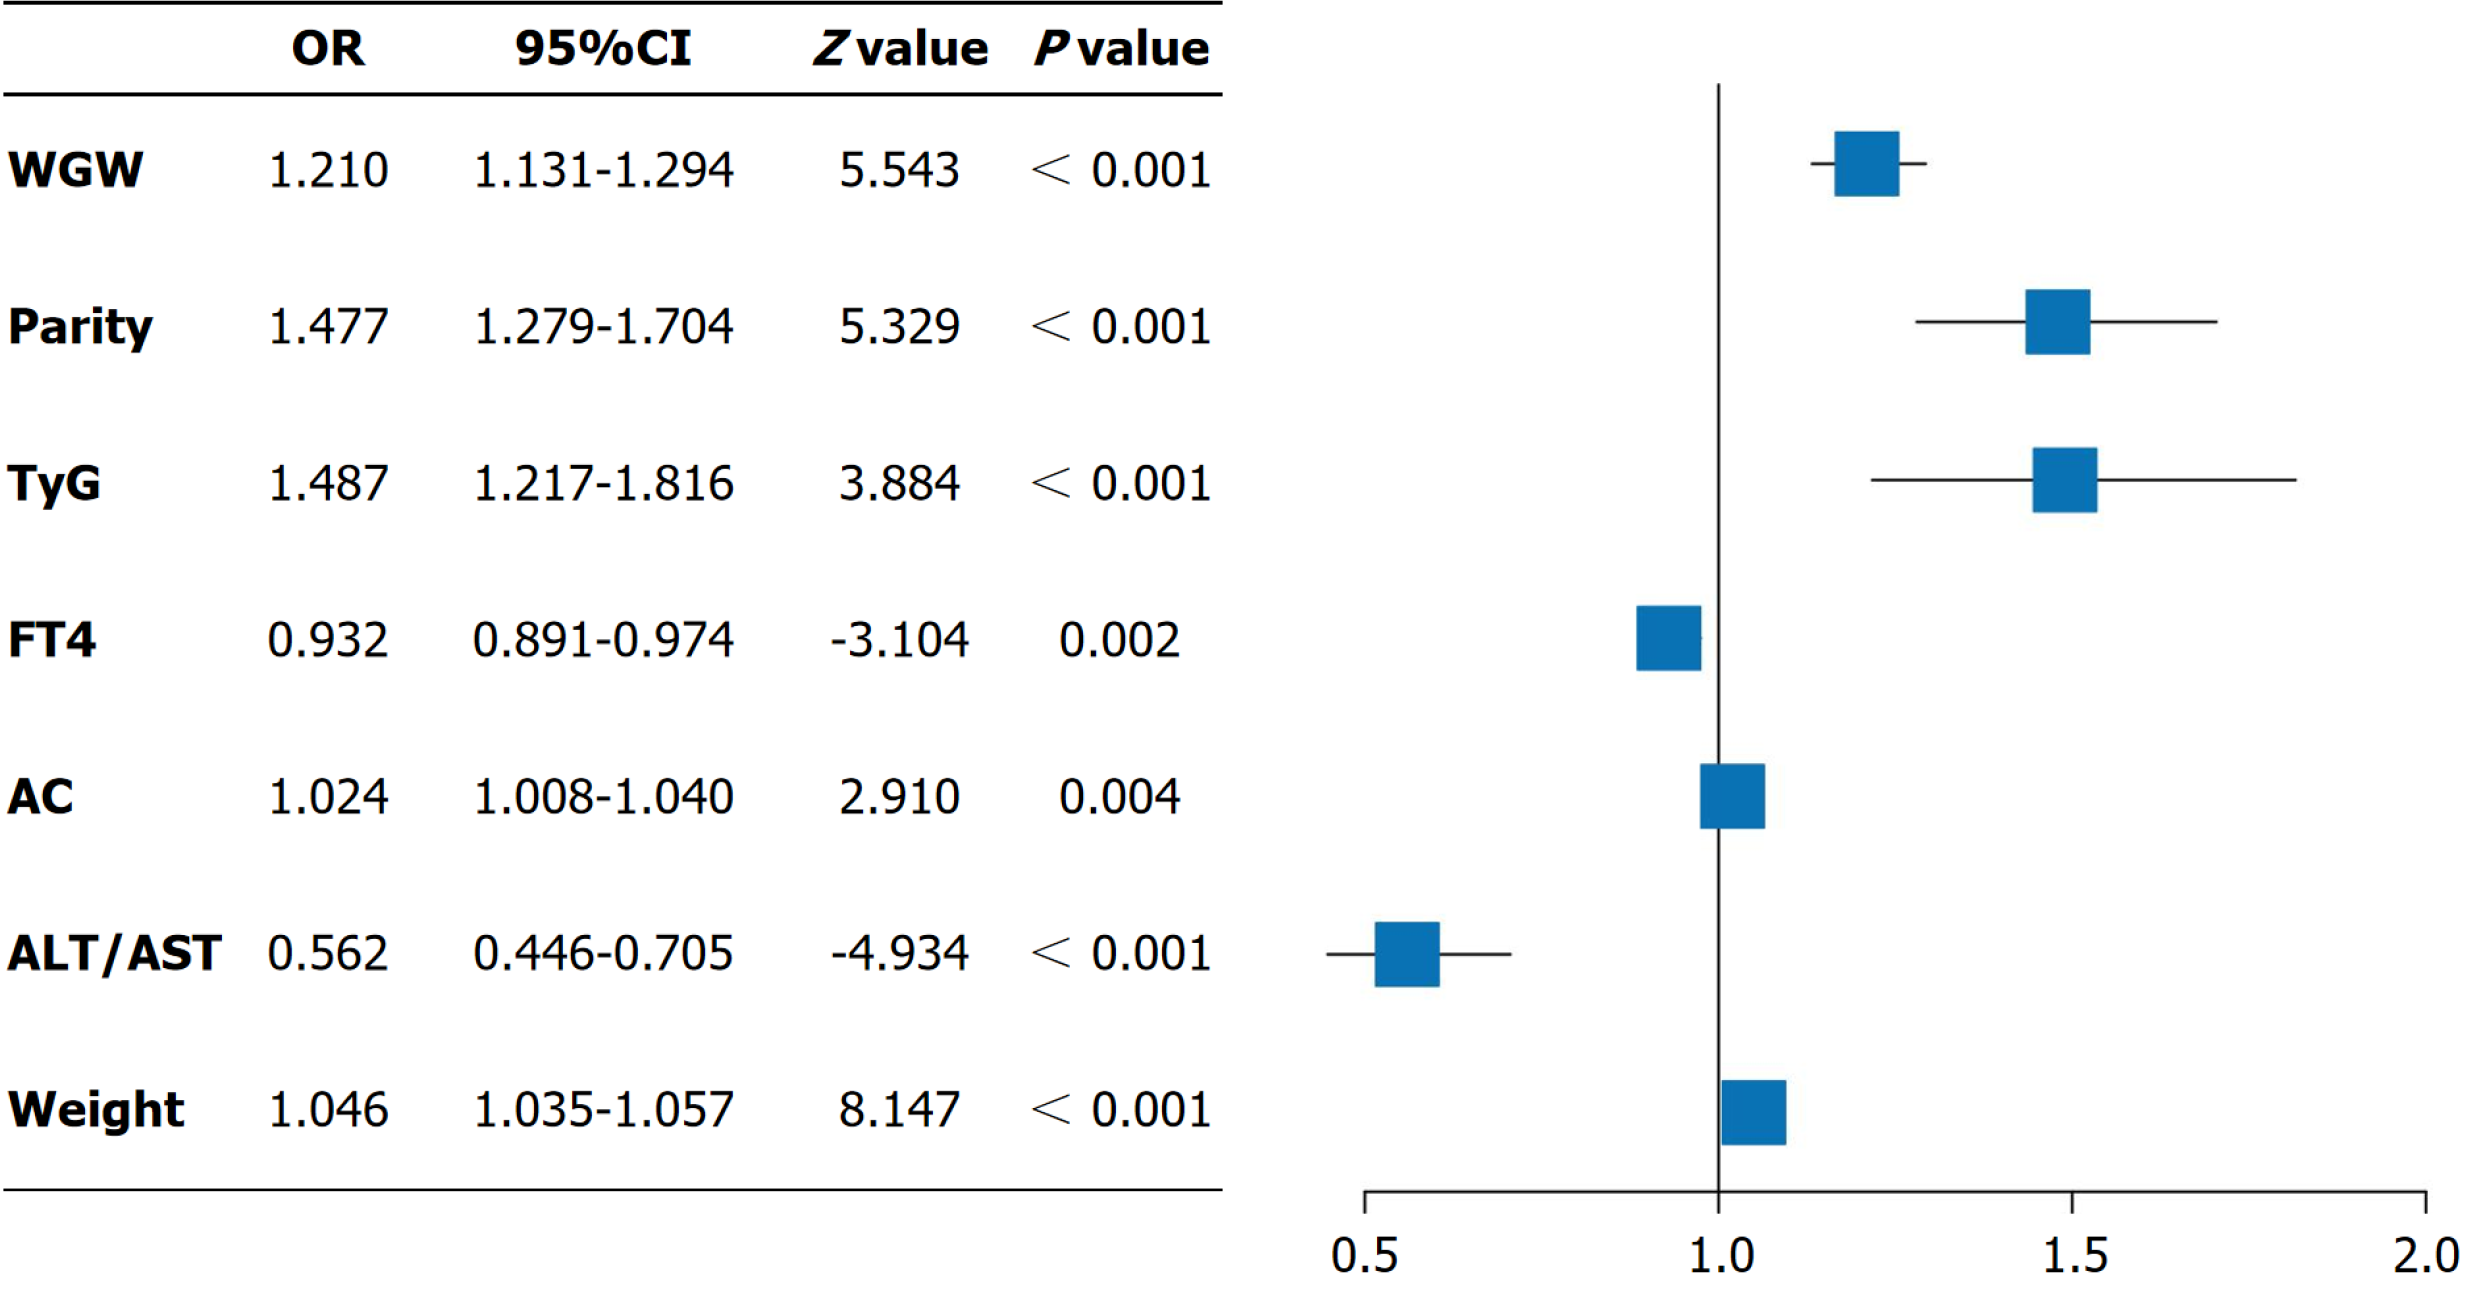
Figure 3 Results of the multivariable logistic regression analysis of delivering an large-for-gestational-age infant in pregnant women with gestational diabetes mellitus.
WGW: Weight gain during pregnancy measured at the 24th week; TyG: Triglyceride-glucose index; FT4: Free tetraiodothyronine; AC: Abdominal circumference; ALT: Alanine transaminase; AST: Aspartate aminotransferase.
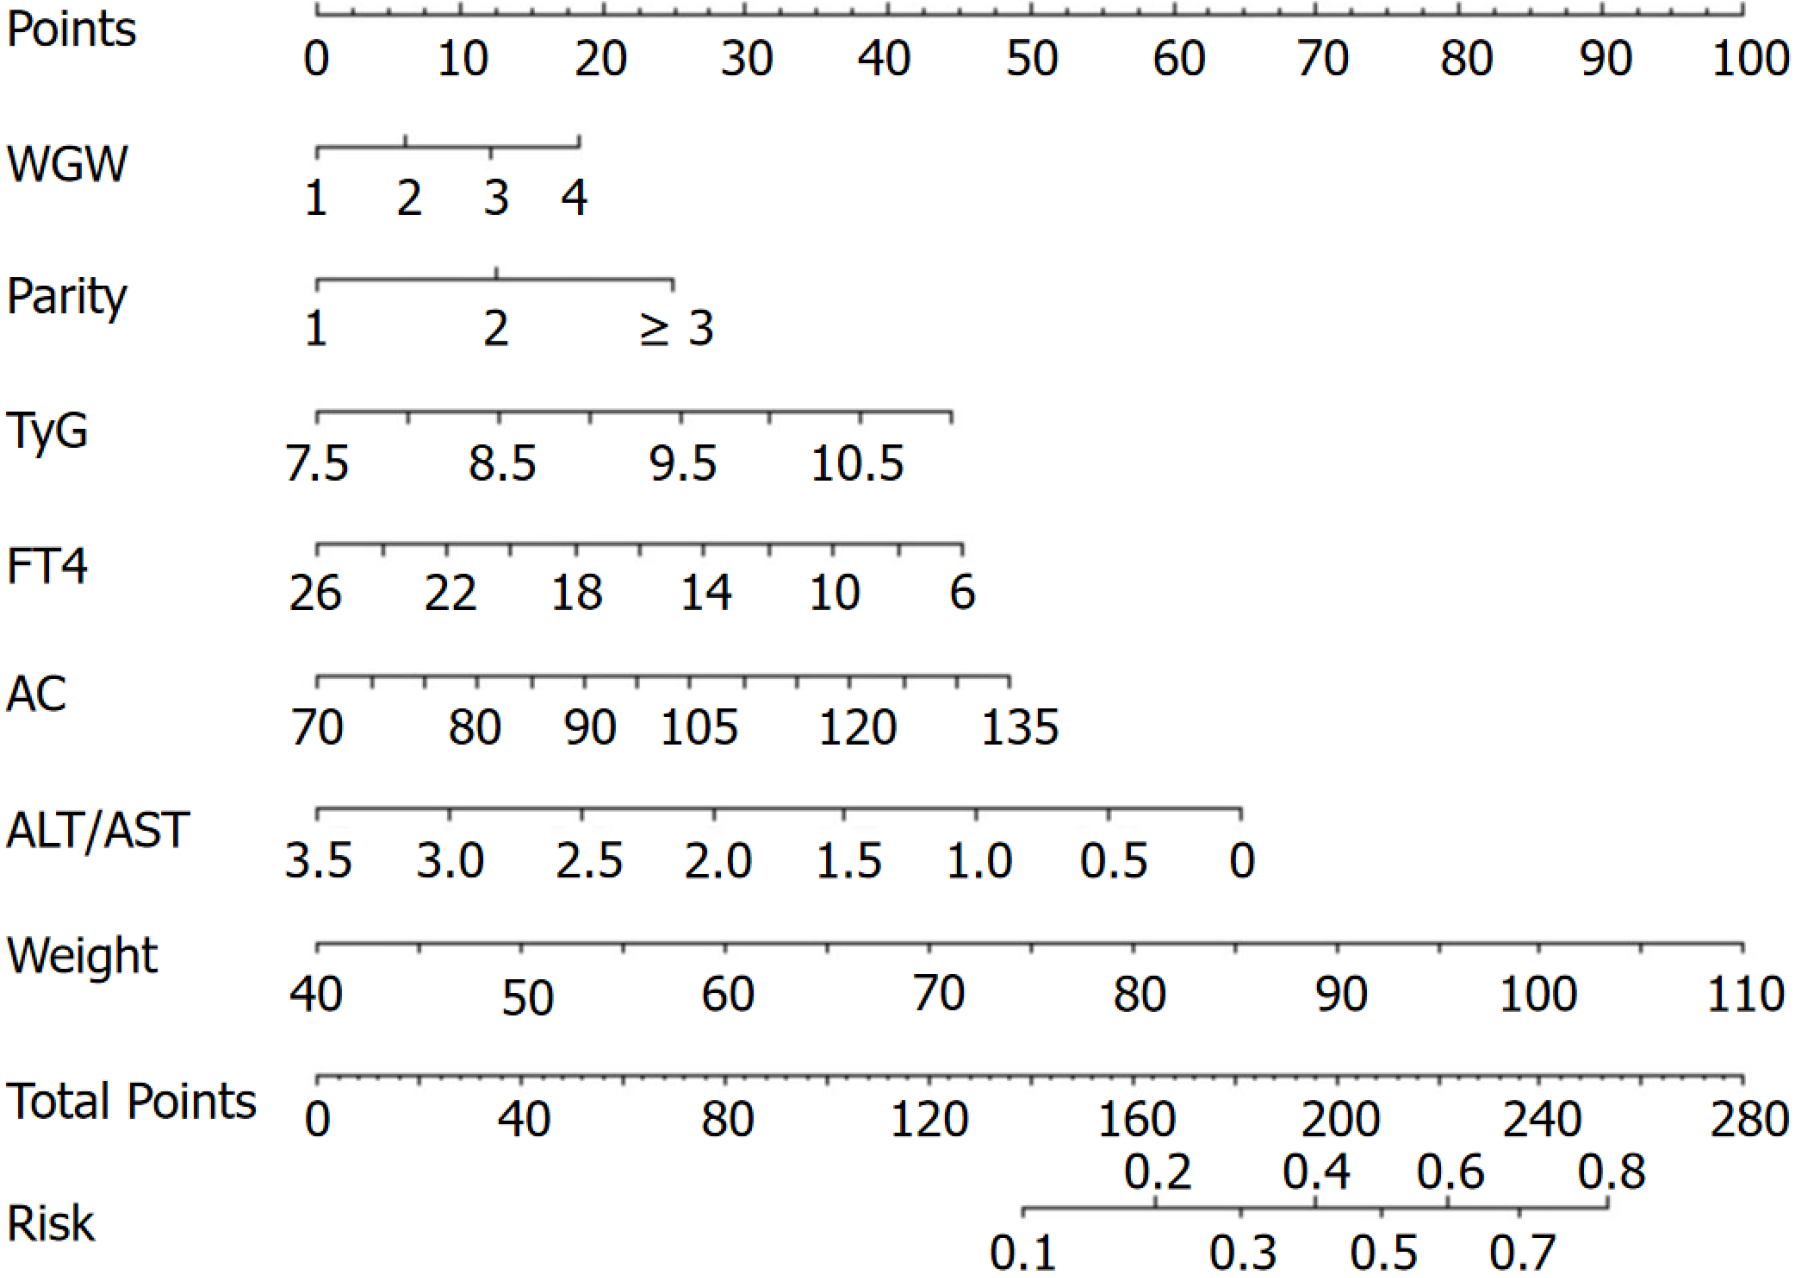
Figure 4 Nomogram for predicting large-for-gestational-age infant in pregnant women with gestational diabetes mellitus.
WGW: Weight gain during pregnancy at 24 gestational weeks; TyG: Triglyceride-glucose index; FT4: Free tetraiodothyronine; AC: Abdominal circumference; ALT: Alanine transaminase; AST: Aspartate aminotransferase.
Figure 5 The receiver operating characteristic curve and area under the receiver operating characteristic curve for the prediction of large-for-gestational-age in women with gestational diabetes mellitus.
A: Training cohort; B: Validation cohort; C: Test cohort.
Figure 6 Calibration curve for the prediction of large-for-gestational-age in women with gestational diabetes mellitus.
A: Training cohort; B: Validation cohort; C: Test cohort.
Figure 7 Decision curve analysis for predicting large-for-gestational-age in women with gestational diabetes mellitus.
A: Training cohort; B: Validation cohort; C: Test cohort.
- Citation: Zhu YT, Xiang LL, Chen YJ, Zhong TY, Wang JJ, Zeng Y. Developing and validating a predictive model of delivering large-for-gestational-age infants among women with gestational diabetes mellitus. World J Diabetes 2024; 15(6): 1242-1253
- URL: https://www.wjgnet.com/1948-9358/full/v15/i6/1242.htm
- DOI: https://dx.doi.org/10.4239/wjd.v15.i6.1242


