Copyright
©The Author(s) 2024.
World J Diabetes. Jun 15, 2024; 15(6): 1234-1241
Published online Jun 15, 2024. doi: 10.4239/wjd.v15.i6.1234
Published online Jun 15, 2024. doi: 10.4239/wjd.v15.i6.1234
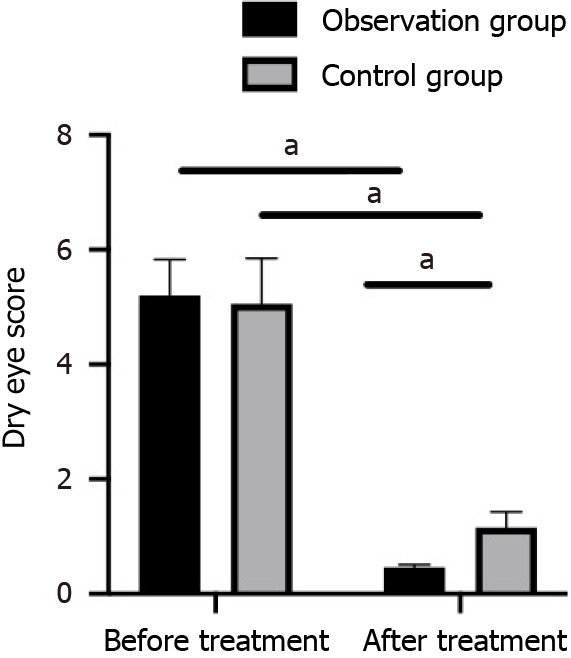
Figure 1 Comparison of pre- and posttreatment dry eye scores between the recombinant human epidermal growth factor + sodium hyaluronate eye drops group and sodium hyaluronate eye drops alone group.
aP < 0.05.
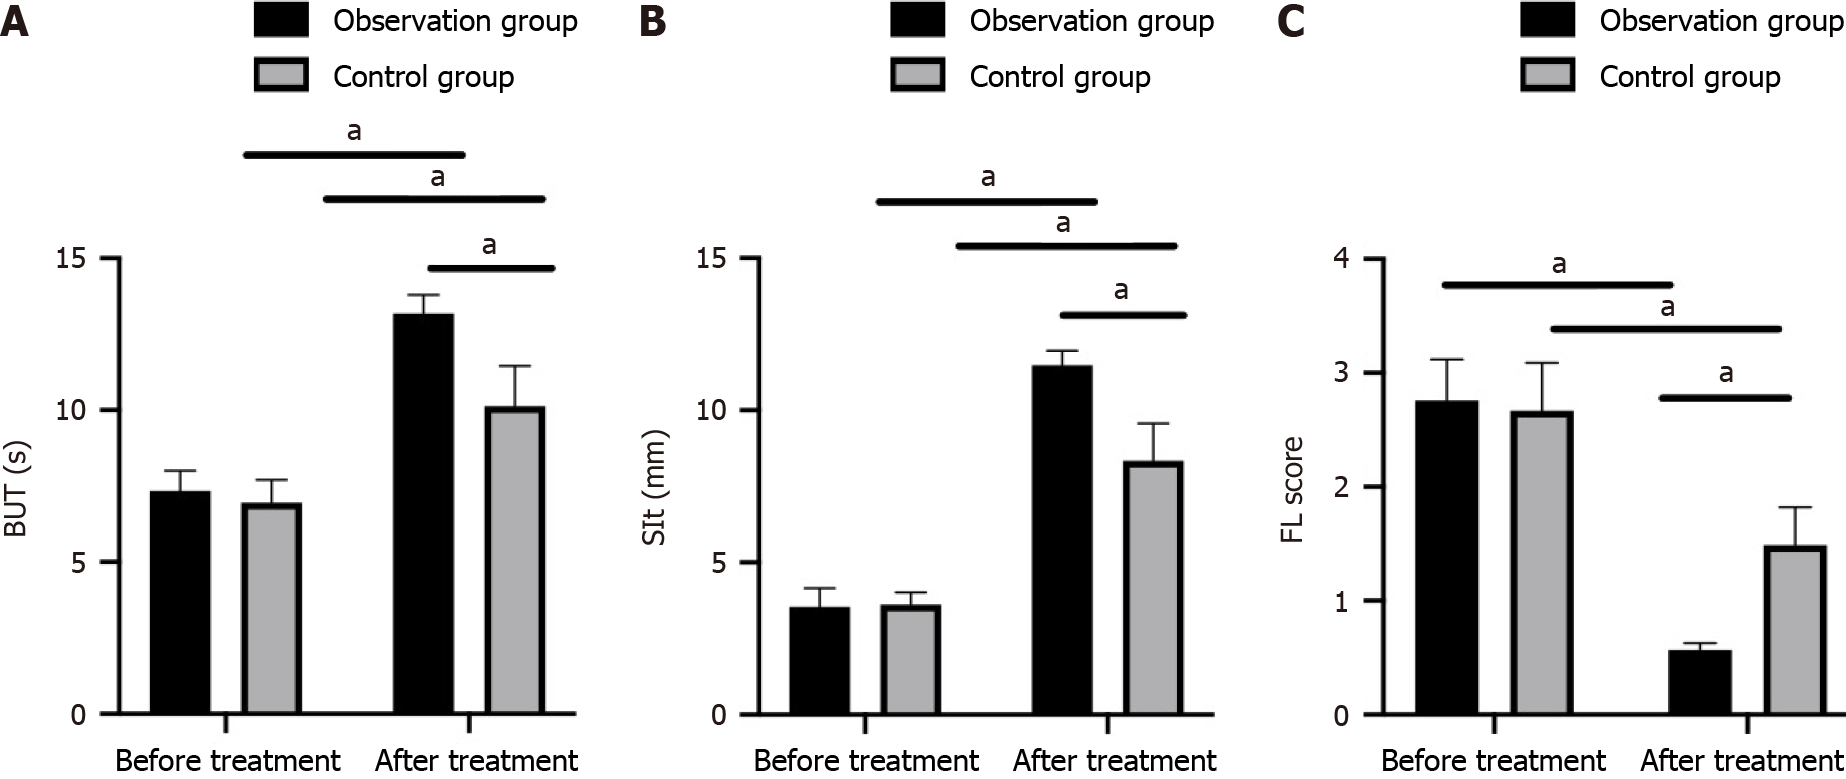
Figure 2 Comparison of pre- and posttreatment tear film breakup time, Schirmer I test, and fluorescein staining scores between the recombinant human epidermal growth factor + sodium hyaluronate eye drops group and sodium hyaluronate eye drops alone group.
A: Comparison of tear film breakup time results; B: Comparison of Schirmer I test results; C: Comparison of fluorescein staining scores. aP < 0.05. Sit: Schirmer I test; FL: Fluorescein staining; BUT: Breakup time.
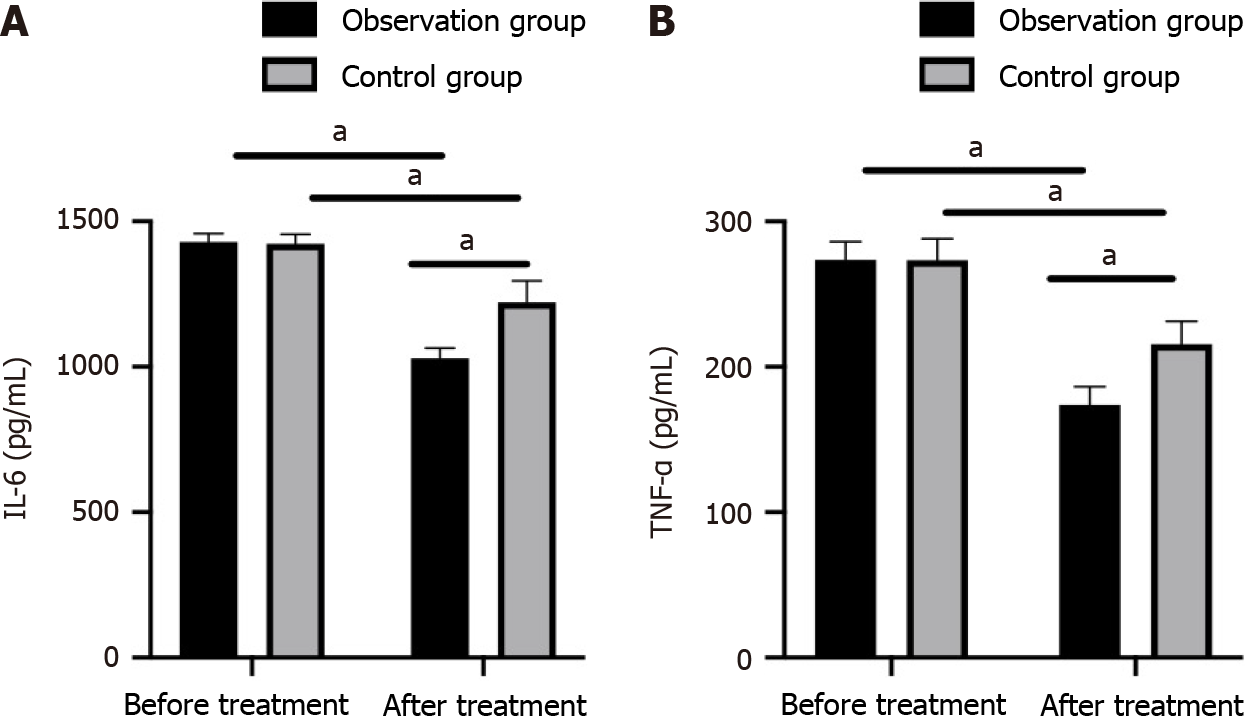
Figure 3 Pre- and posttreatment tear inflammatory markers between the recombinant human epidermal growth factor + sodium hyaluronate eye drops group and the sodium hyaluronate eye drops alone group.
A: Comparison of interleukin-6 levels; B: Comparison of tumor necrosis factor-α levels. aP < 0.05. TNF-α: Tumor necrosis factor-α; IL-6: Interleukin-6.
- Citation: Li JL, Zhao J, Guo ZF, Xiao C, Liu X. Efficacy of recombinant human epidermal growth factor plus sodium hyaluronate eye drops in diabetic dry eye post-cataract surgery. World J Diabetes 2024; 15(6): 1234-1241
- URL: https://www.wjgnet.com/1948-9358/full/v15/i6/1234.htm
- DOI: https://dx.doi.org/10.4239/wjd.v15.i6.1234


