Copyright
©The Author(s) 2024.
World J Diabetes. May 15, 2024; 15(5): 977-987
Published online May 15, 2024. doi: 10.4239/wjd.v15.i5.977
Published online May 15, 2024. doi: 10.4239/wjd.v15.i5.977
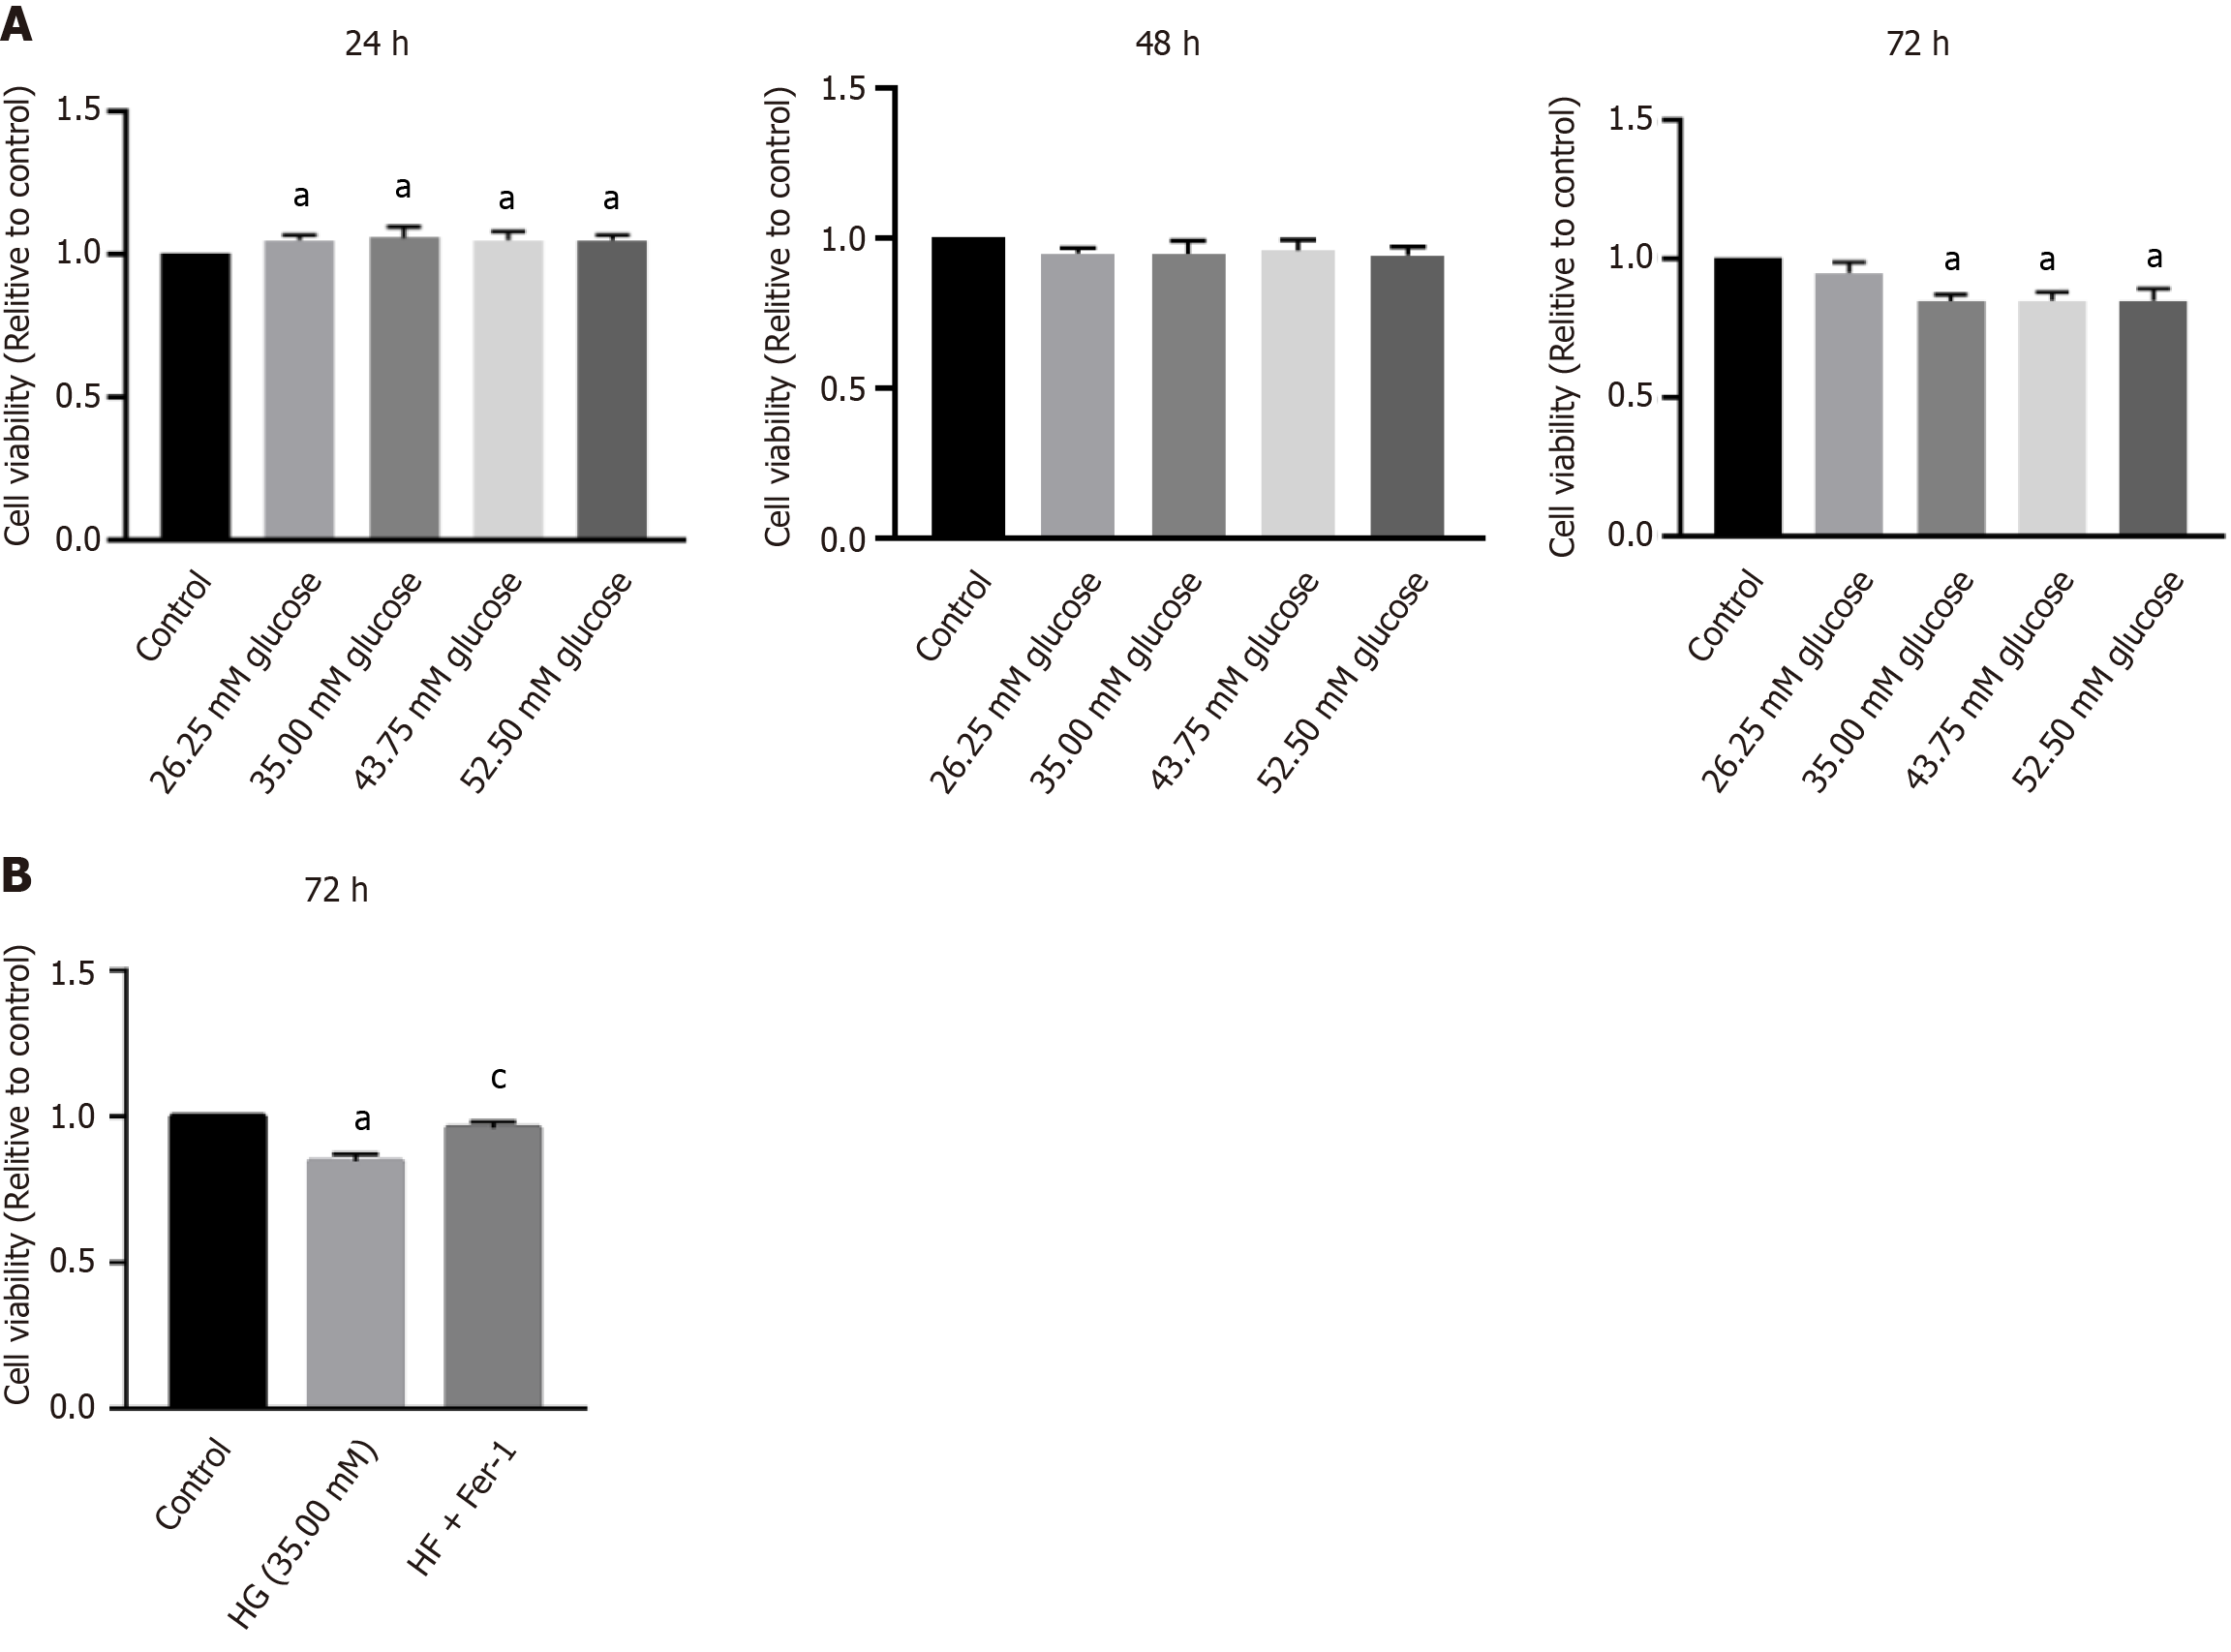
Figure 1 Detection of osteoblast activity after the addition of different glucose concentrations at different time points.
A: Osteoblasts considerably reduced in activity after 72 h in glucose concentrations ≥ 35 mmol/L; B: Osteoblasts treated with high glucose (HG) combined with Fer-1 showed increased activity compared with those in the HG group. Data are presented as mean ± SD. aP < 0.05 vs control; cP < 0.05 vs HG. HG: High glucose.
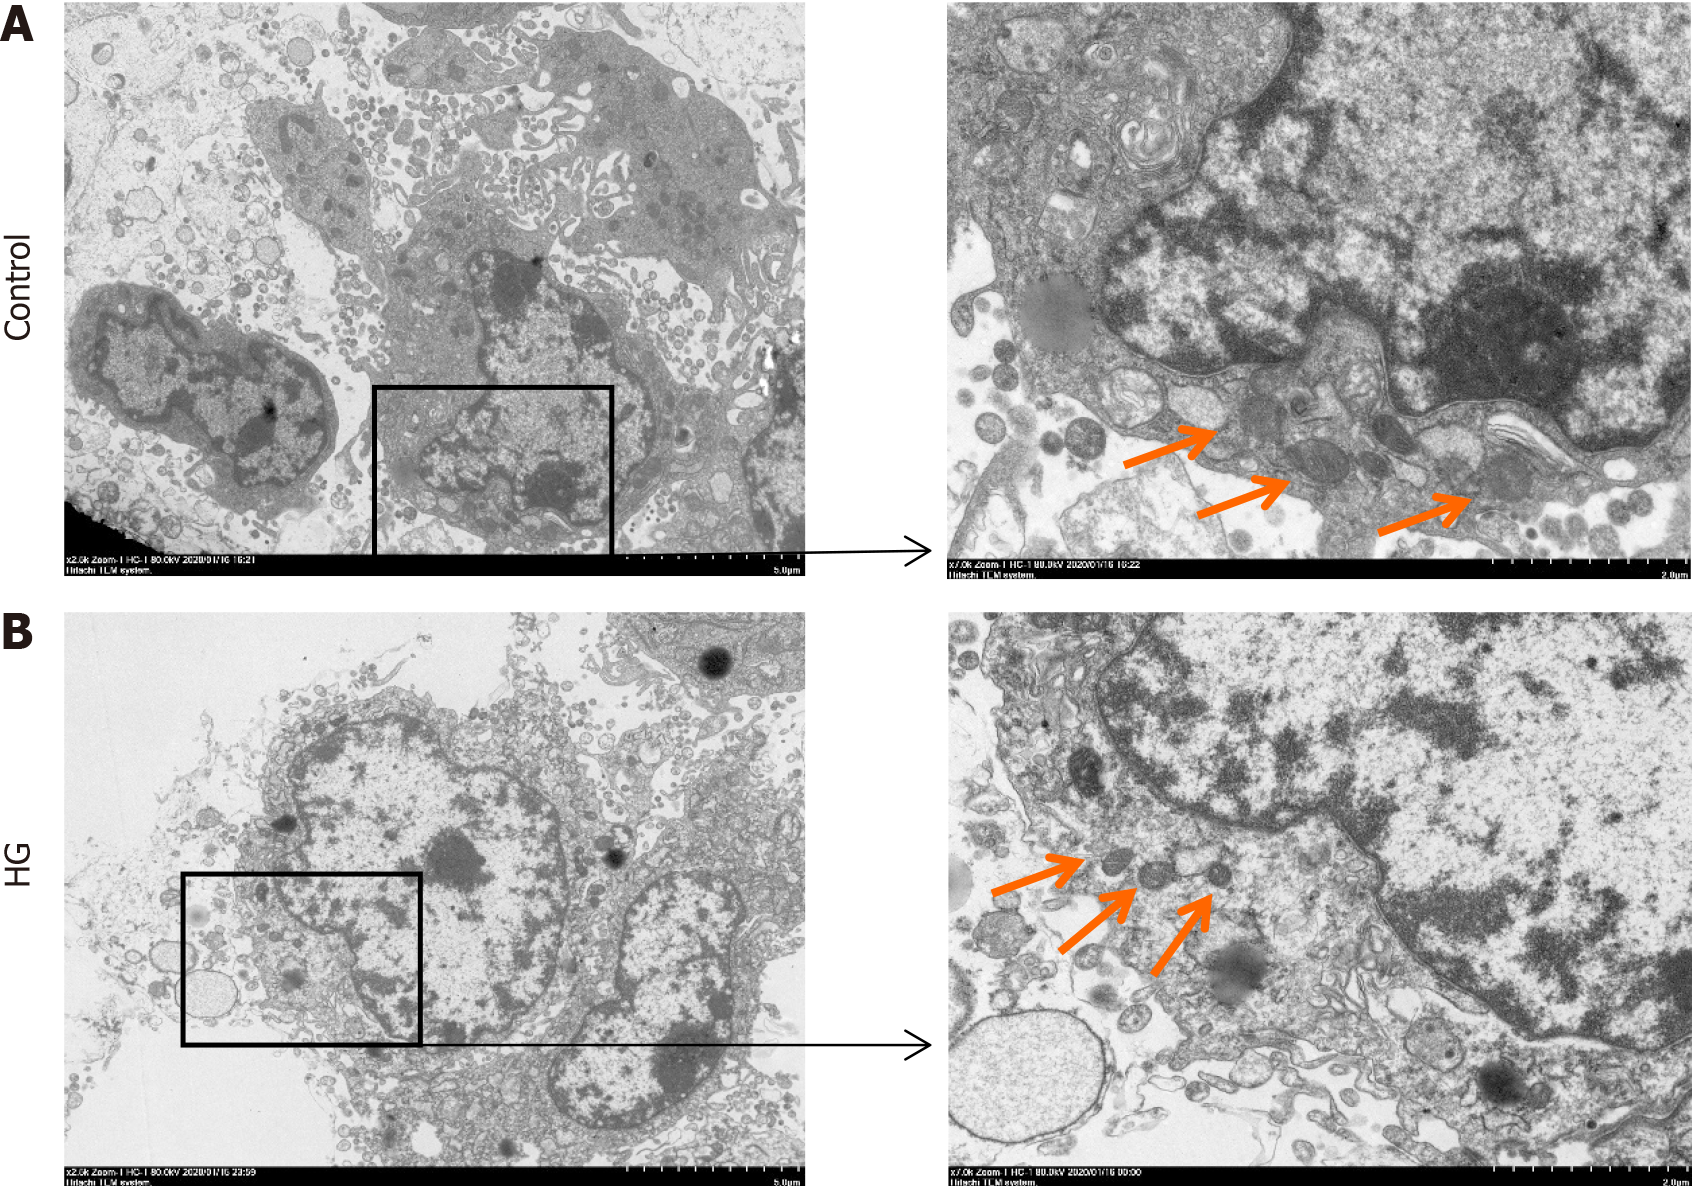
Figure 2 Observation of mitochondrial changes in osteoblasts in a high glucose environment using electron microscopy.
A: In the control group, the mitochondria in the osteoblasts were normal and the ridge lines were clear; B: In the high glucose group, the mitochondria in the osteoblasts were fused and shrunken, and the staining was deeper. HG: High glucose.
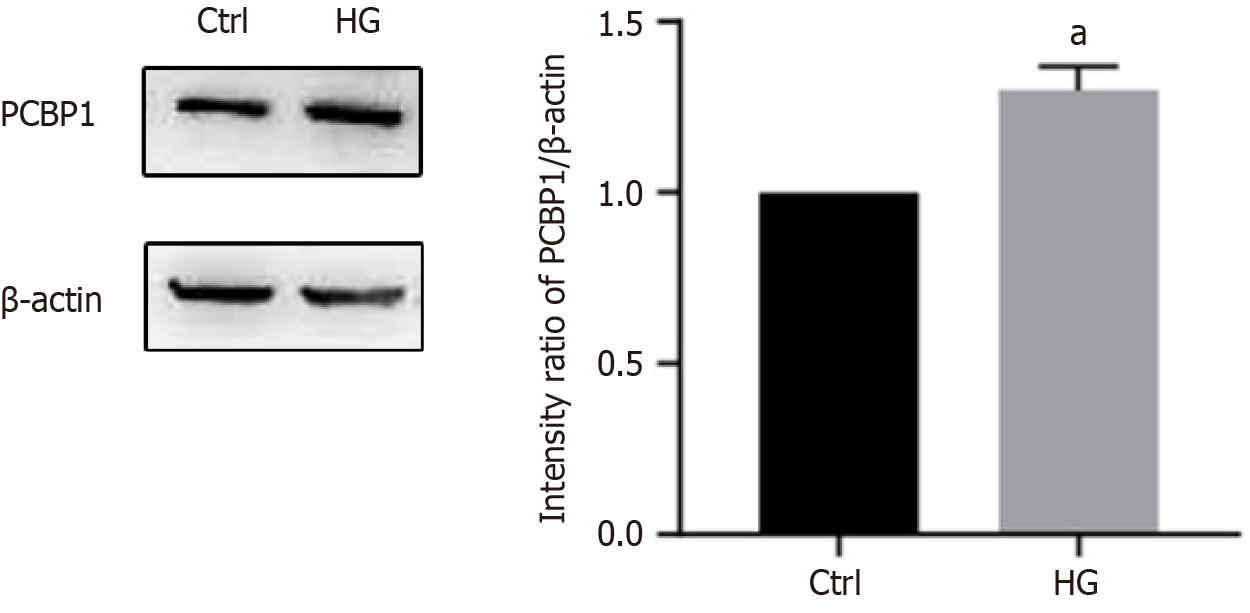
Figure 3 Detection of polycytosine RNA-binding protein 1 expression in osteoblasts under high glucose.
Compared with the control group, polycytosine RNA-binding protein 1 expression was higher in the high glucose group. Data are presented as the mean ± SD. aP < 0.05 vs control. HG: High glucose; PCBP1: Polycytosine RNA-binding protein 1.
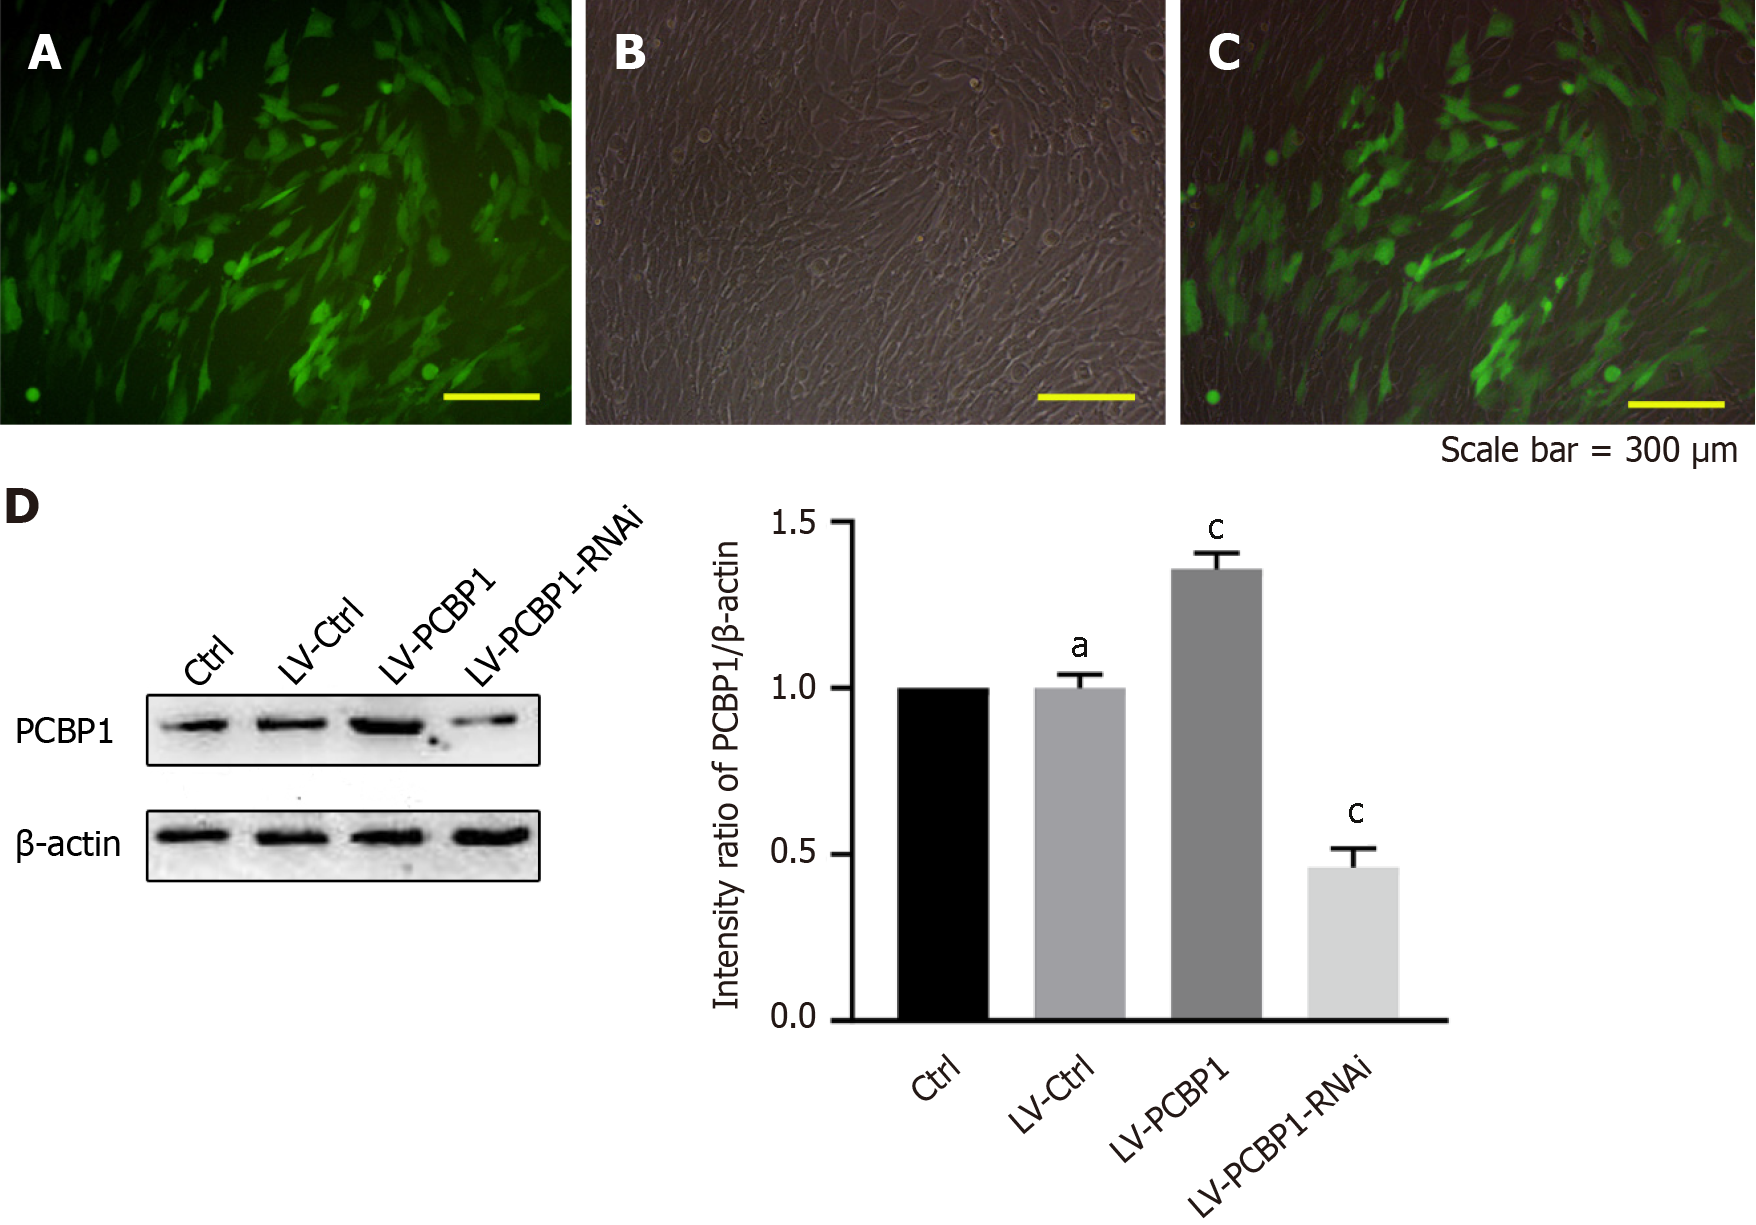
Figure 4 hFOB l.
19 cells were infected with polycytosine RNA-binding protein 1-encoded lentivirus, and the expression level of polycytosine RNA-binding protein 1 was detected via western blotting. A: Expression level of green fluorescently labeled PCBP1 in hFOB l. 19 cells was detected using an inverted fluorescence microscope; B: hFOB l. 19 cells were examined using a light microscope; C: Merging of A and B; D: Western blotting results of the protein expression level of polycytosine RNA-binding protein 1 in hFOB l. 19 cells. Data are presented as mean ± SD. aP < 0.05 vs control; cP < 0.05 vs empty vector virus control. Scale bar = 300 μm. PCBP1: Polycytosine RNA-binding protein 1.
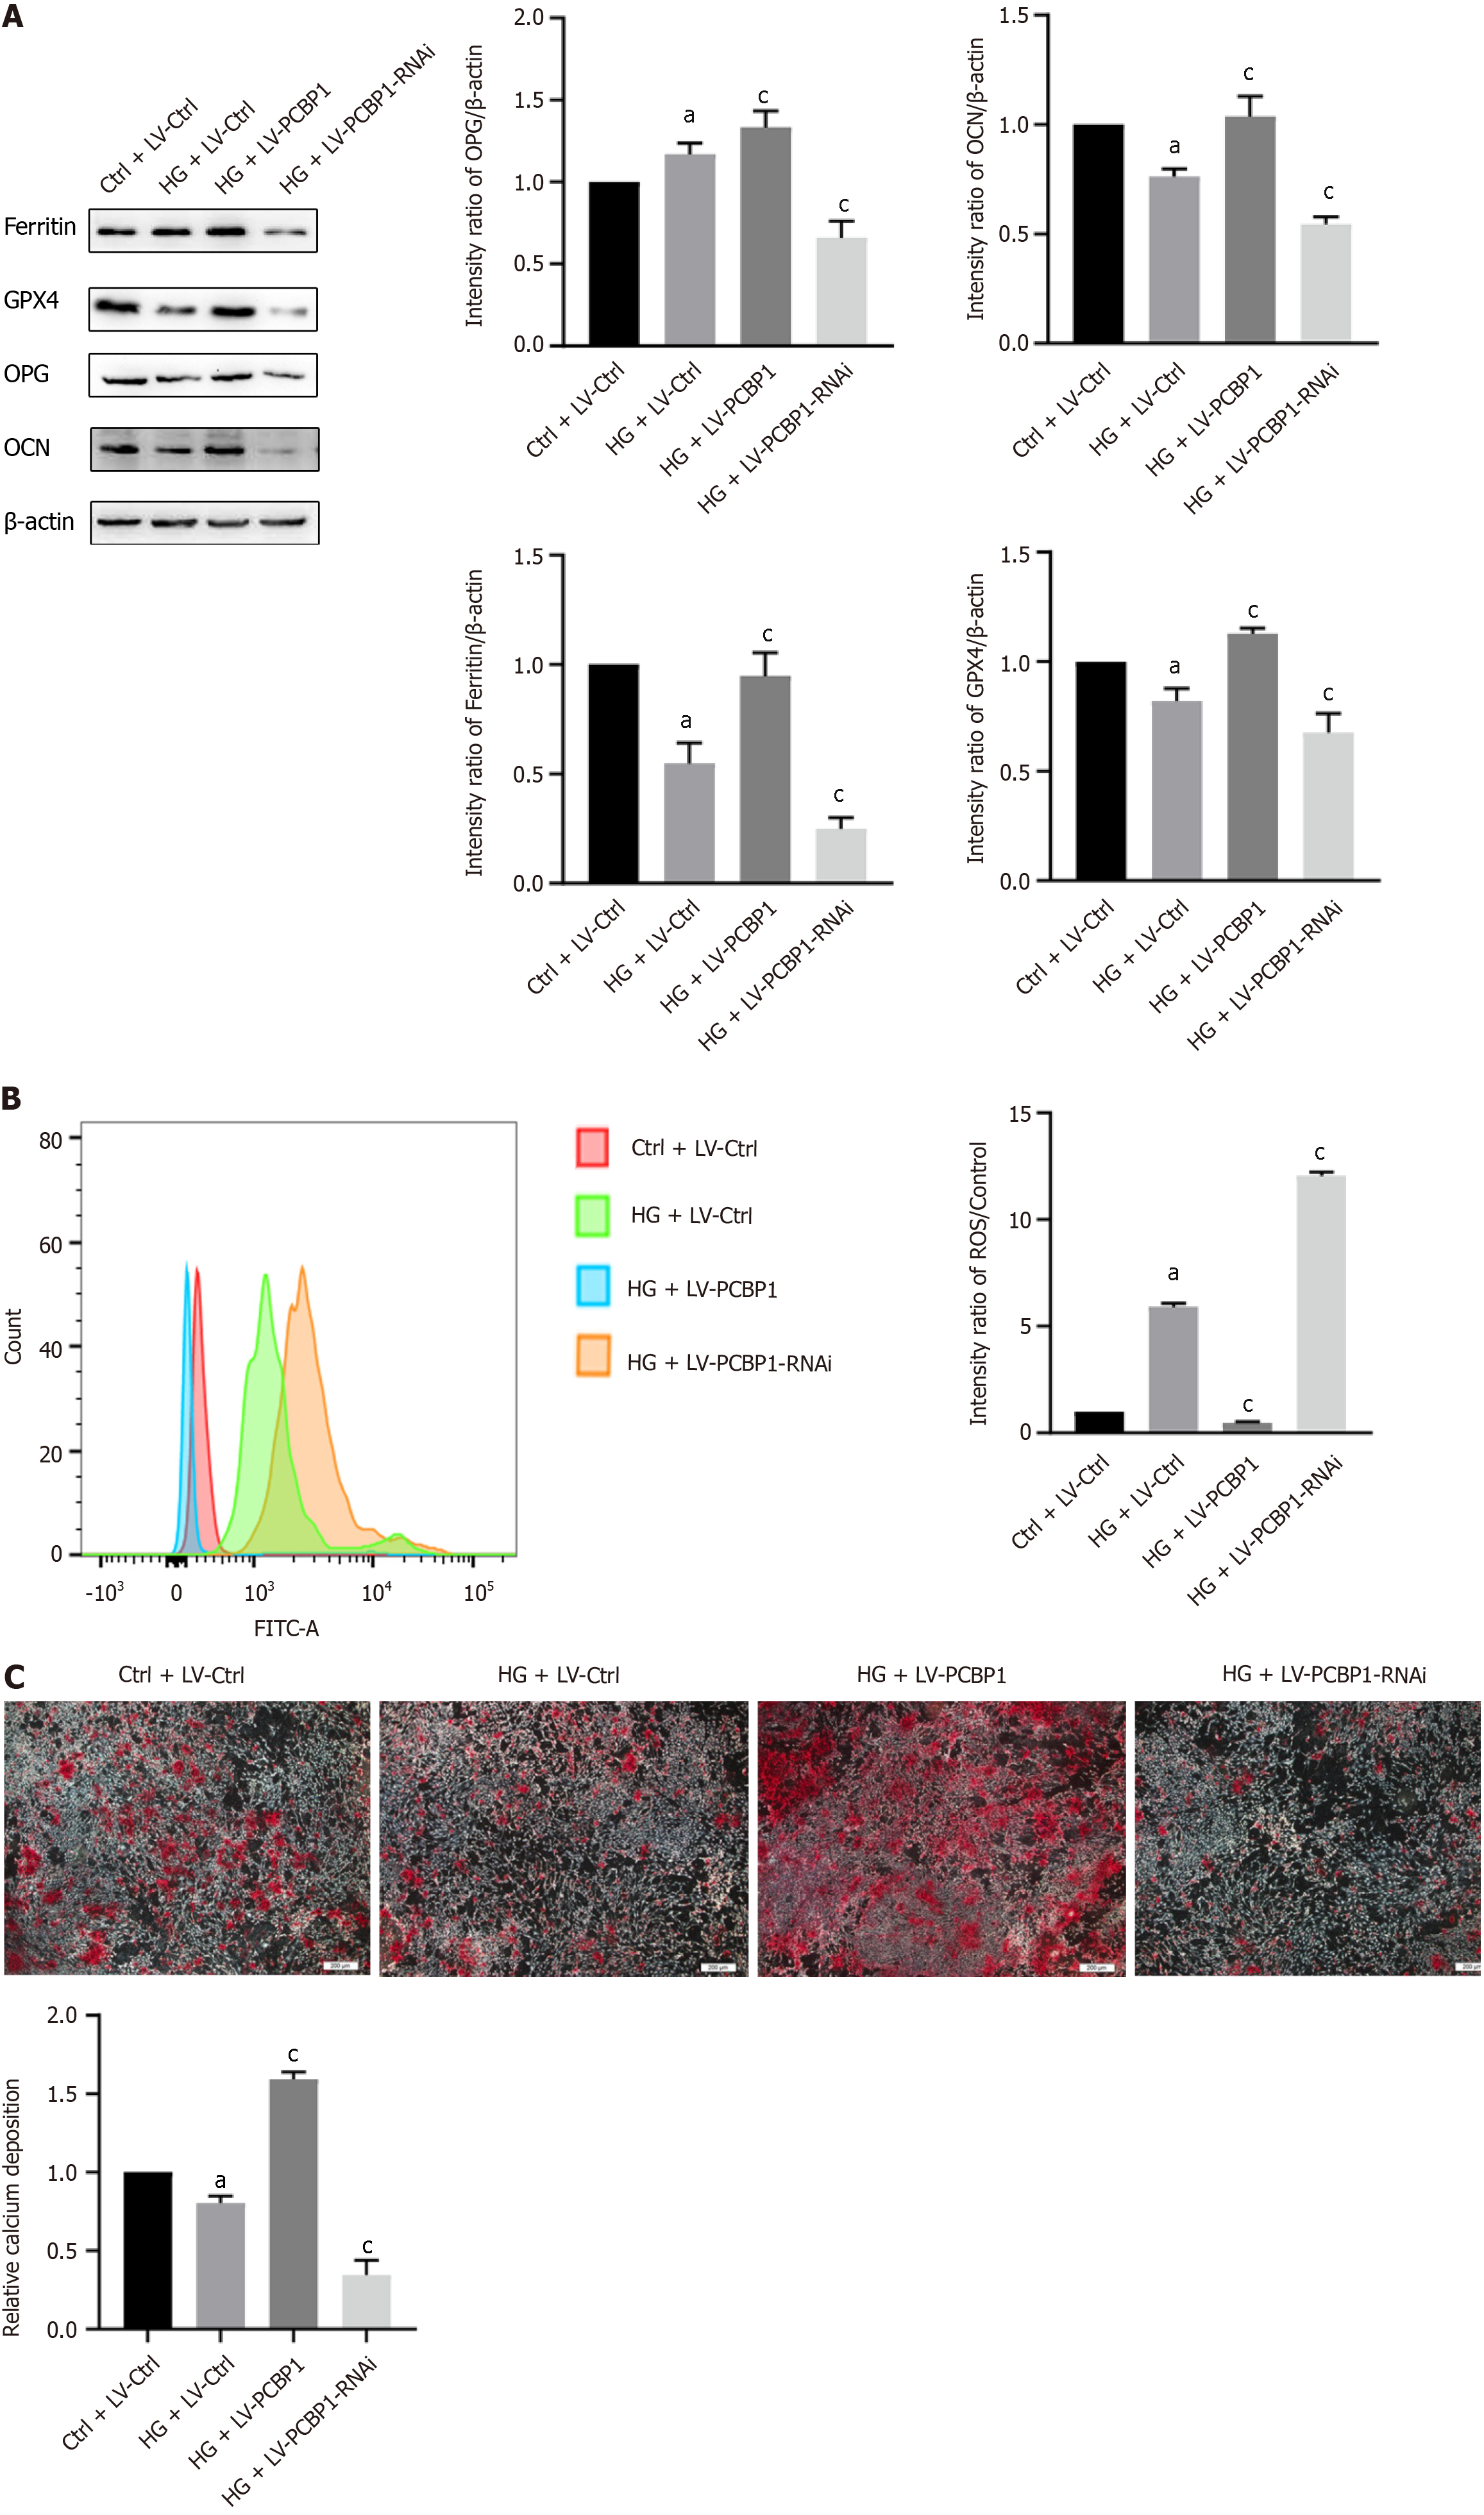
Figure 5 Polycytosine RNA-binding protein 1 regulation of osteoblastic ferroptosis in a high glucose environment.
A: Western blotting results showing the expression levels of ferritin, glutathione peroxidase 4, osteoprotegerin, and osteocalcin after polycytosine RNA-binding protein 1 (PCBP1) lentivirus transfection in a high glucose (HG) environment; B: Flow cytometry results showing the levels of reactive oxygen species after PCBP1 lentivirus transfection in a HG environment; C: Alizarin red calcium nodule staining identified the number of calcium nodules in osteoblasts after PCBP1 lentivirus transfection in a HG environment. Data are presented as the mean ± SD. aP < 0.05 vs empty vector virus control; cP < 0.05 vs empty vector virus HG. PCBP1: Polycytosine RNA-binding protein 1; HG: High glucose; GPX4: Glutathione peroxidase 4; OPG: Osteoprotegerin; OCN: Osteocalcin.
- Citation: Ma HD, Shi L, Li HT, Wang XD, Yang MW. Polycytosine RNA-binding protein 1 regulates osteoblast function via a ferroptosis pathway in type 2 diabetic osteoporosis. World J Diabetes 2024; 15(5): 977-987
- URL: https://www.wjgnet.com/1948-9358/full/v15/i5/977.htm
- DOI: https://dx.doi.org/10.4239/wjd.v15.i5.977


