Copyright
©The Author(s) 2024.
World J Diabetes. May 15, 2024; 15(5): 958-976
Published online May 15, 2024. doi: 10.4239/wjd.v15.i5.958
Published online May 15, 2024. doi: 10.4239/wjd.v15.i5.958
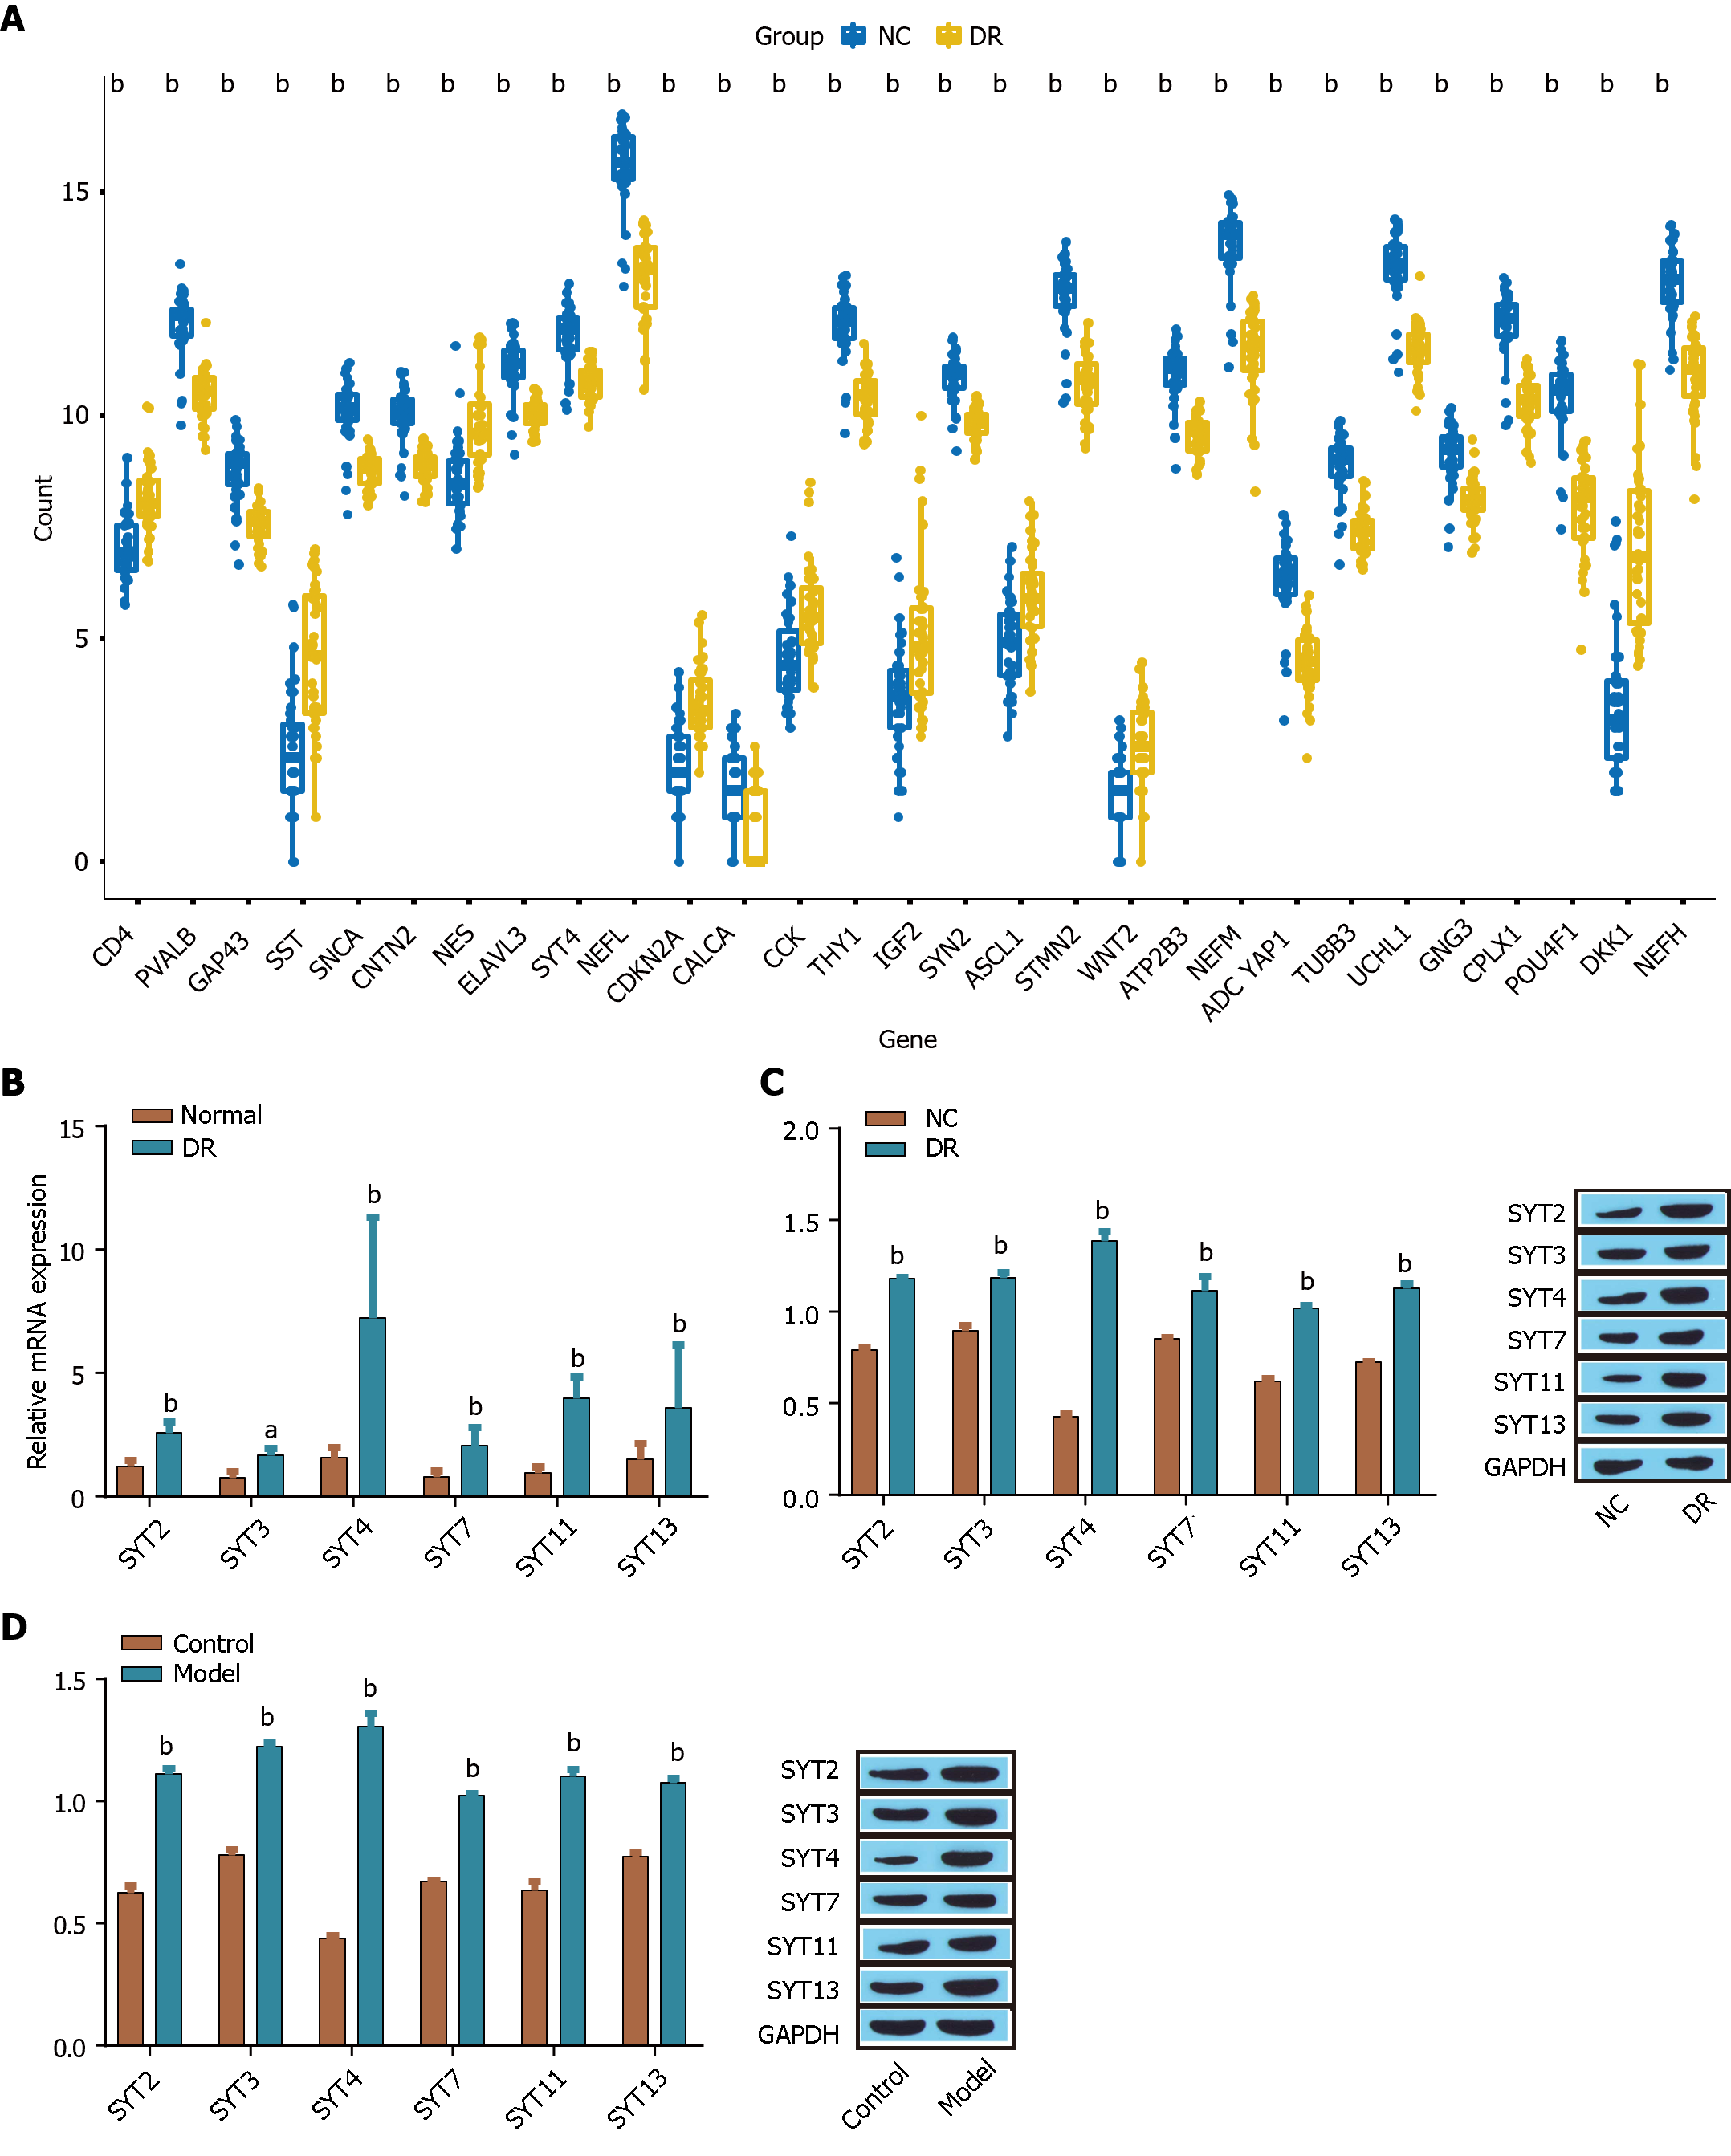
Figure 1 Expression of synaptotagmins family members in diabetic retinopathy.
A: The expression of synaptotagmins 1 (SYT1)-SYT17 was analyzed to identify differentially expressed proteins; B: The expression of SYT2, SYT3, SYT4, SYT7, SYT11, and SYT13 was measured via reverse transcriptase-polymerase chain reaction; C and D: The expression of SYT2, SYT3, SYT4, SYT7, SYT11, and SYT13 in ARPE-19 cells (C) induced by high glucose was detected by Western blot, and the expression in the retinas of diabetic retinopathy model mice (D) induced by streptozotocin was detected by Western blot. aP < 0.01, bP < 0.001, vs the normal group, control group, NC group. SYT: Synaptotagmins; DR: Diabetic retinopathy.
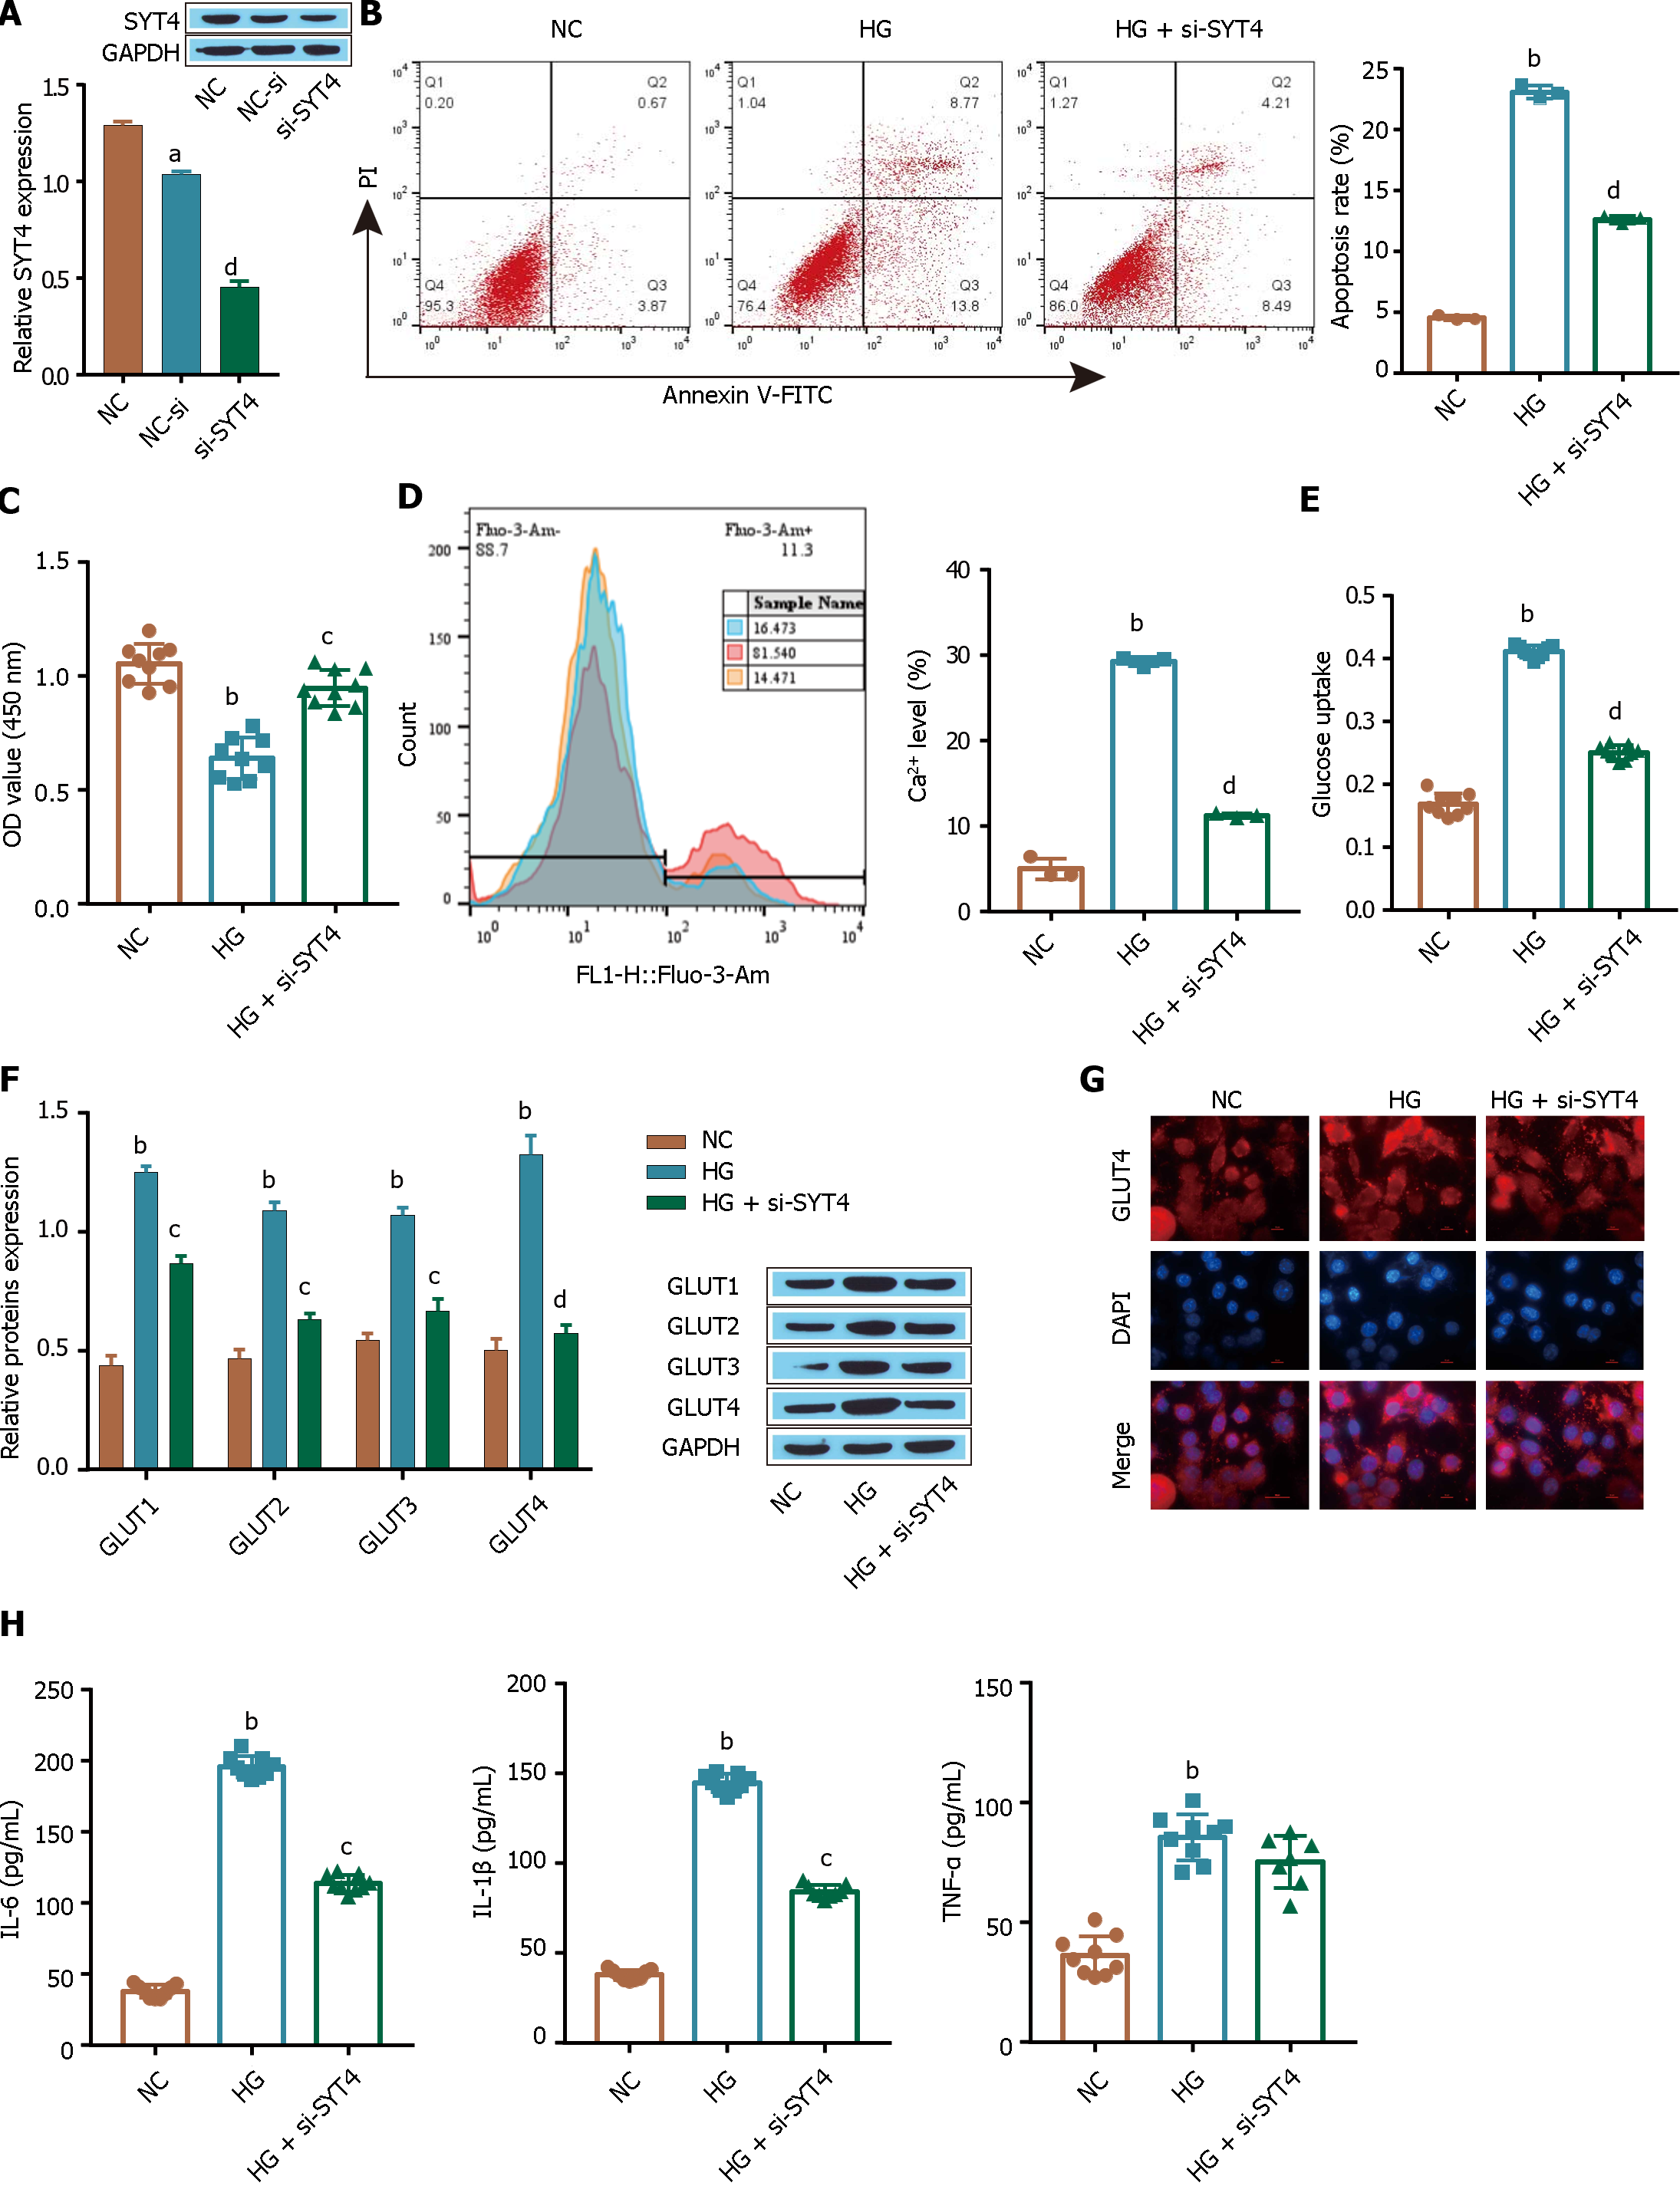
Figure 2 Synaptotagmins 4 promotes high glucose-induced cellular glucose uptake by ARPE-19 cells.
A: The expression of synaptotagmins 4 (SYT4) was detected via Western blot; B: Apoptosis was observed by flow cytometry; C: A Cell Counting Kit-8 assay was used to determine cell viability; D: Flow cytometry was used to determine intracellular Ca2+ levels; E: Glucose uptake levels were determined; F: Western blot was used to detect the glucose transporter; G: Immunofluorescence analysis was used to examine the extent of GLUT1 membrane translocation; H: The levels of inflammatory cytokines [tumour necrosis factor alpha, interleukin (IL)-1β, and IL-6] were measured via ELISA. aP < 0.05, bP < 0.001, vs the NC group; cP < 0.01, dP < 0.01 vs the NC group, HG group. SYT: Synaptotagmins; GLUT1: Glucose transporter-1; TNF-α: Tumour necrosis factor alpha; IL: Interleukin.
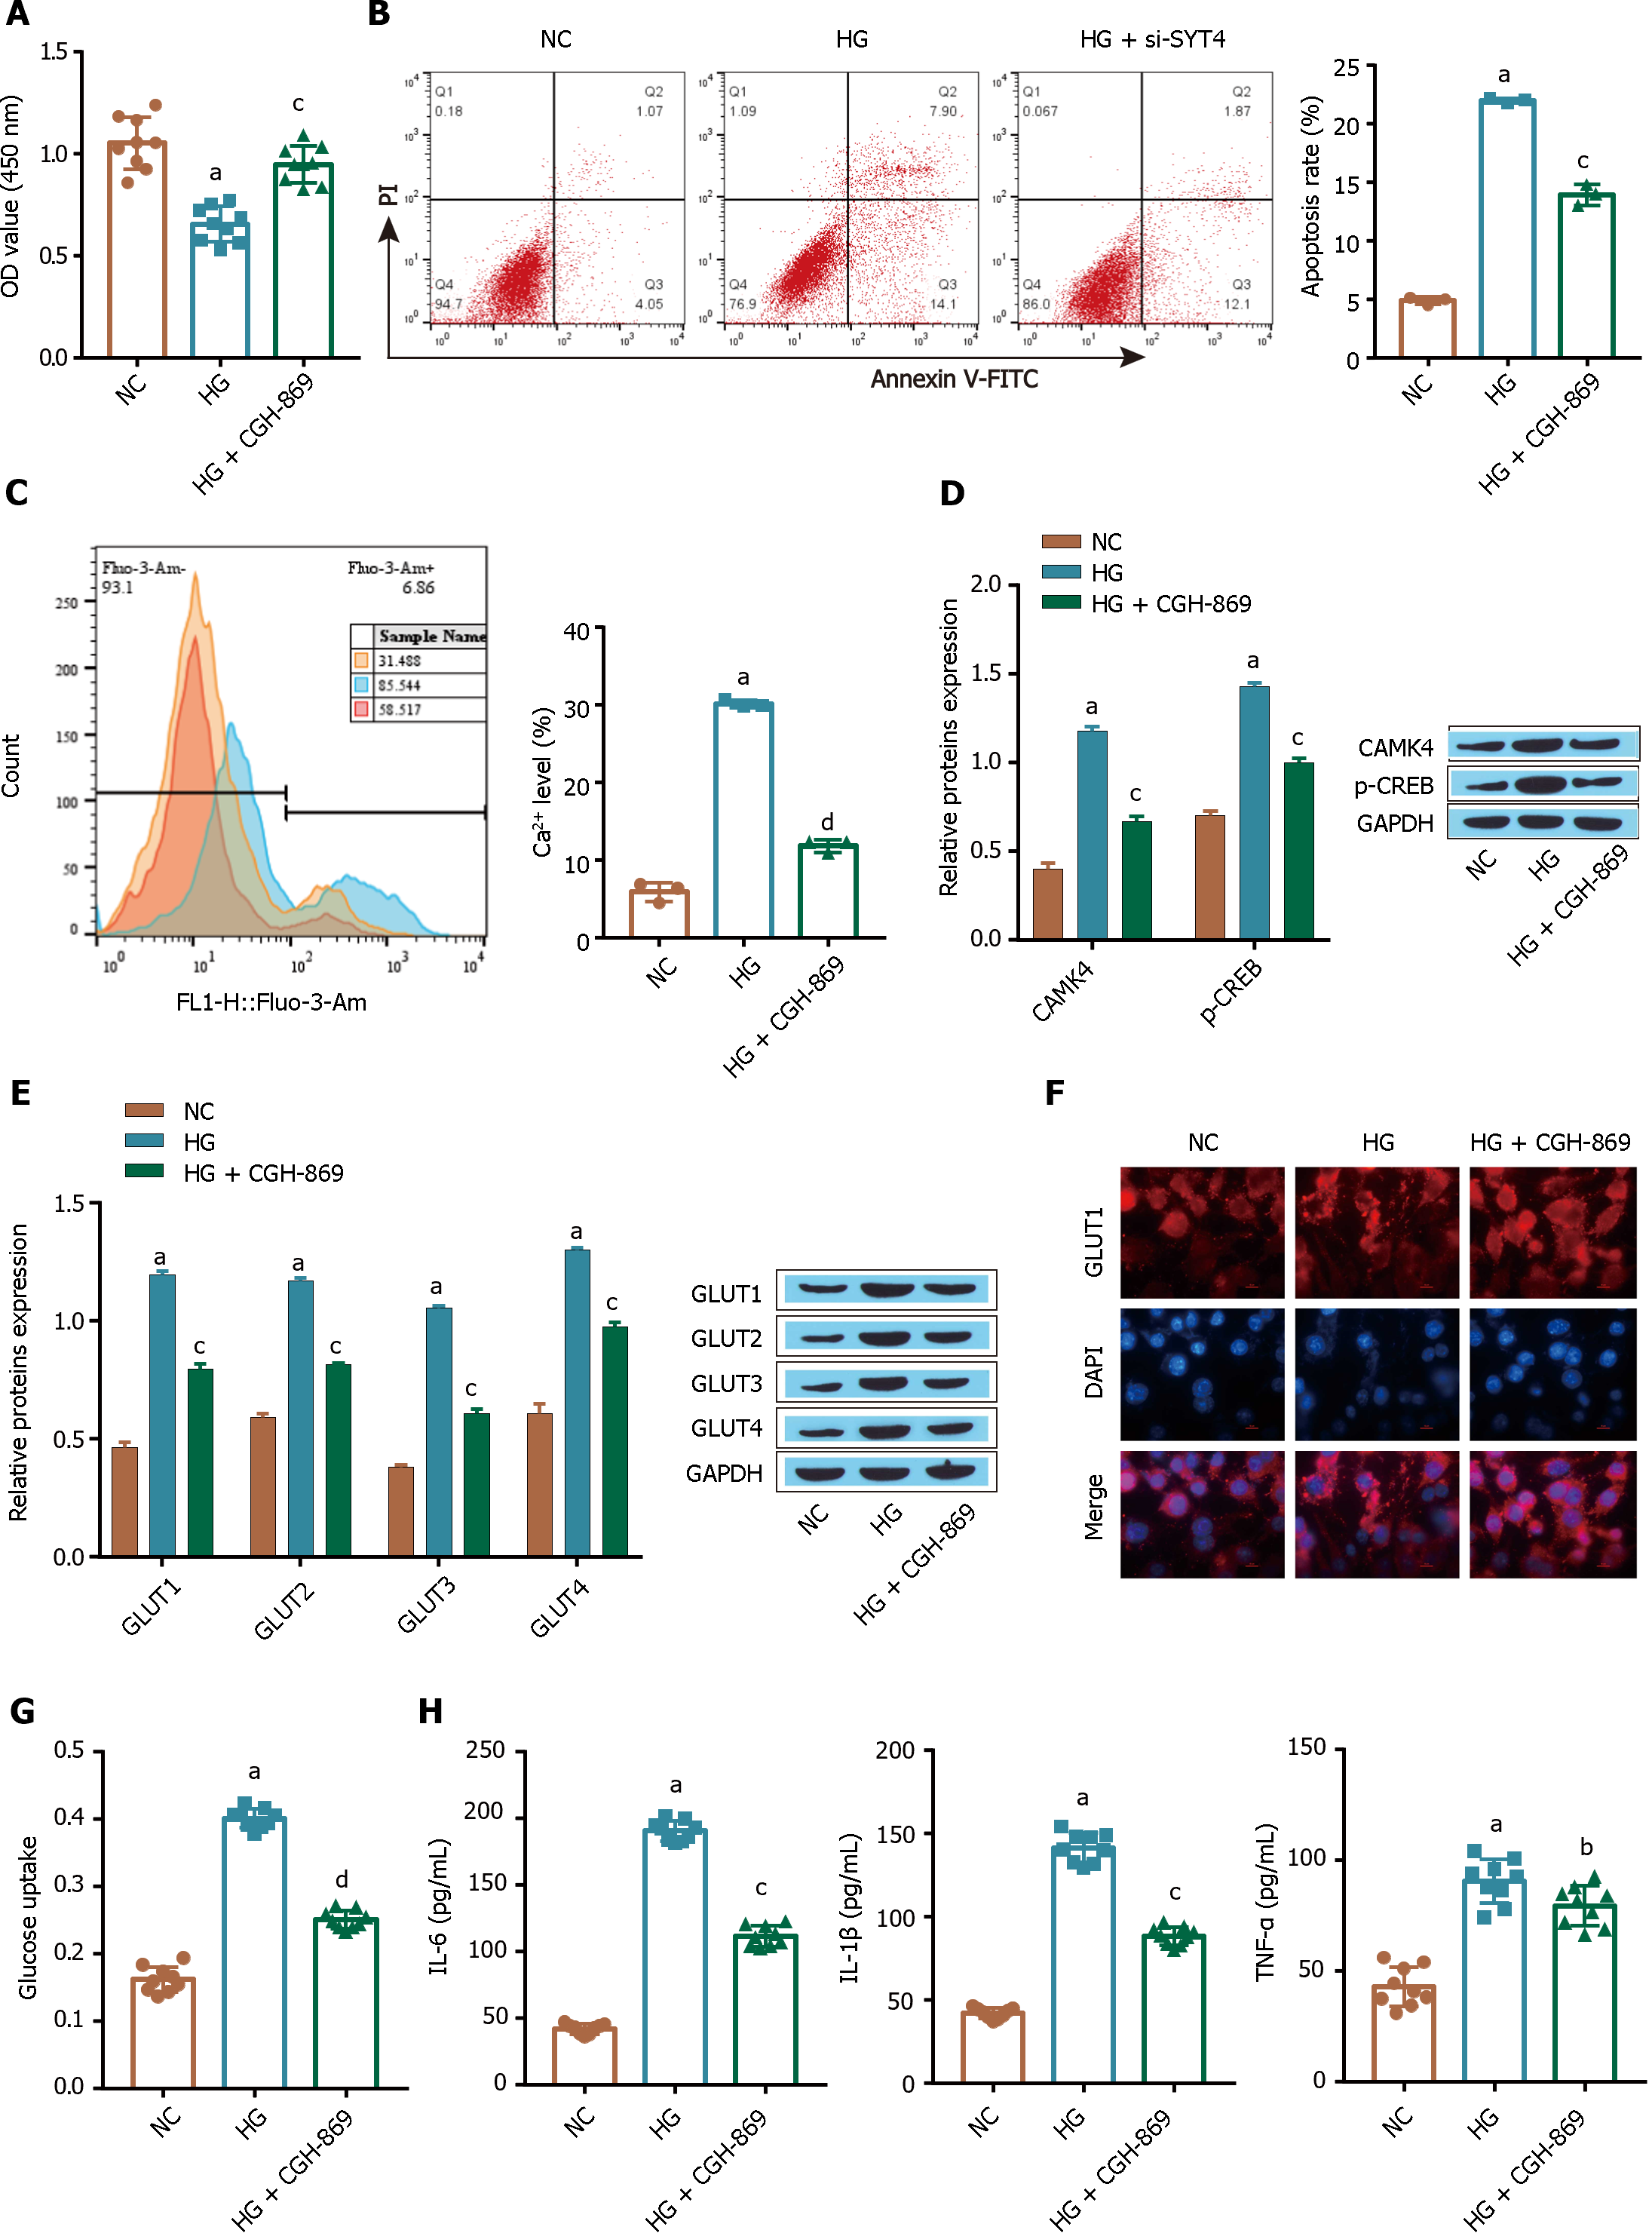
Figure 3 Ca2+ signaling is required for the increased glucose uptake by ARPE-19 cells in high glucose conditions.
A: A Cell Counting Kit-8 assay was used to determine cell viability; B: Flow cytometry was used to determine apoptosis; C: Intracellular Ca2+ levels were determined by flow cytometry; D: The Ca2+ signaling pathway-related proteins CAMK4 and p-CREB were detected via Western blot; E: The glucose transporter was detected via Western blot; F: The membrane translocation of GlUT1 was examined by immunofluorescence analysis; G: ELISA was used to measure the levels of inflammatory factors [tumour necrosis factor alpha, interleukin (IL)-1β, and IL-6]; H: ELISA was used to measure the level of glucose uptake. aP < 0.001, vs the NC group; bP < 0.01, cP < 0.01, dP < 0.001 vs the HG group. GLUT1: Glucose transporter-1; TNF-α: Tumour necrosis factor alpha; IL: Interleukin.
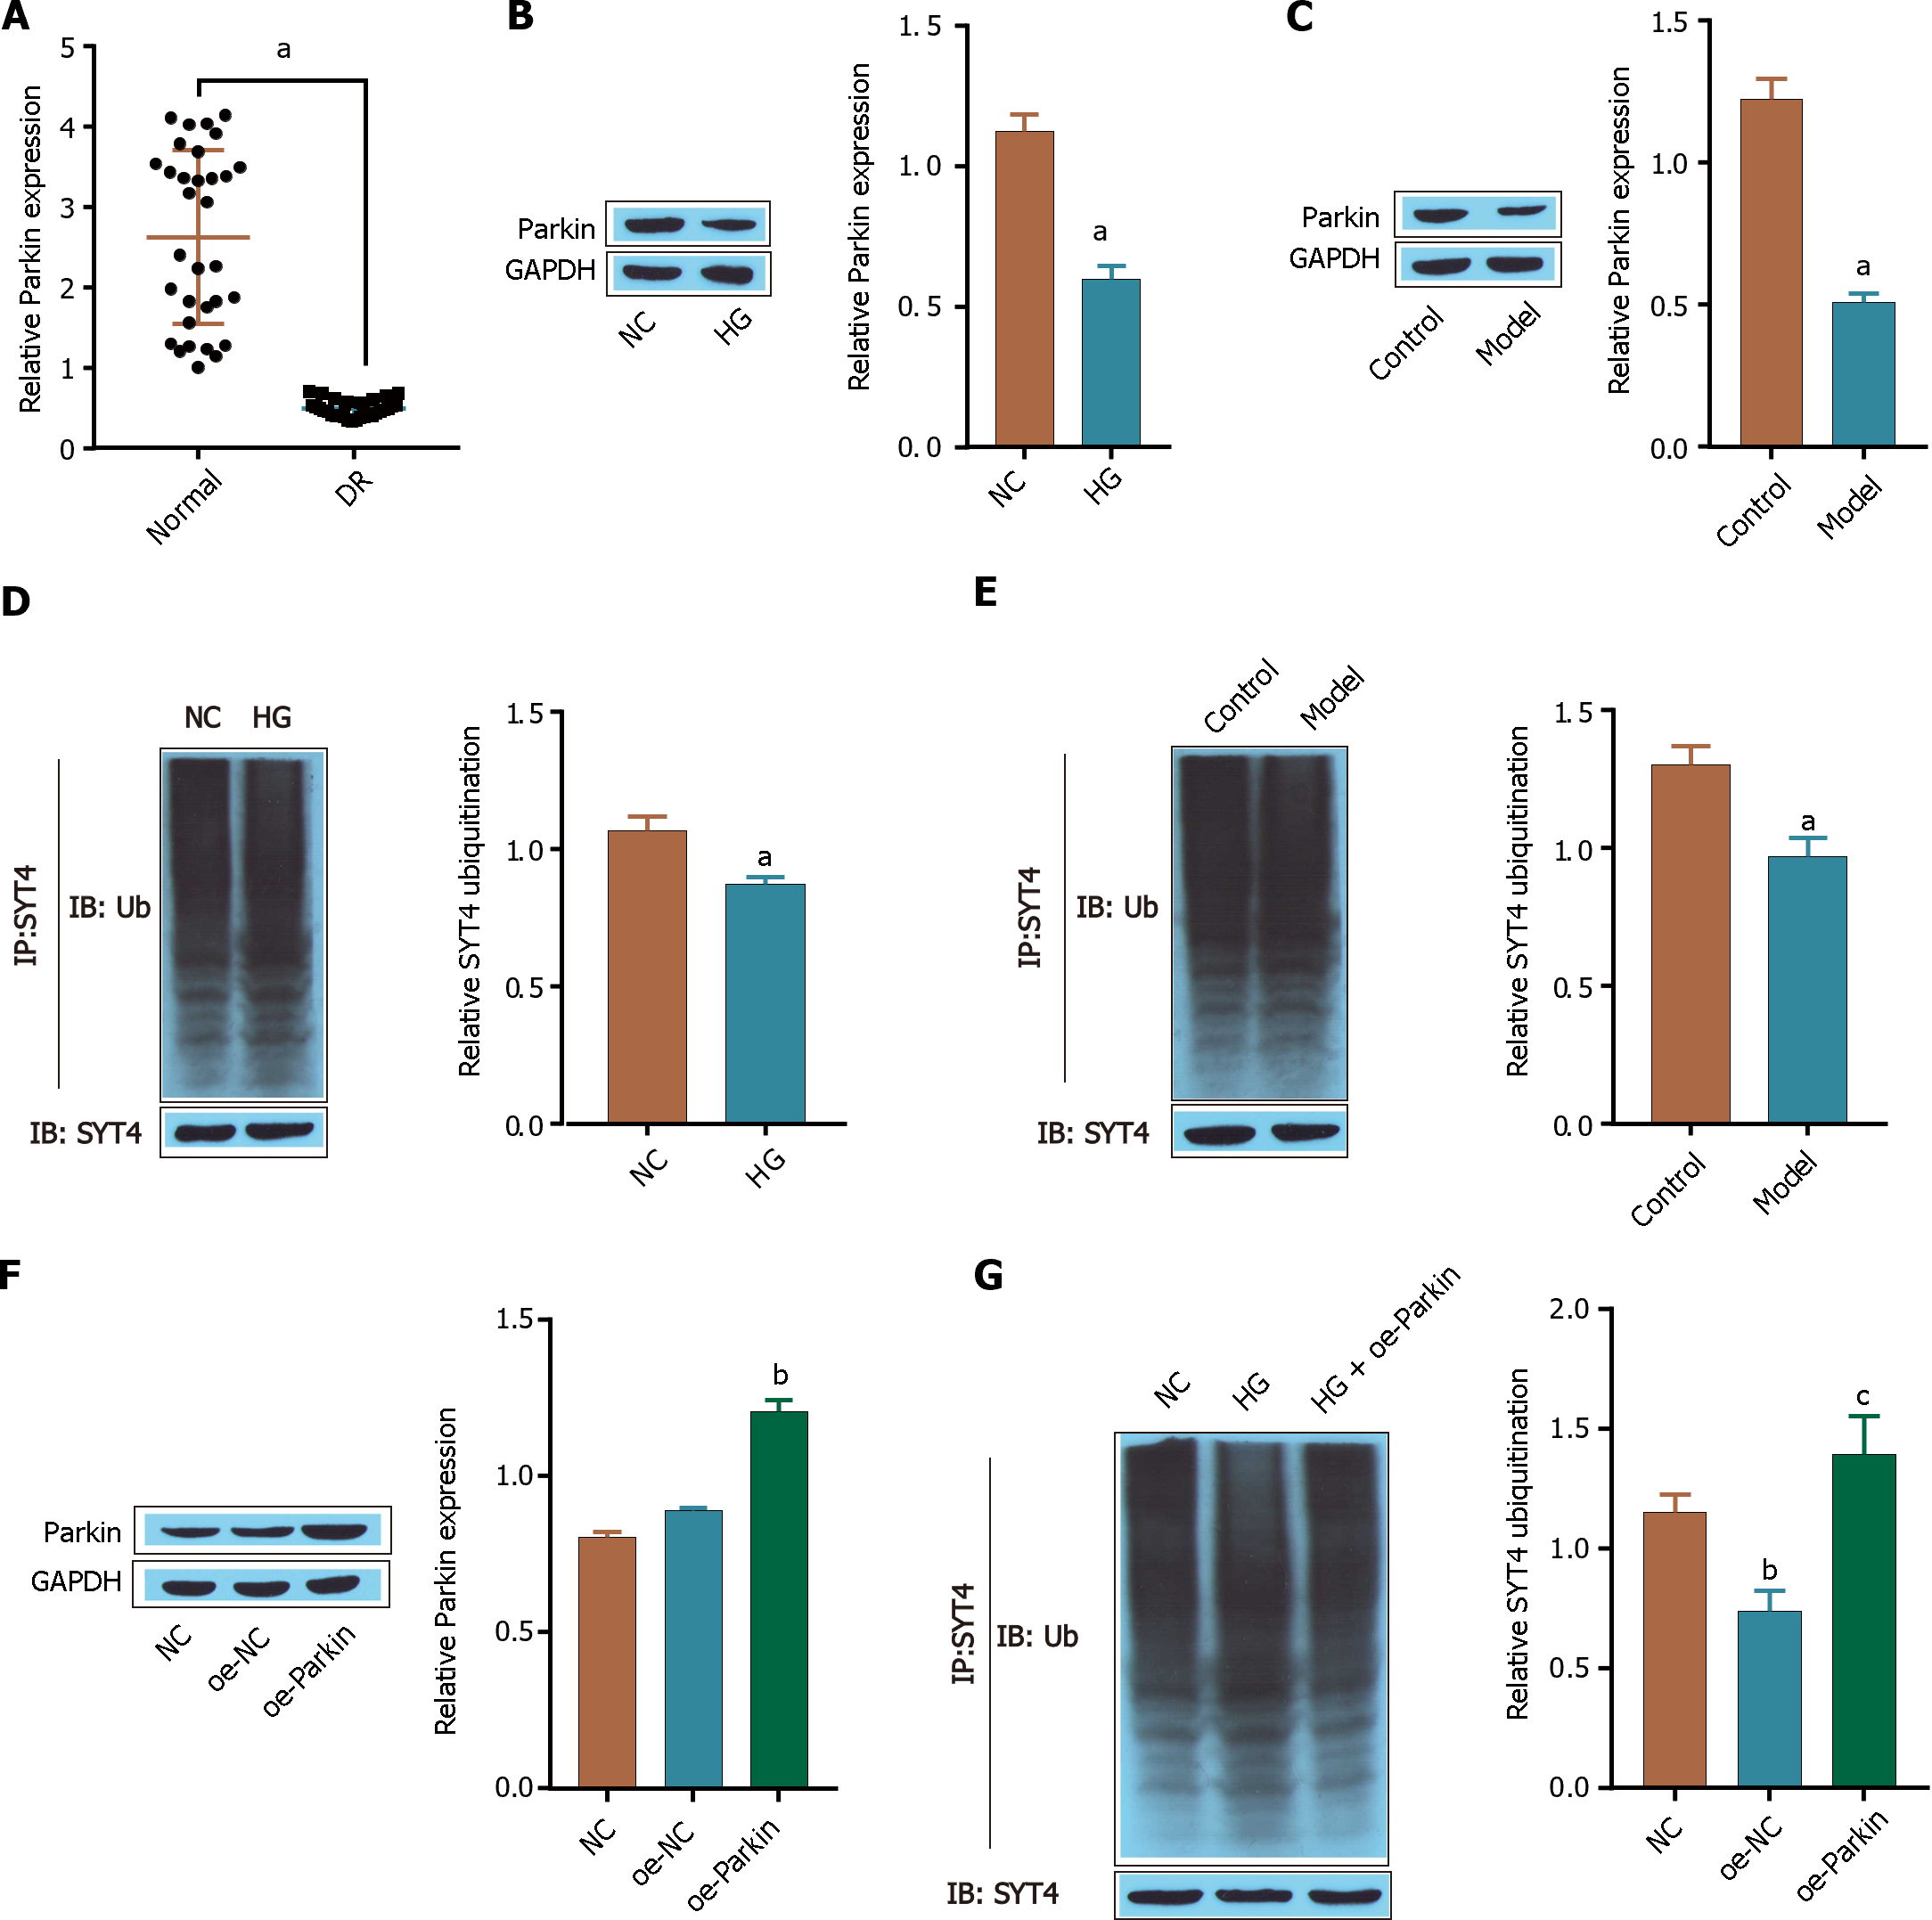
Figure 4 Parkin promotes the ubiquitination and degradation of synaptotagmins 4.
A: reverse transcriptase-polymerase chain reaction was used to measure the expression of Parkin; B: Western blot was used to detect the expression of Parkin in cells; C: Western blot was used to determine the expression of Parkin in the tissues of the mice; D: Western blot was used to determine the level of synaptotagmins 4 (SYT4) ubiquitination in cells; E: Western blot was used to determine the level of SYT4 ubiquitination in the tissues of mice; F: The transfection efficiency of oe-Parkin was detected via Western blot; G: The level of SYT4 ubiquitination in cells was detected via Western blot. aP < 0.05, bP < 0.01, cP < 0.001, vs normal group, control group, NC group; cP < 0.001, vs HG group. SYT: Synaptotagmins; DR: Diabetic retinopathy; TNF-α: Tumour necrosis factor alpha; IL: Interleukin.
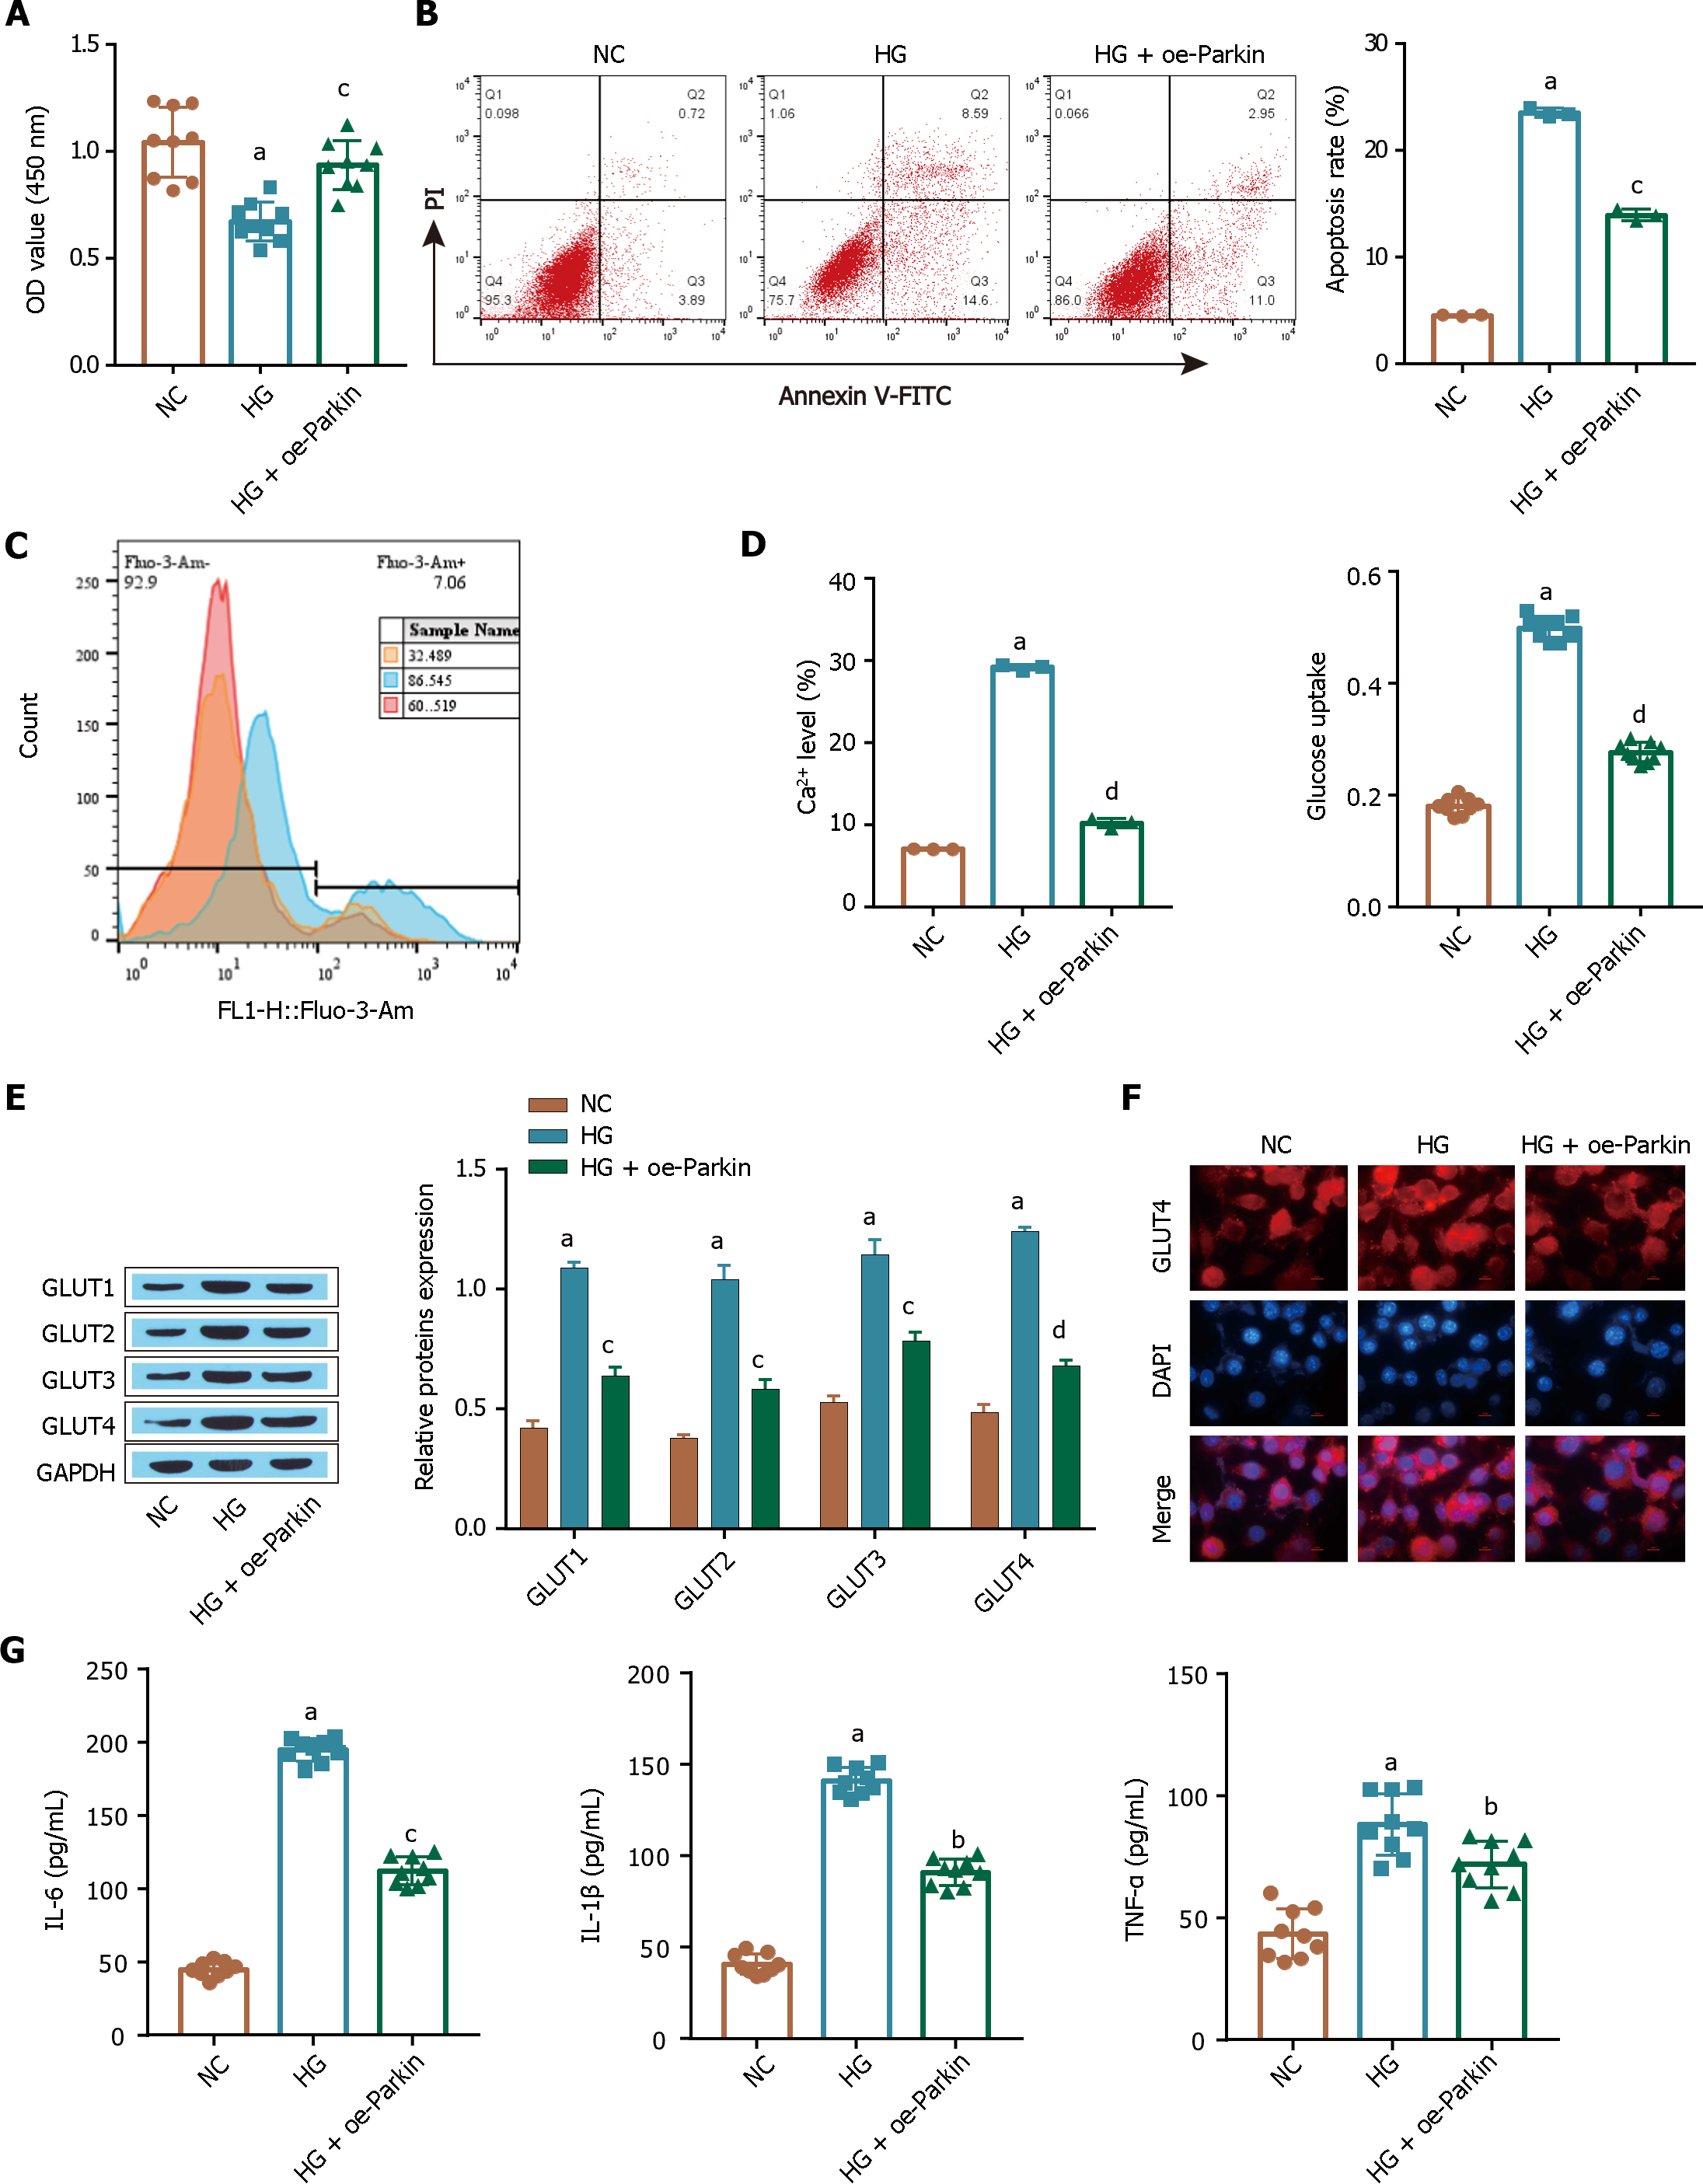
Figure 5 Parkin overexpression inhibits the excessive glucose uptake by ARPE-19 cells induced by high glucose.
A: A Cell Counting Kit-8 assay was used to determine cell viability; B: Flow cytometry was used to determine apoptosis; C: Intracellular Ca2+ levels were determined by flow cytometry; D: Glucose uptake was detected by a kit; E: GLUT1 expression was detected via Western blot; F: The extent of glucose transporter-1 membrane transfer was examined by immunofluorescence analysis; G: The levels of inflammatory factors [tumour necrosis factor alpha, interleukin (IL)-1β, and IL-6] were measured via ELISA. aP < 0.001, vs the NC group; bP < 0.01, cP < 0.01, dP < 0.001 vs the HG group. GLUT1: Glucose transporter-1; TNF-α: Tumour necrosis factor alpha; IL: Interleukin.
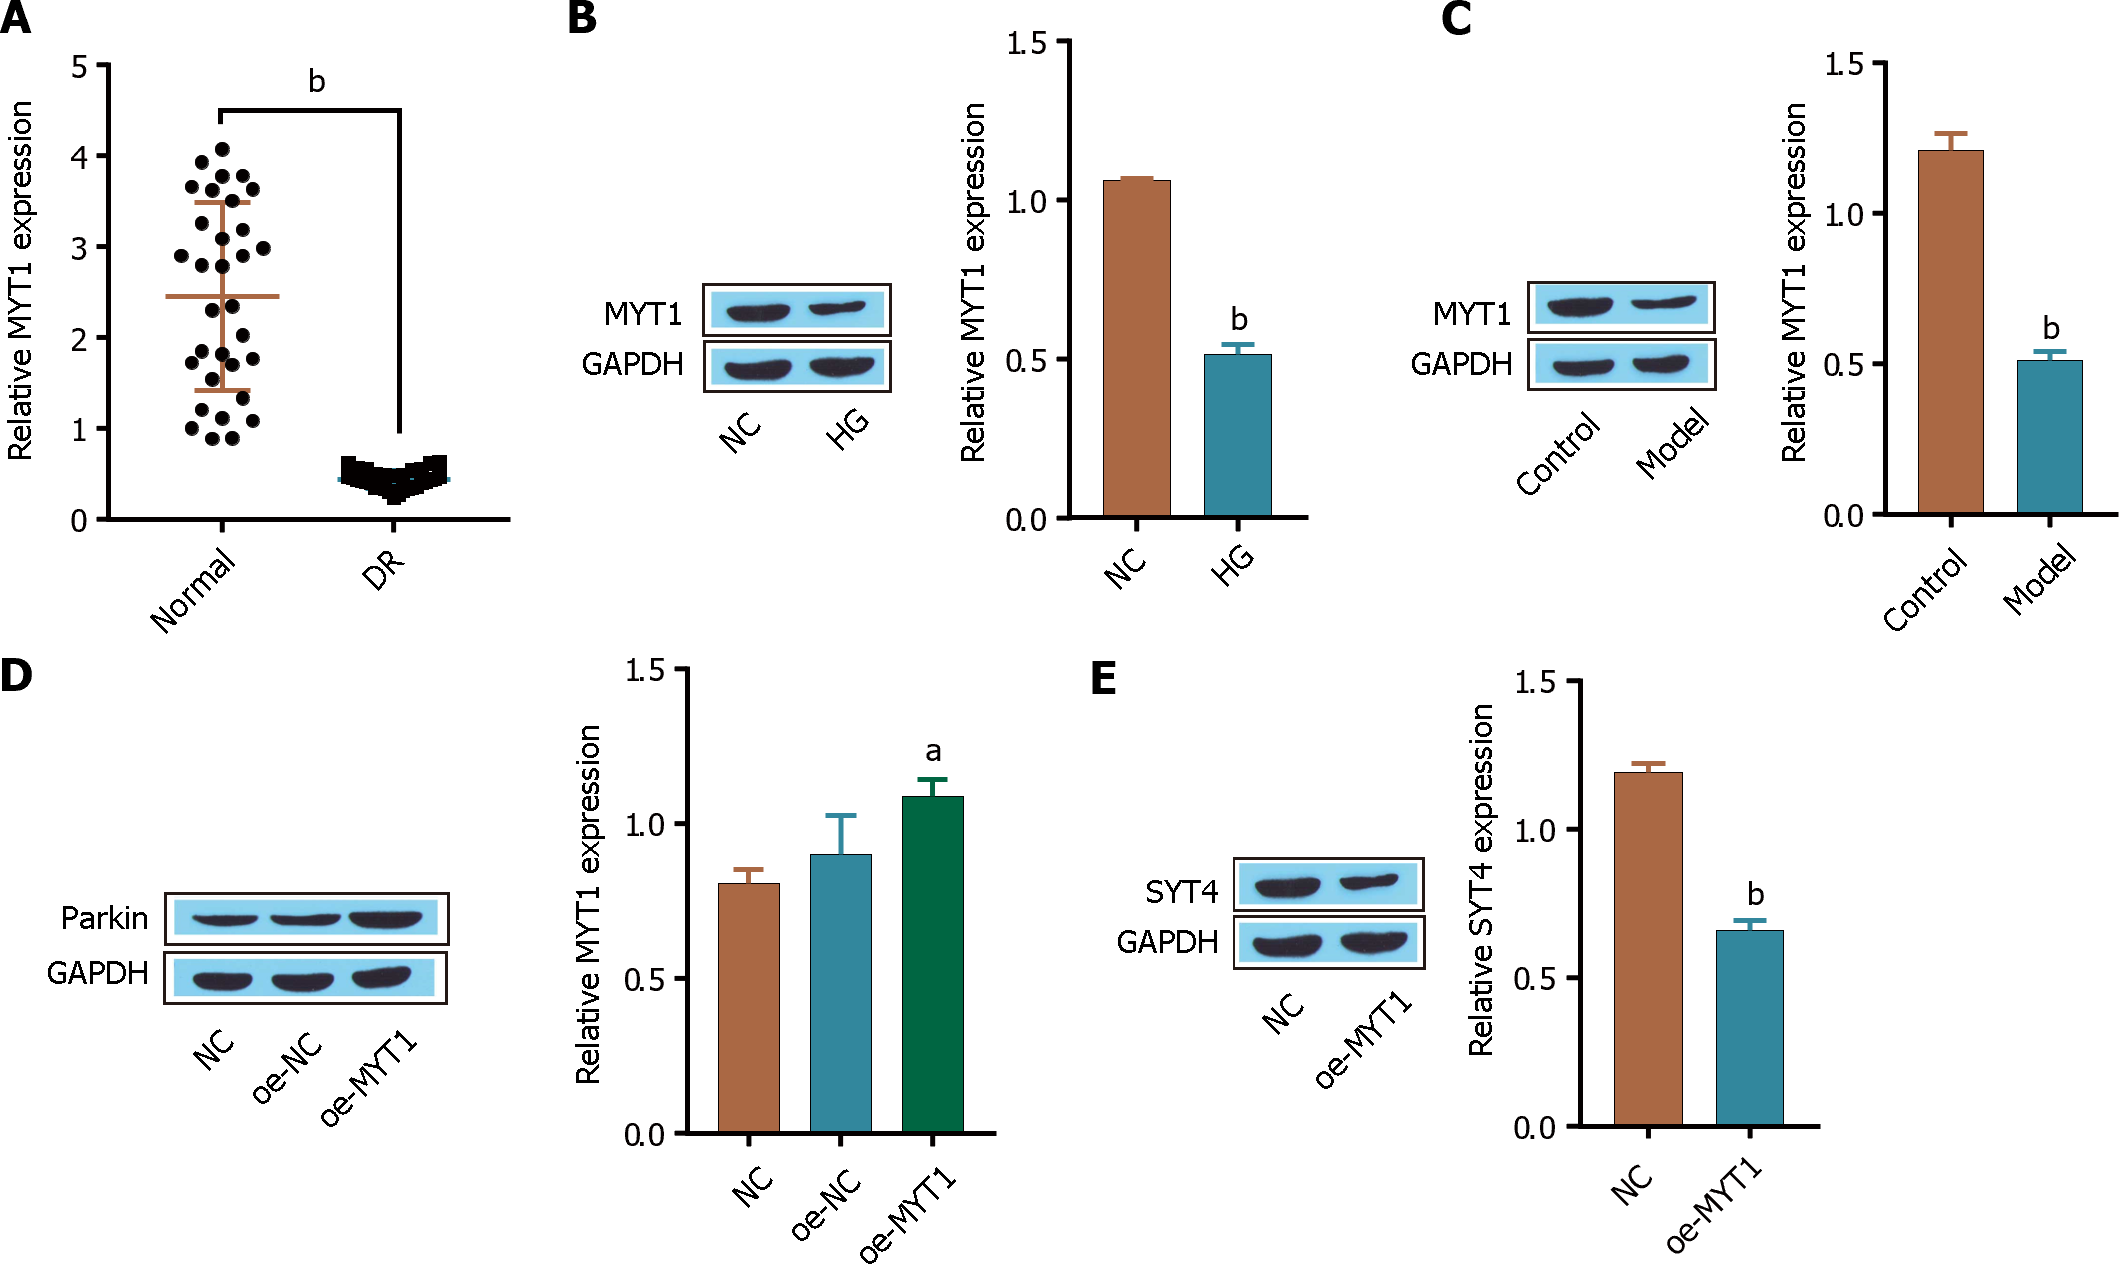
Figure 6 The transcription factor myelin transcription factor 1 regulates synaptotagmins 4 expression.
A: reverse transcriptase-polymerase chain reaction was used to measure the expression of myelin transcription factor 1 (MYT1); B: Western blot was used to detect the expression of MYT1 in cells; C: Western blot was used to determine the expression of MYT1 in mouse tissues; D: Western blot was used to determine the transfection efficiency of MYT1 in cells; E: The expression of synaptotagmins 4 was detected by Western blot. aP < 0.05, bP < 0.001, vs normal group, control group, NC group. DR: Diabetic retinopathy; MYT1: Myelin transcription factor 1.
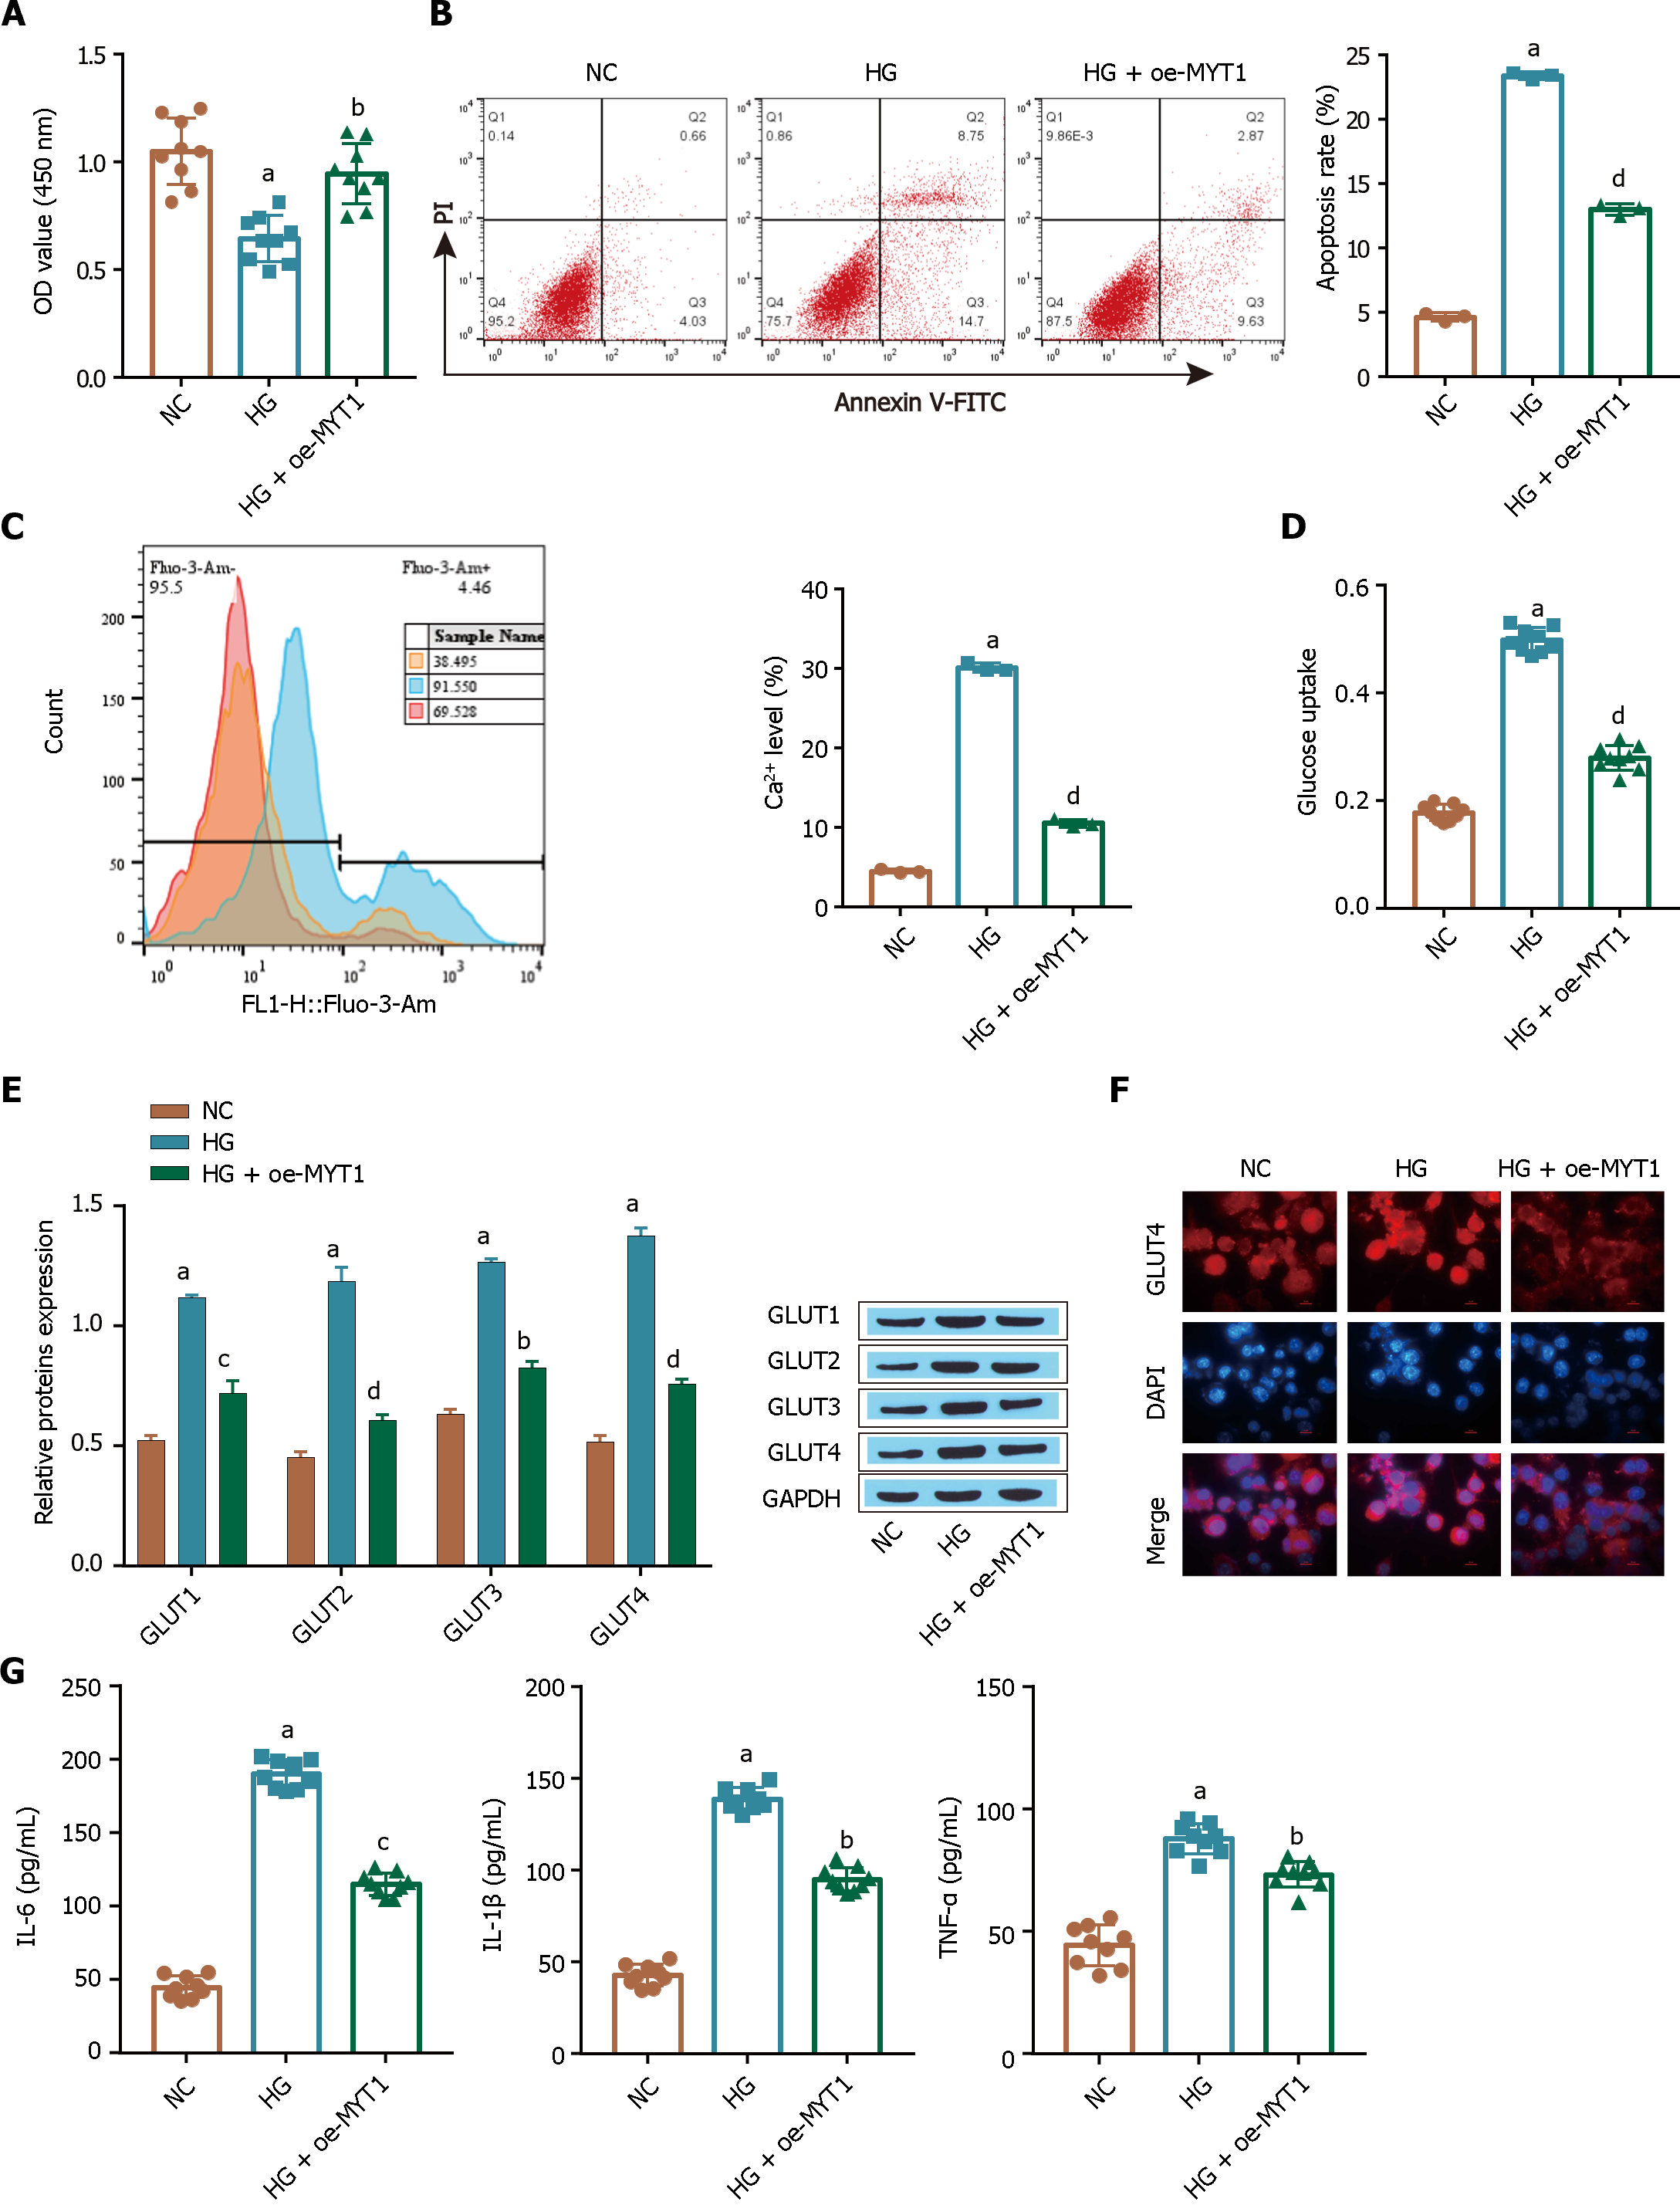
Figure 7 Myelin transcription factor 1 overexpression inhibits high glucose-induced cellular glucose uptake by ARPE-19 cells.
A: A Cell Counting Kit-8 assay was used to determine cell viability; B: Flow cytometry was used to determine apoptosis; C: Intracellular Ca2+ levels were determined by flow cytometry; D: Glucose uptake was detected by a kit; E: Glucose transporter-1 (GLUT1) expression was detected via Western blot; F: The extent of GlUT1 membrane transfer was examined by immunofluorescence analysis; G: The levels of inflammatory factors [tumour necrosis factor alpha, interleukin (IL)-1β, and IL-6] were measured via ELISA. aP < 0.001, vs the NC group; bP < 0.01, cP < 0.01, dP < 0.001 vs the HG group. MYT1: Myelin transcription factor 1; GLUT1: Glucose transporter-1; TNF-α: Tumour necrosis factor alpha; IL: Interleukin.
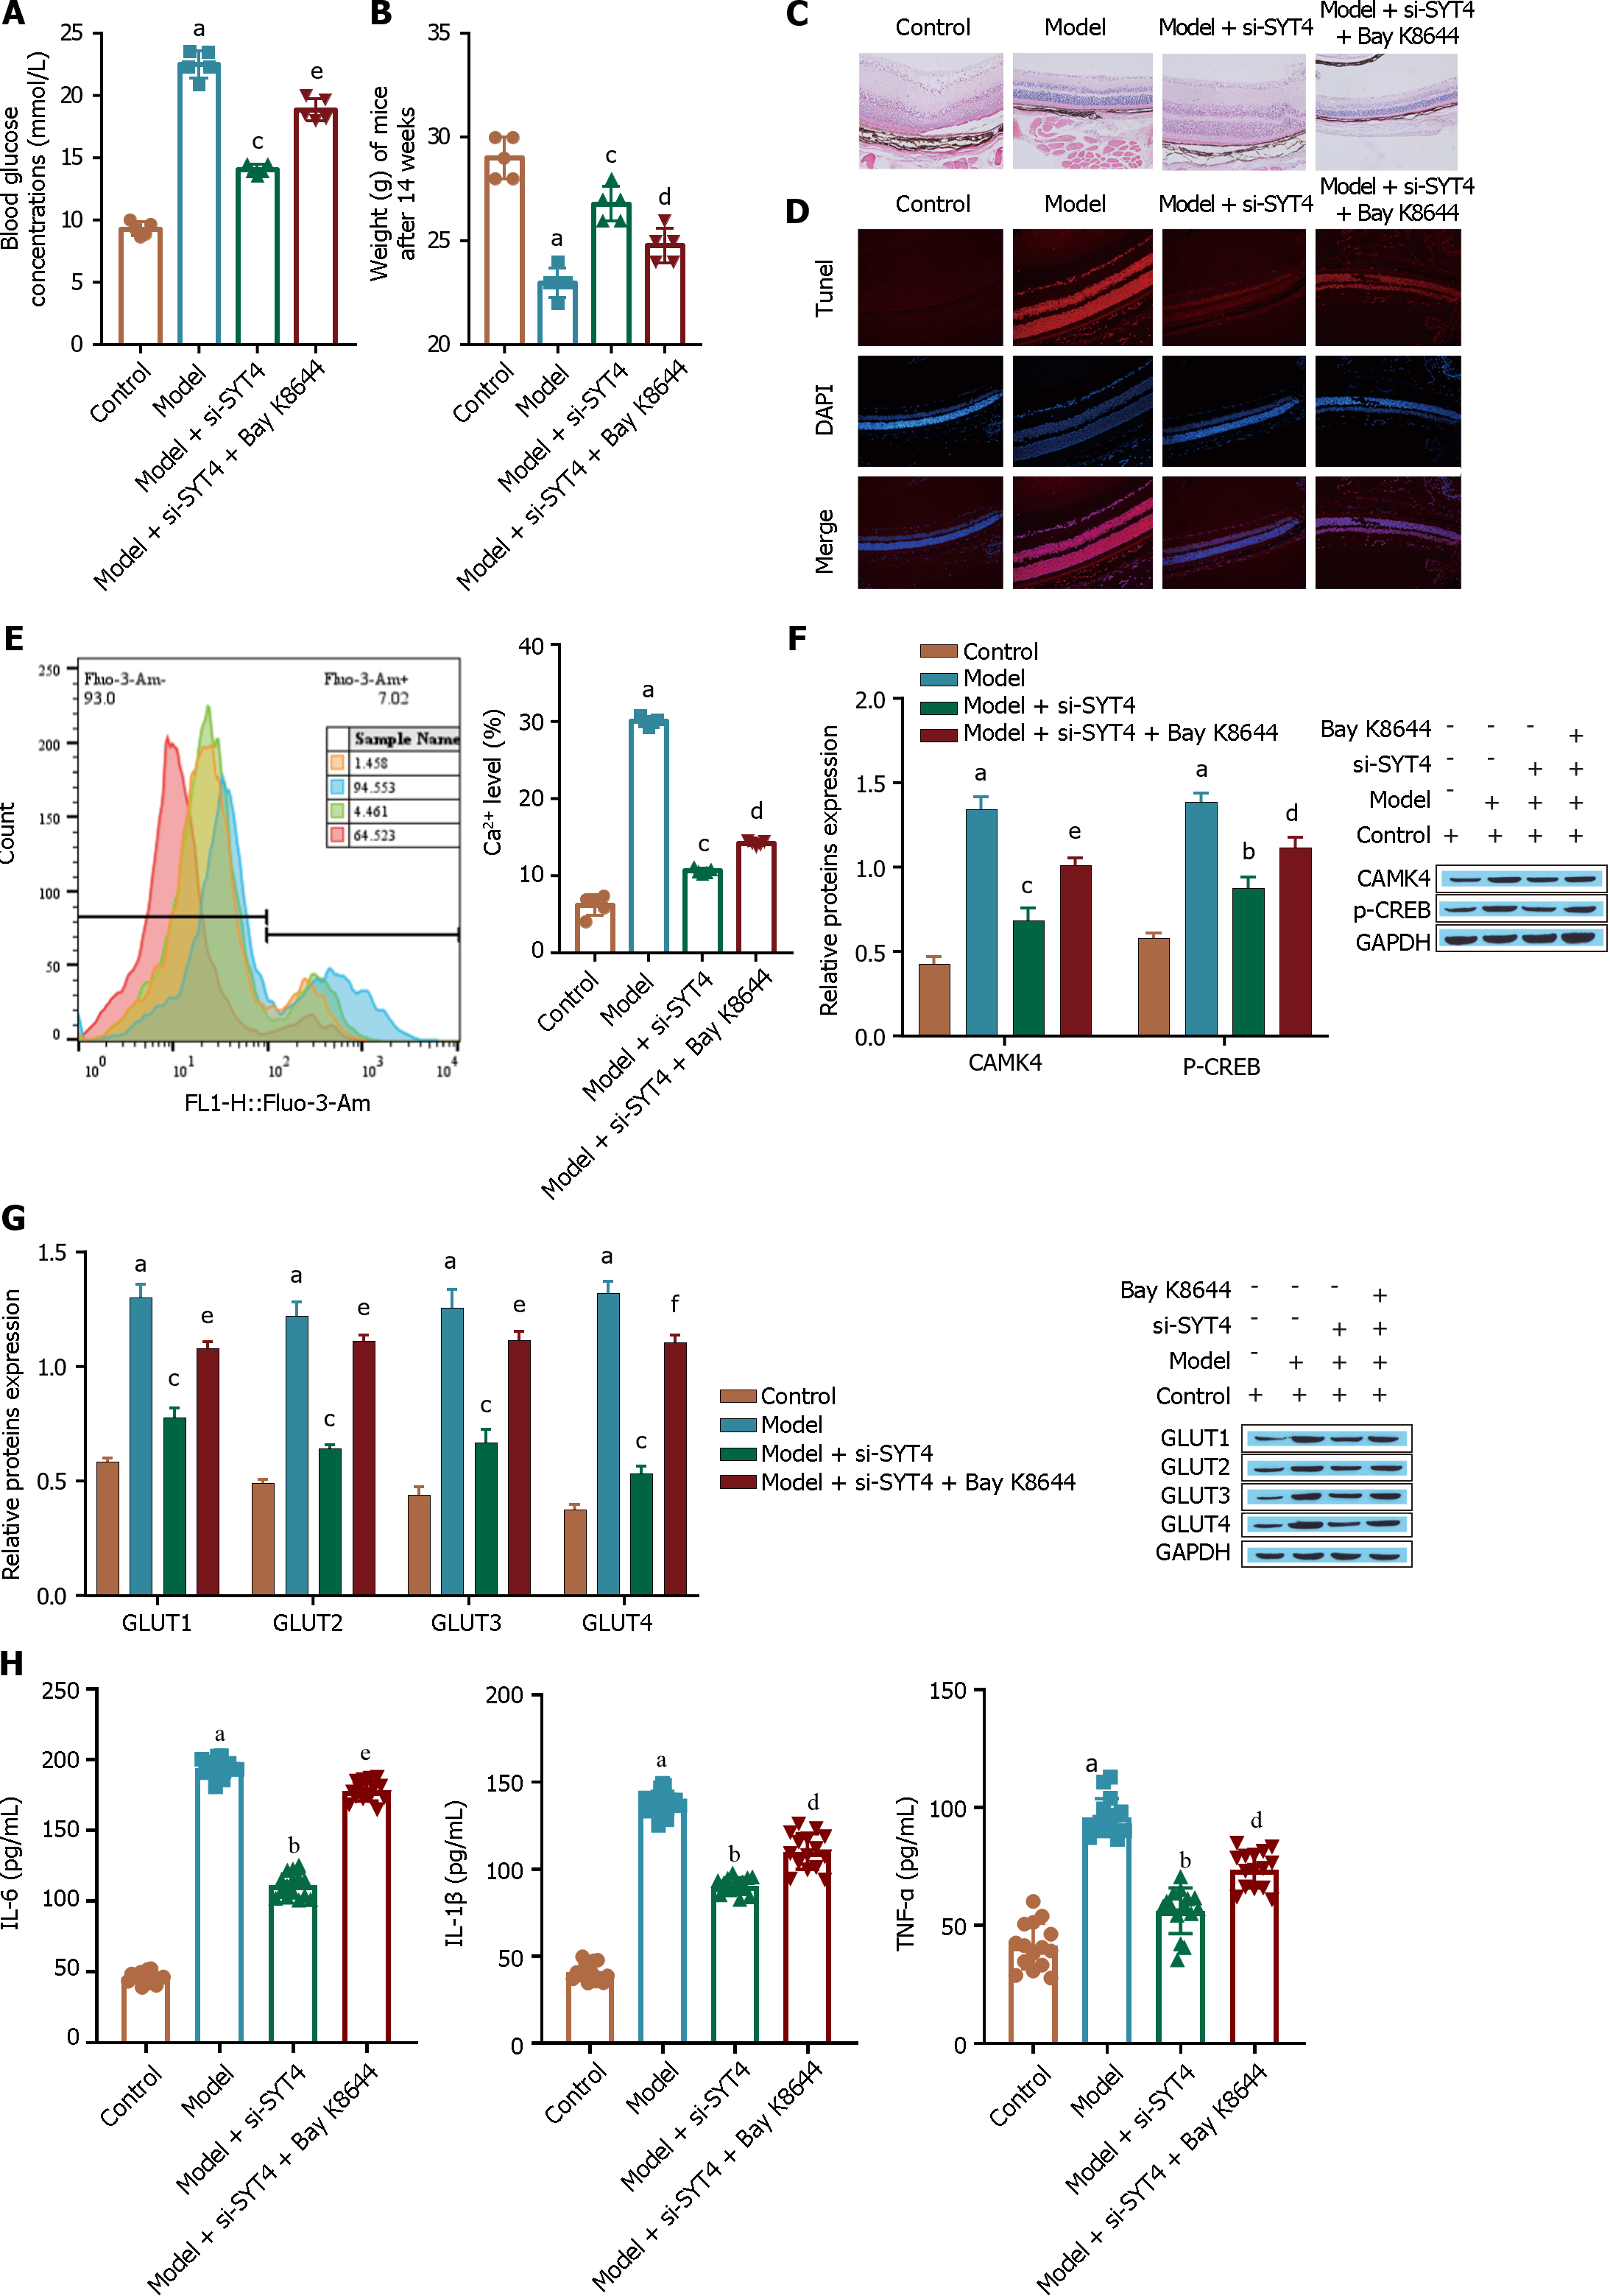
Figure 8 Animal experiment to verify the inhibition of diabetic retinopathy by synaptotagmins 4 knockdown.
A: A kit was used to measure the blood glucose levels of the mice; B: Electronic weighing was used to evaluate the mice; C: HE staining was used to observe retinal structure; D: TUNEL staining was performed to evaluate cell apoptosis; E: Flow cytometry was used to determine Ca2+ levels; F: Western blot was used to detect the Ca2+ signaling pathway-related proteins CAMK4 and p-CREB; G: The glucose transporter was detected via Western blot; H: The levels of inflammatory cytokines [tumour necrosis factor alpha, interleukin (IL)-1β, and IL-6] were measured via ELISA. aP < 0.001, vs the control group; bP < 0.01, cP < 0.001 vs the model group; dP < 0.05, eP < 0.01, fP < 0.001 vs the model + si- synaptotagmins 4 group. SYT: Synaptotagmins; TNF-α: Tumour necrosis factor alpha; IL: Interleukin.
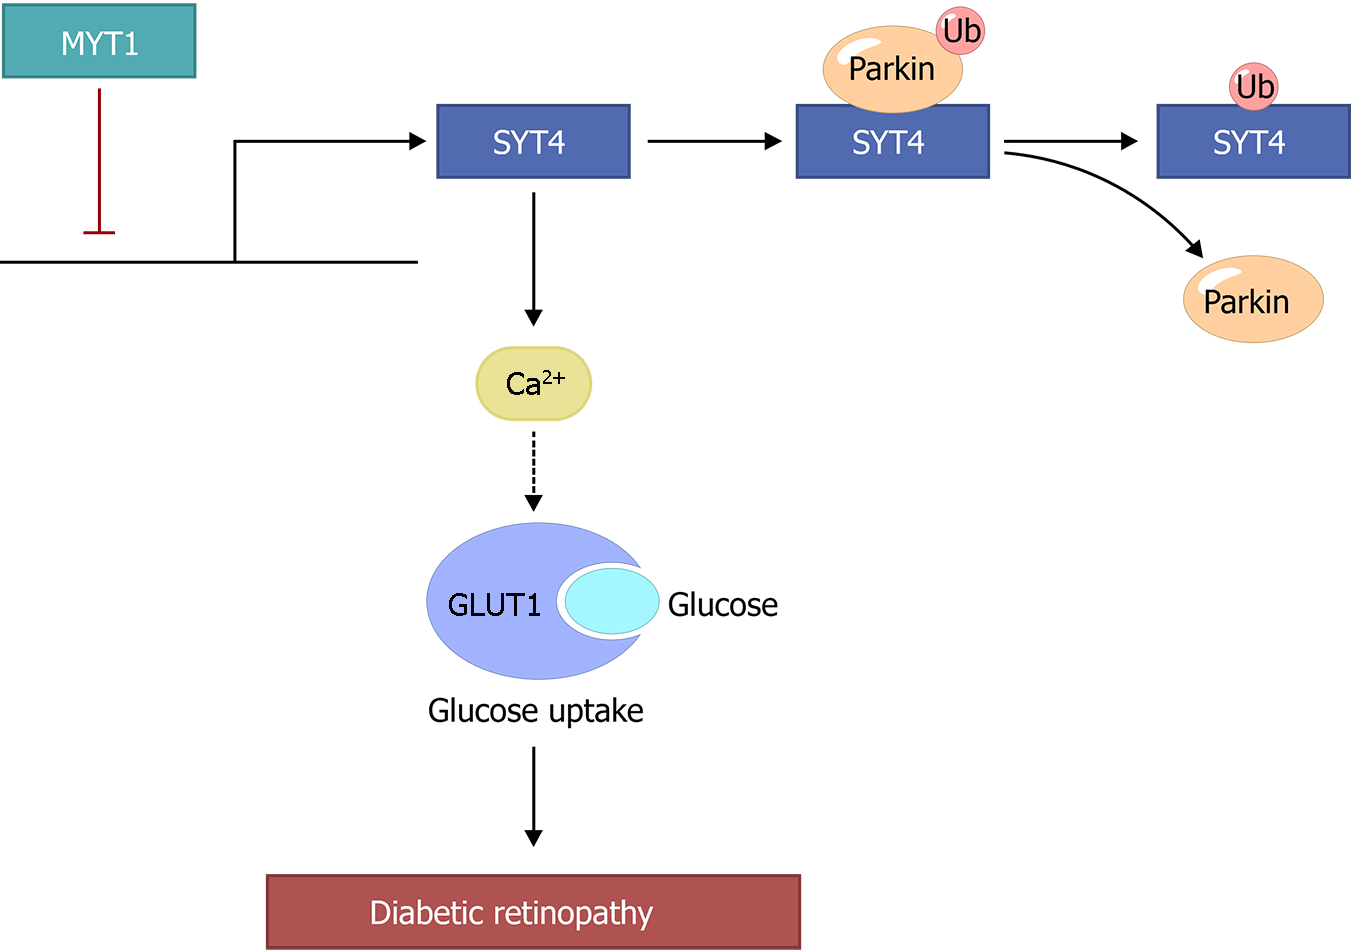
Figure 9 The mechanism of action of synaptotagmins 4 in diabetic retinopathy.
SYT: Synaptotagmins; MYT1: Myelin transcription factor 1; GLUT1: Glucose transporter-1.
- Citation: Xu H, Zhang LB, Luo YY, Wang L, Zhang YP, Chen PQ, Ba XY, Han J, Luo H. Synaptotagmins family affect glucose transport in retinal pigment epithelial cells through their ubiquitination-mediated degradation and glucose transporter-1 regulation. World J Diabetes 2024; 15(5): 958-976
- URL: https://www.wjgnet.com/1948-9358/full/v15/i5/958.htm
- DOI: https://dx.doi.org/10.4239/wjd.v15.i5.958


