Copyright
©The Author(s) 2024.
World J Diabetes. May 15, 2024; 15(5): 945-957
Published online May 15, 2024. doi: 10.4239/wjd.v15.i5.945
Published online May 15, 2024. doi: 10.4239/wjd.v15.i5.945
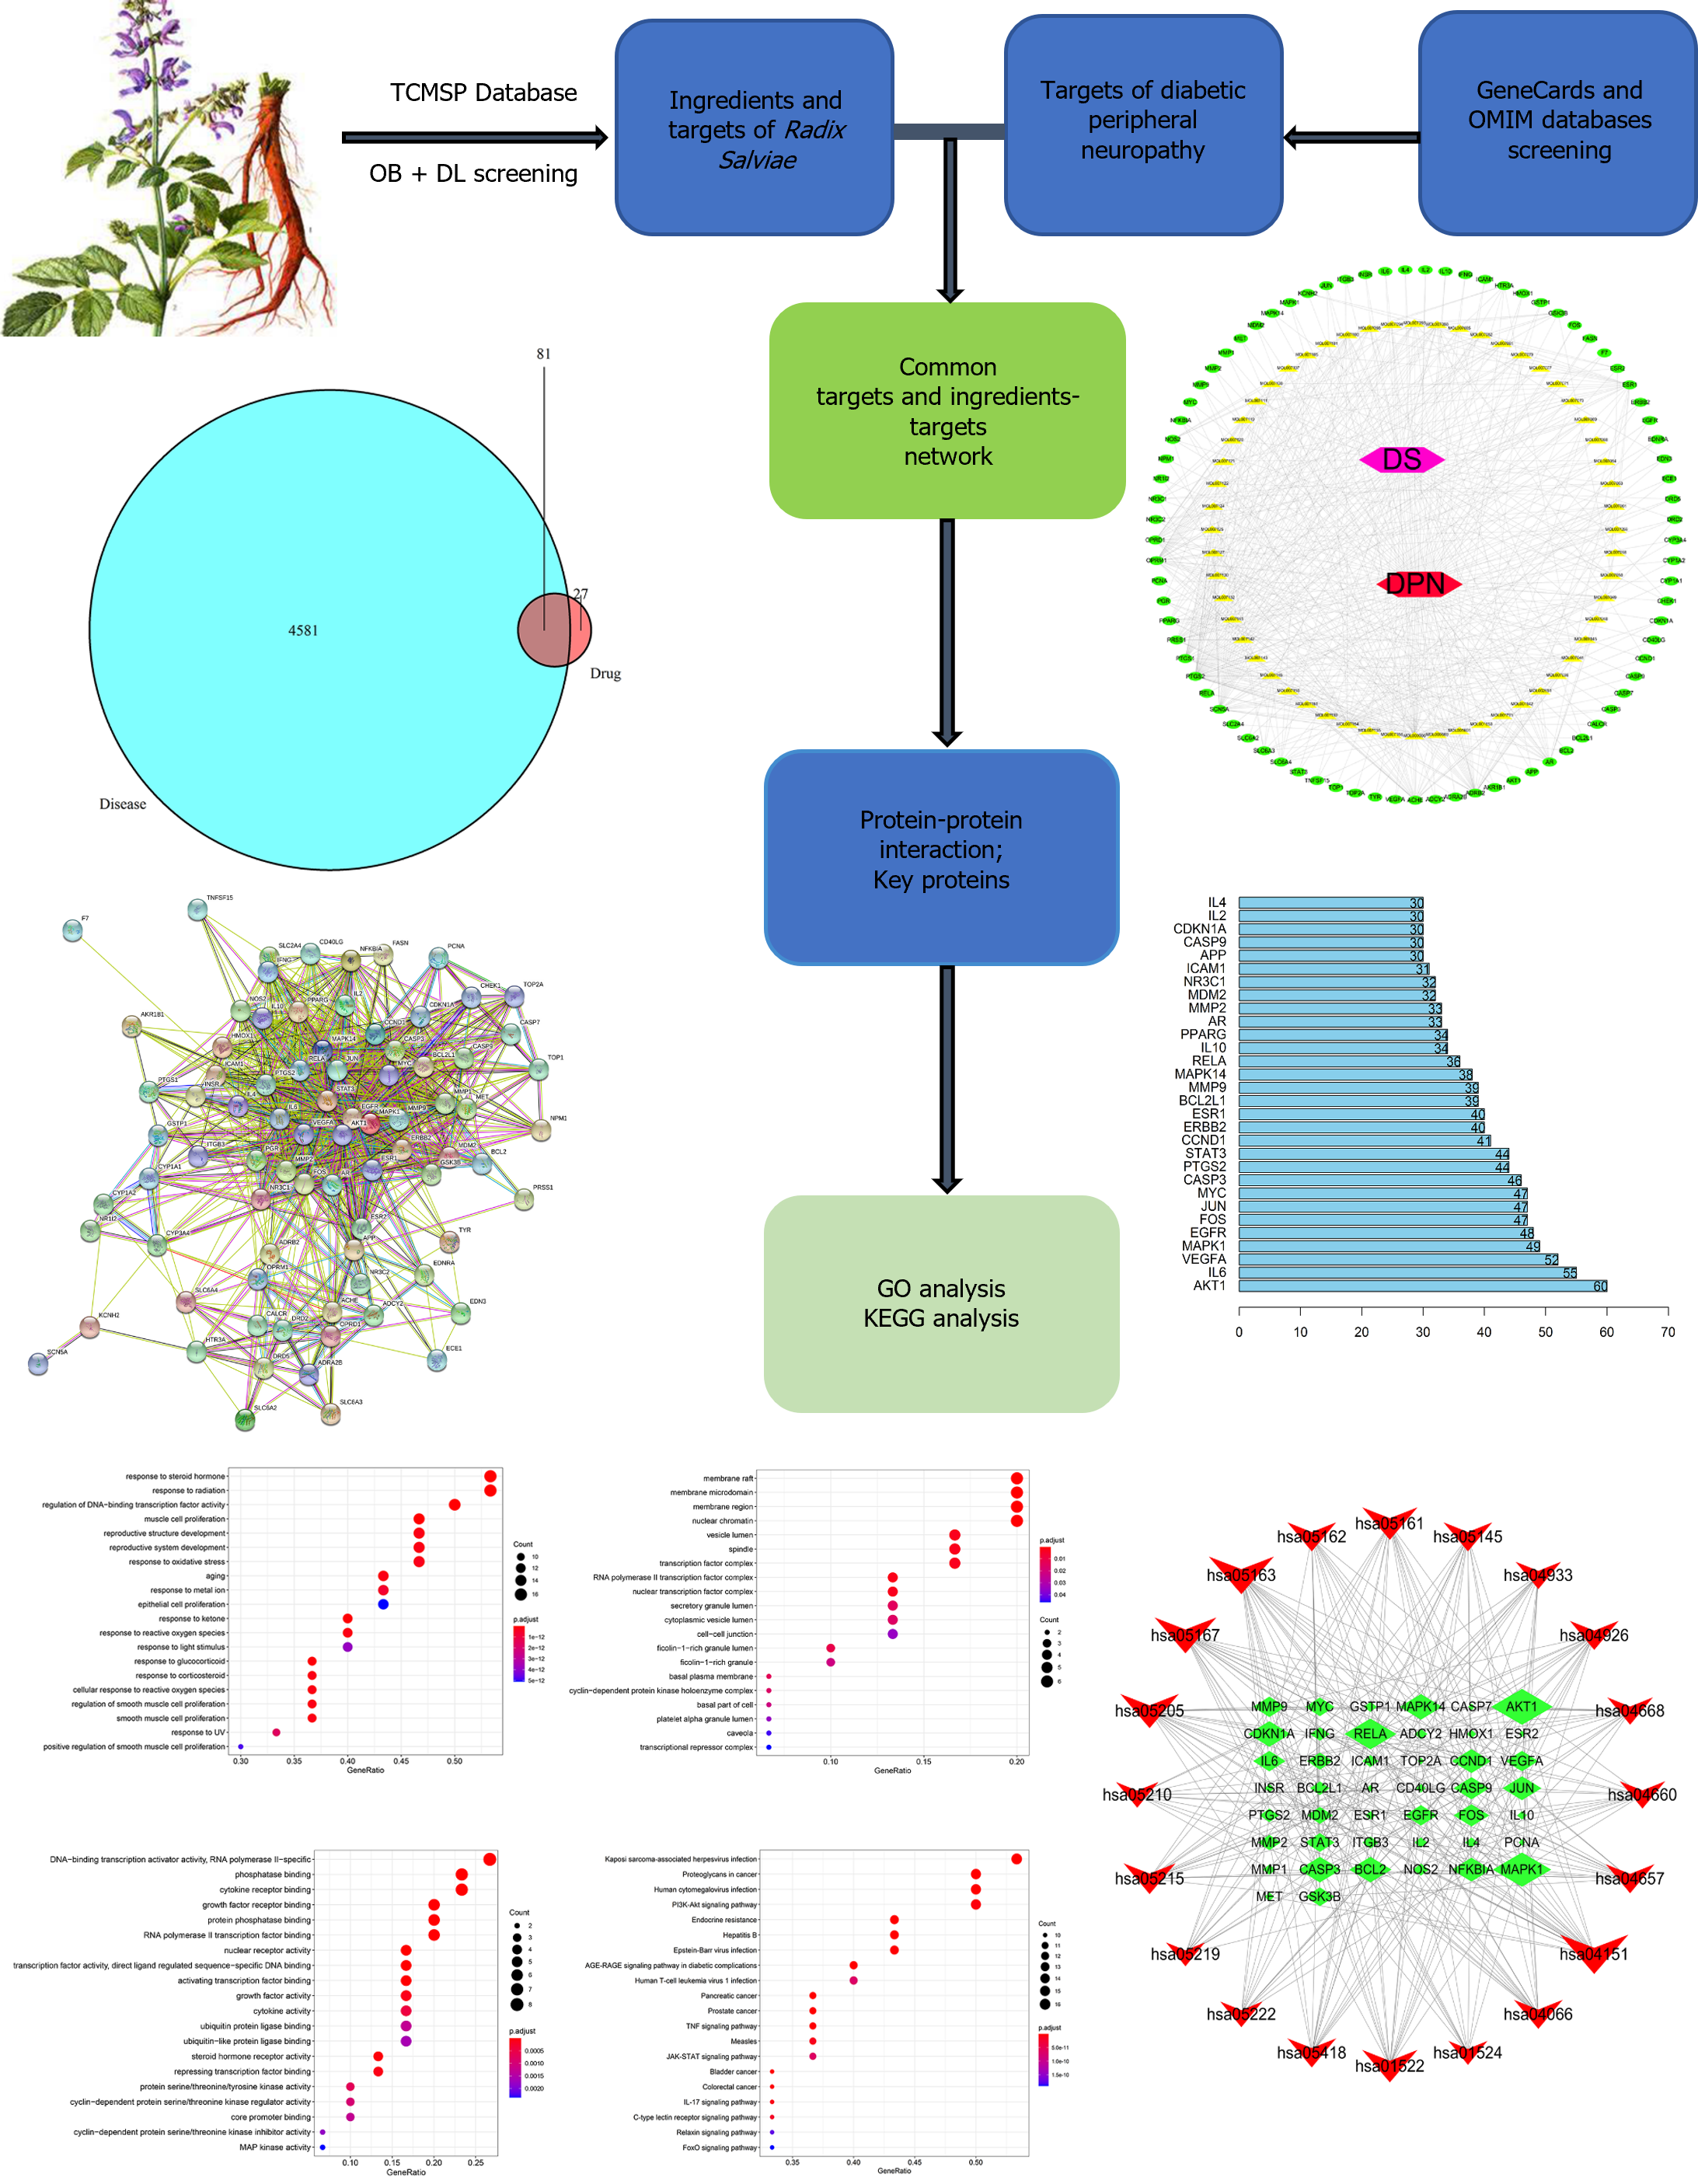
Figure 1 Flow diagram for the RadixSalviae treatment for diabetic peripheral neuropathy.
GO: Gene ontology; KEGG: Kyoto Encyclopedia of Genes and Genomes; TCMSP: Traditional Chinese medicine pharmacology database and analysis platform; OB: Oral bioavailability; DL: Drug likeness.
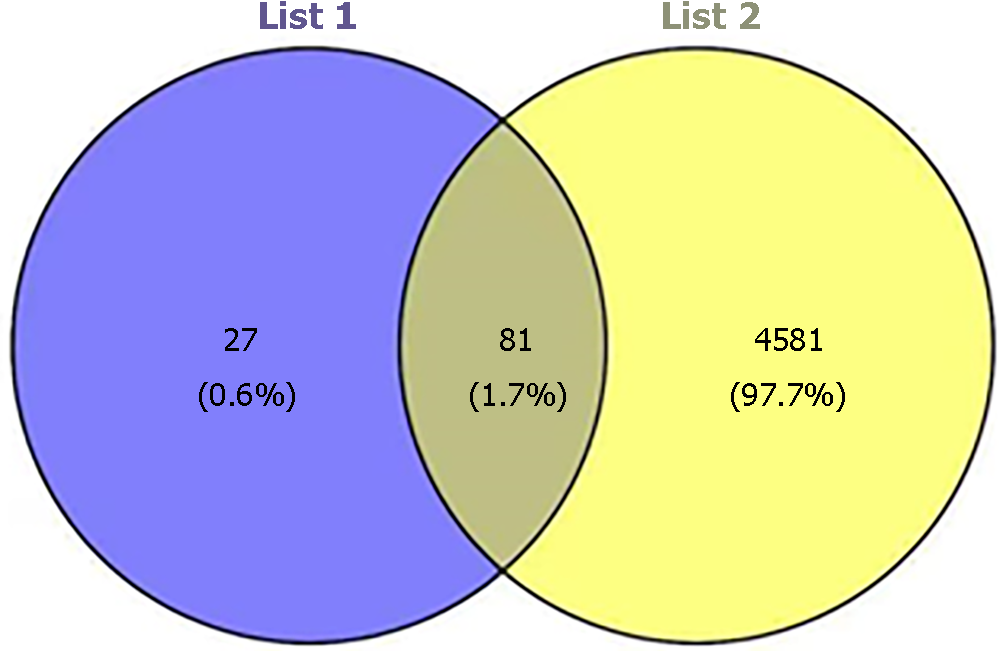
Figure 2 Venn diagram of the RadixSalviae treatment for diabetic peripheral neuropathy.
The blue circle represents the targets of diabetic peripheral neuropathy, and the pink circle represents the targets of Radix Salviae. The intersection represents common targets between Radix Salviae and diabetic peripheral neuropathy.
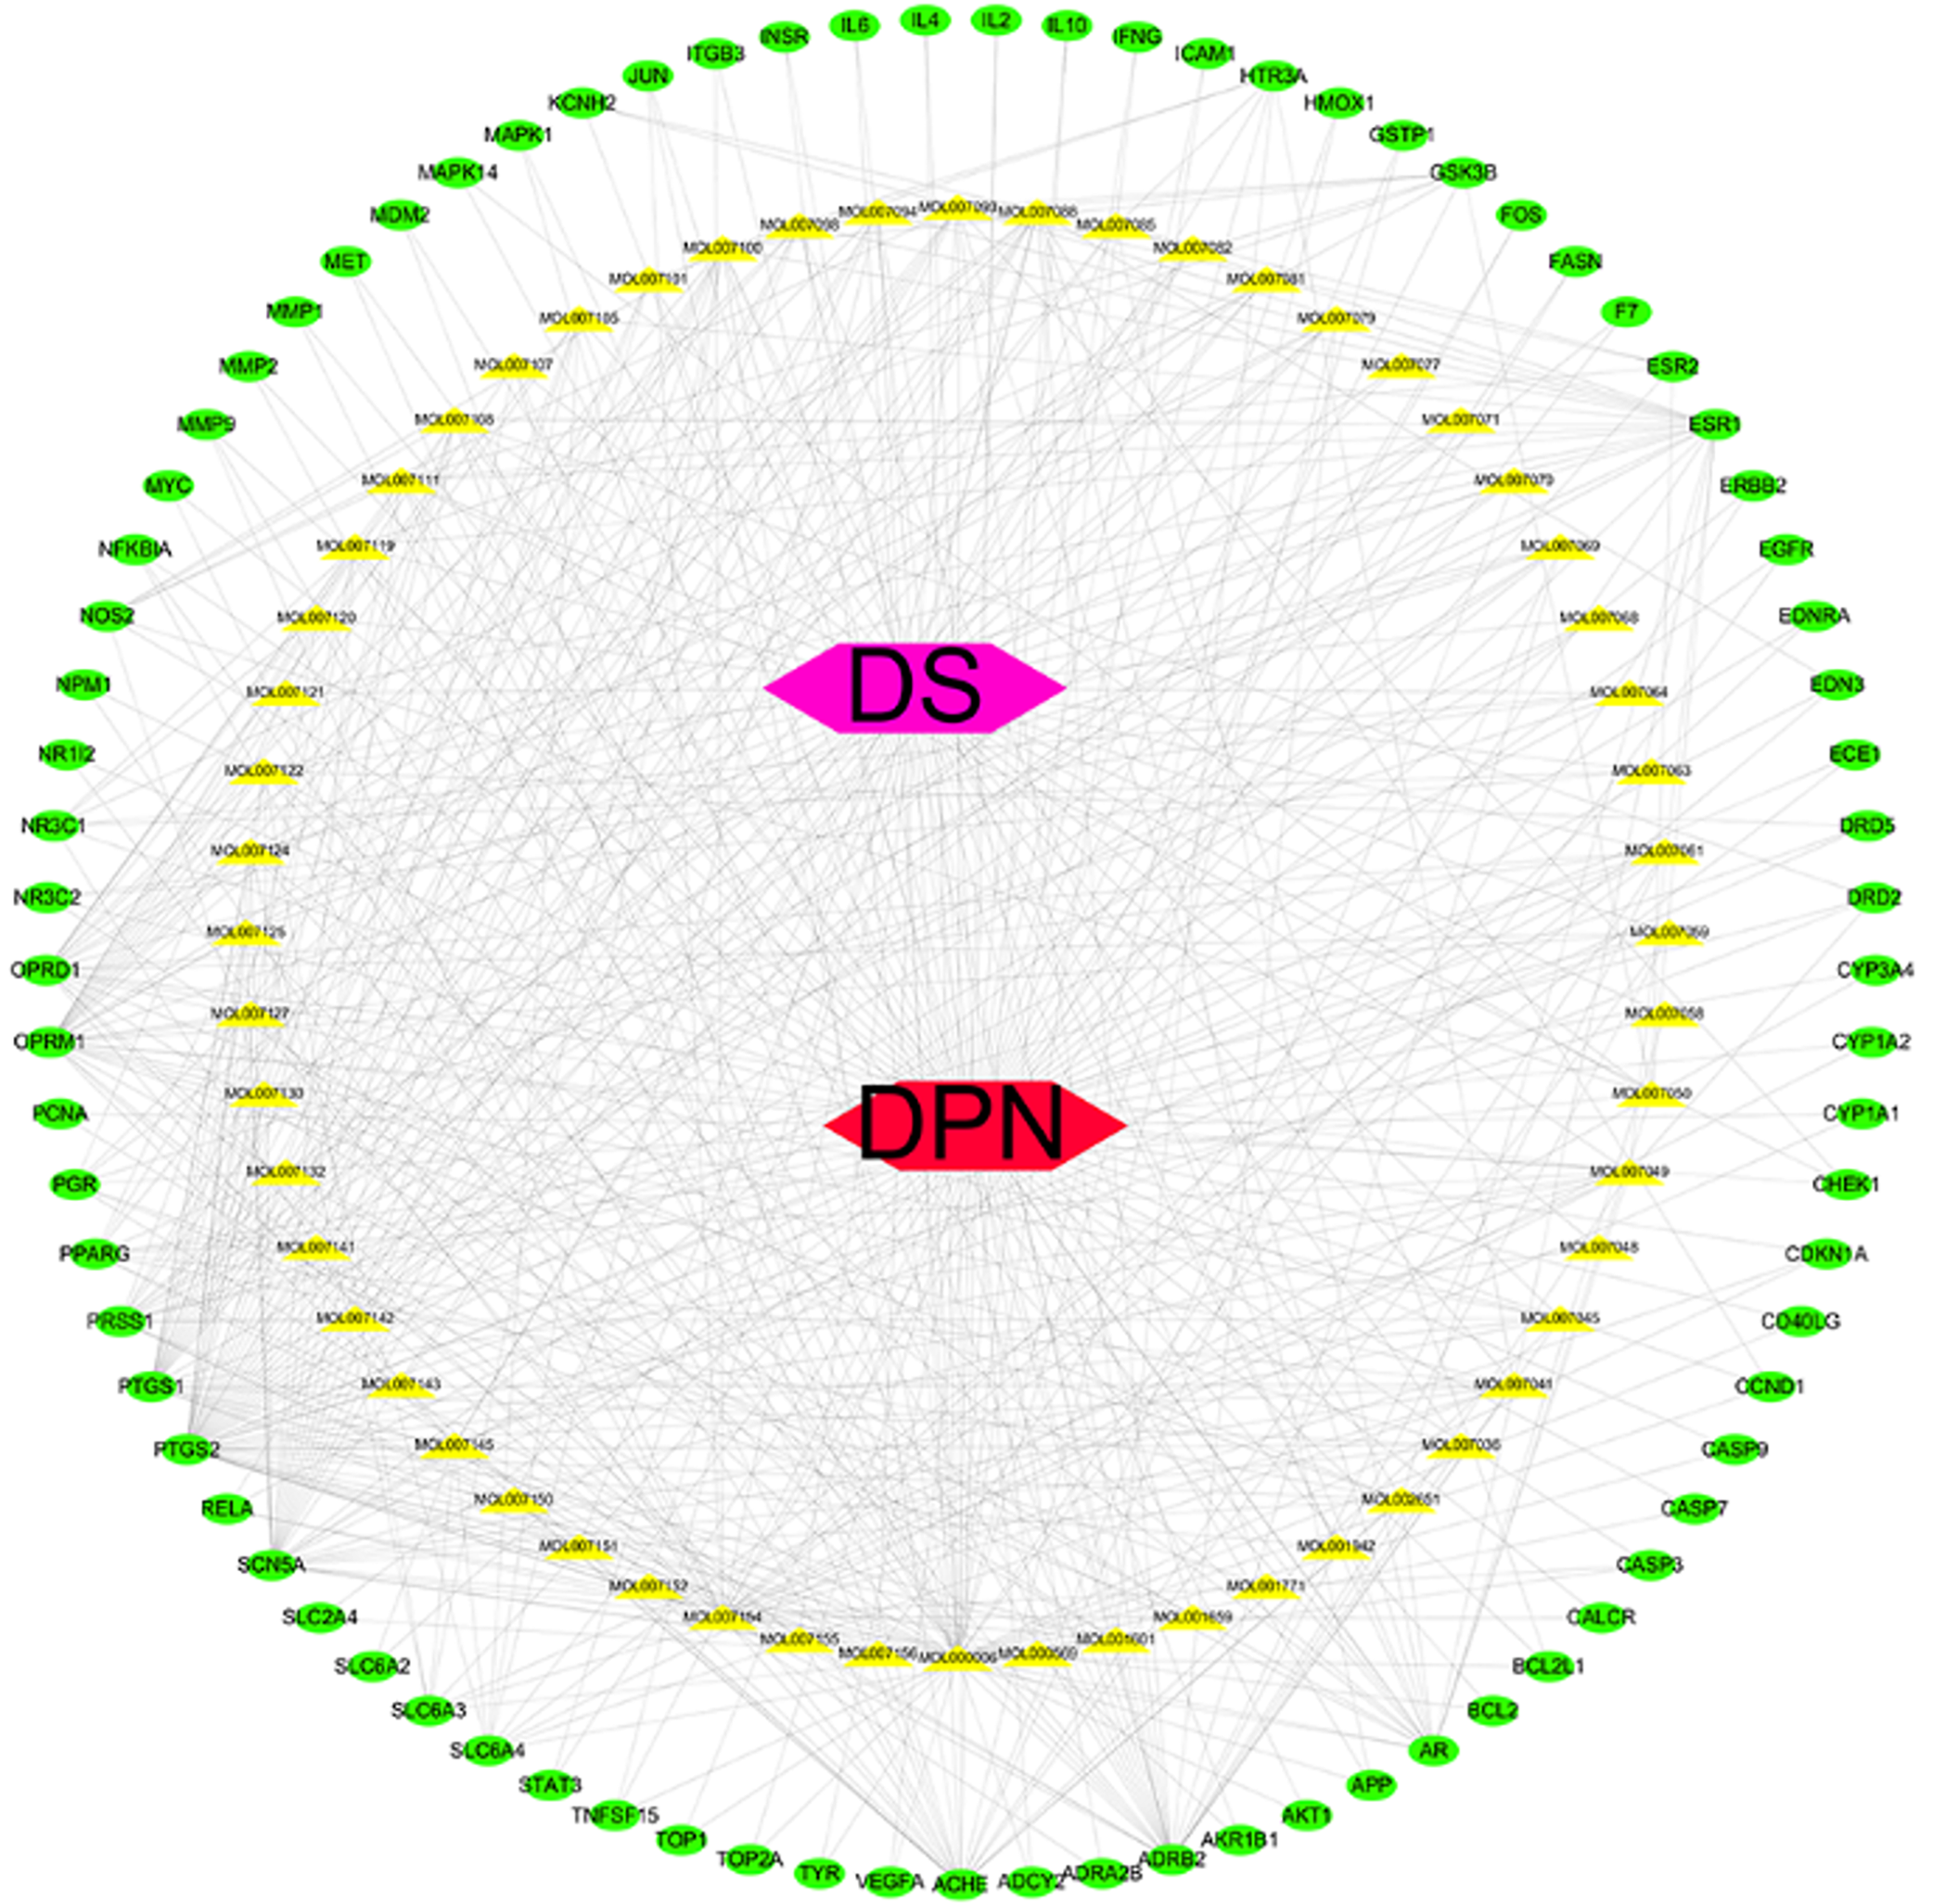
Figure 3 Network diagram of RadixSalviae, ingredients, common targets, and diabetic peripheral neuropathy.
The green circles represent common targets of Radix Salviae and diabetic peripheral neuropathy, and the yellow triangles represent the ingredients of Radix Salviae. The pink hexagons represent Radix Salviae. The red hexagons represent the disease of diabetic peripheral neuropathy.
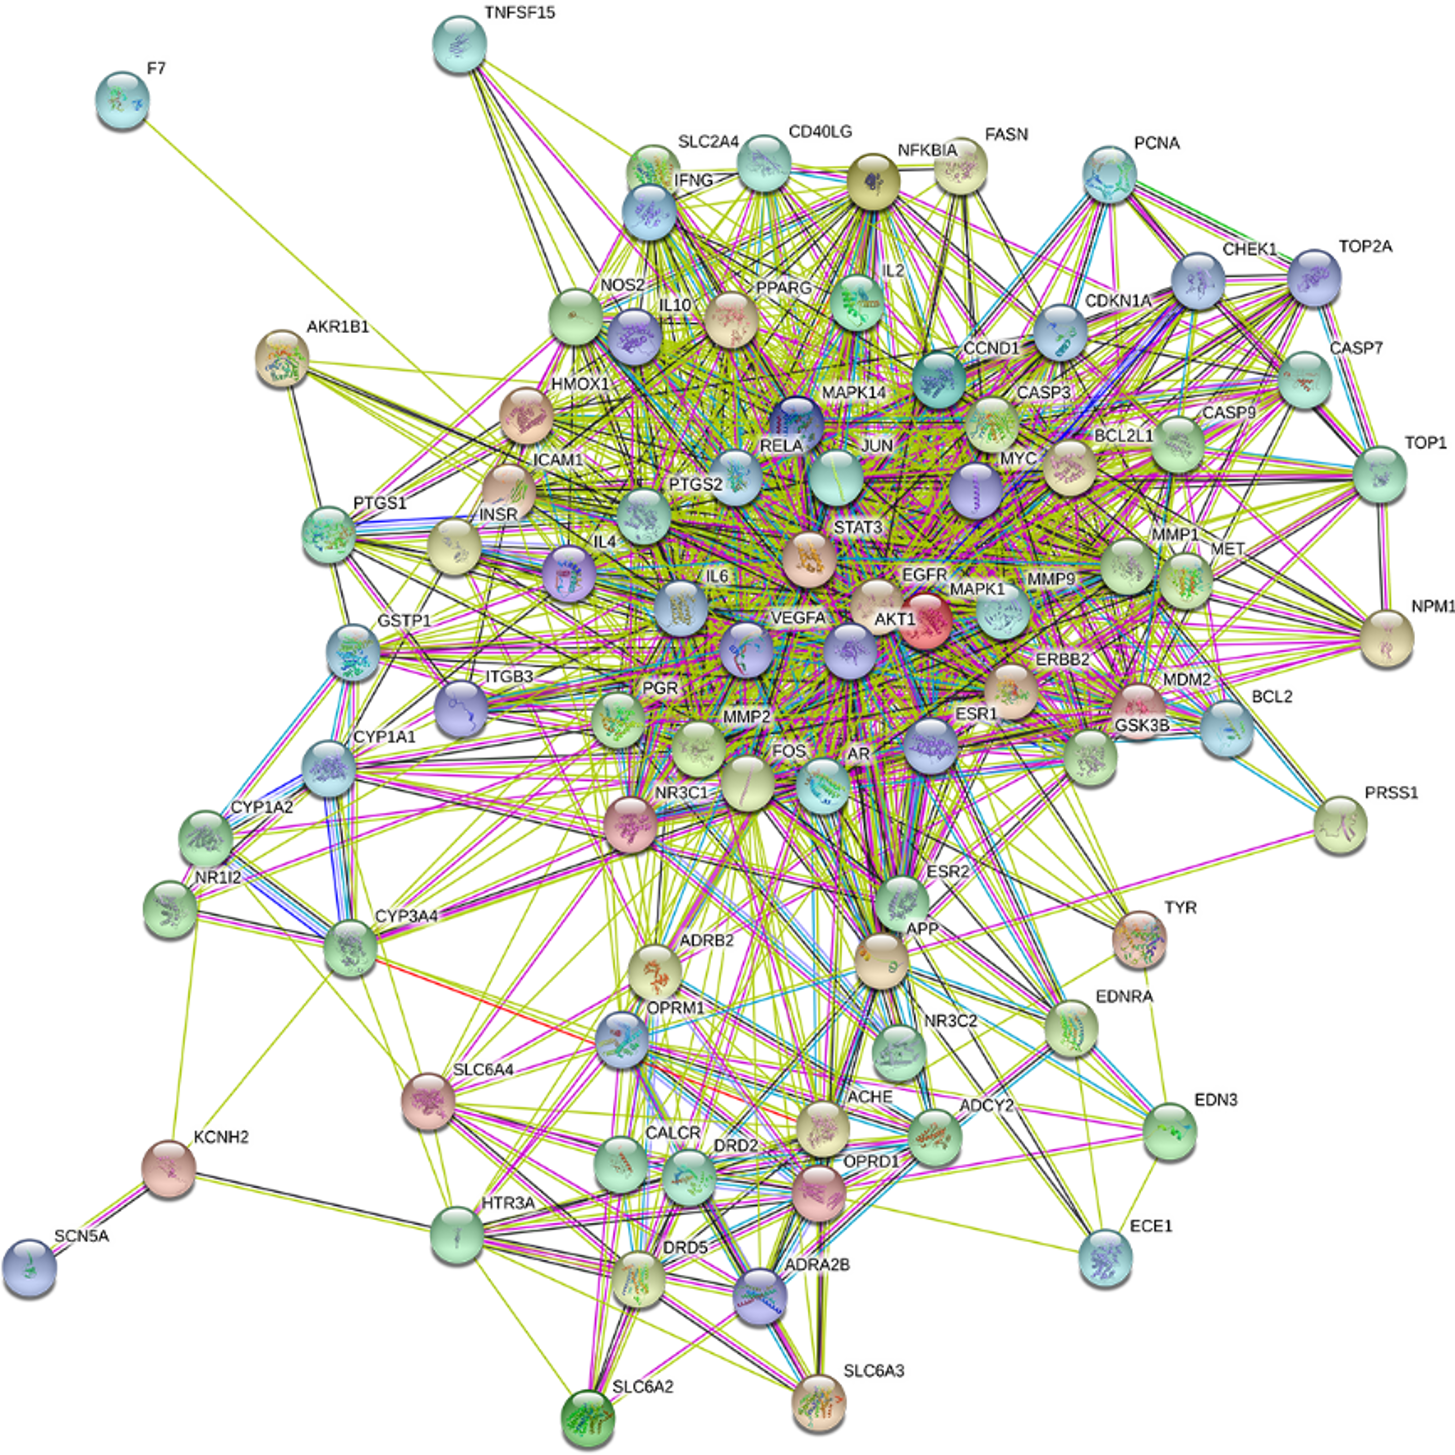
Figure 4 Protein–protein interaction network.
The circles represent proteins, and the straight lines represent the functional interactions among proteins.
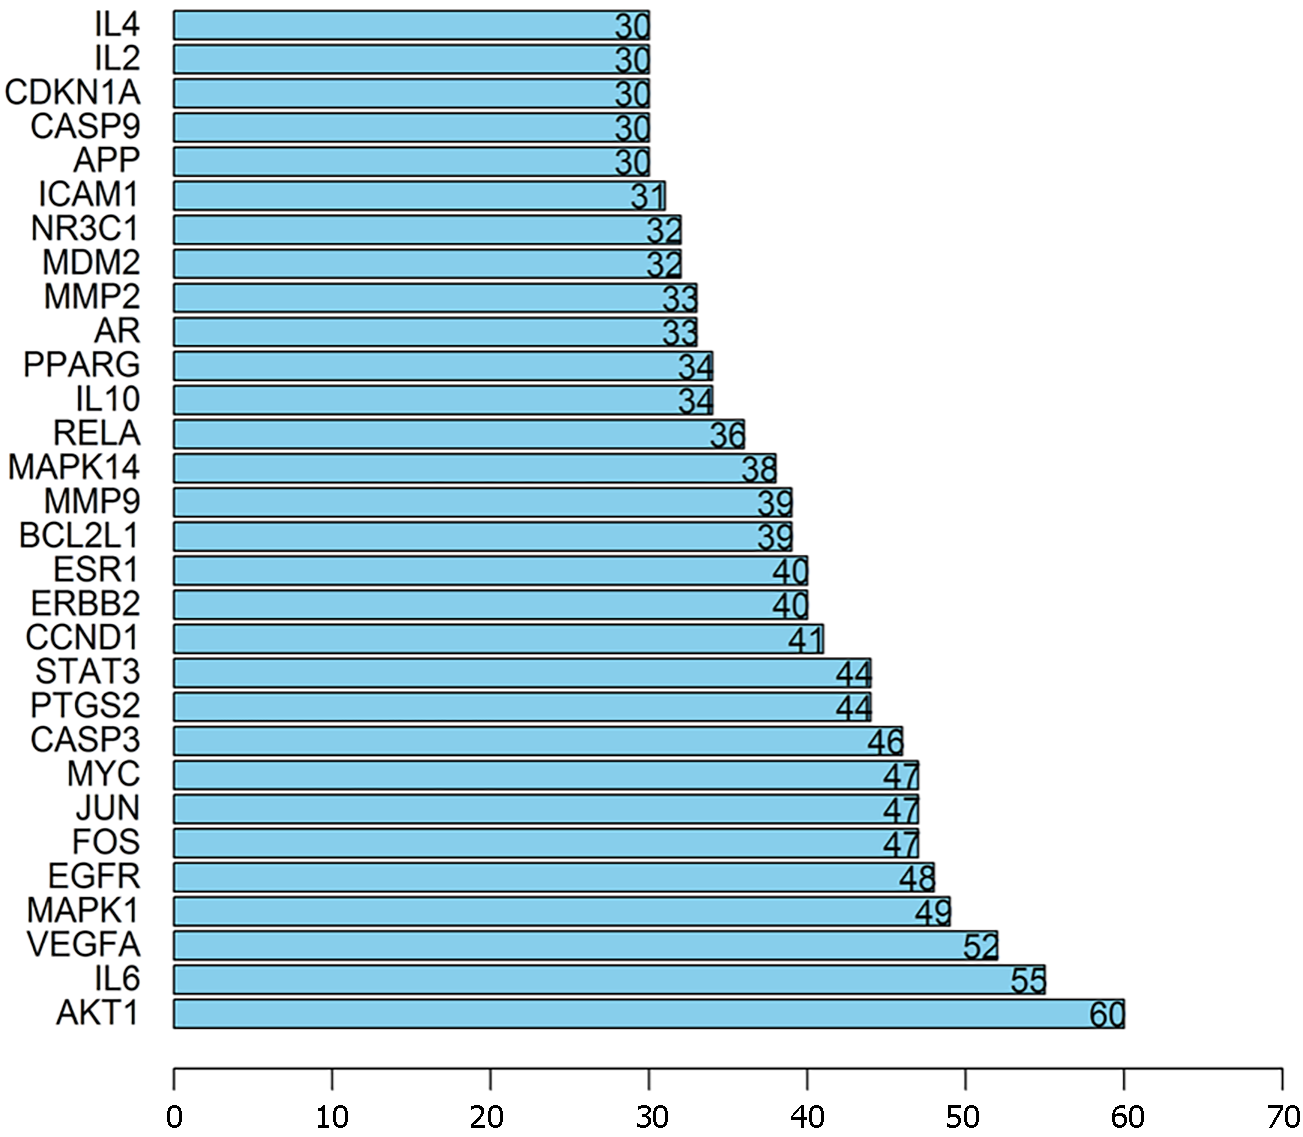
Figure 5 Top targets.
The protein interaction nodes are in line with the abscissa, and the ordinate proteins represent the top targets that were selected from the common targets.
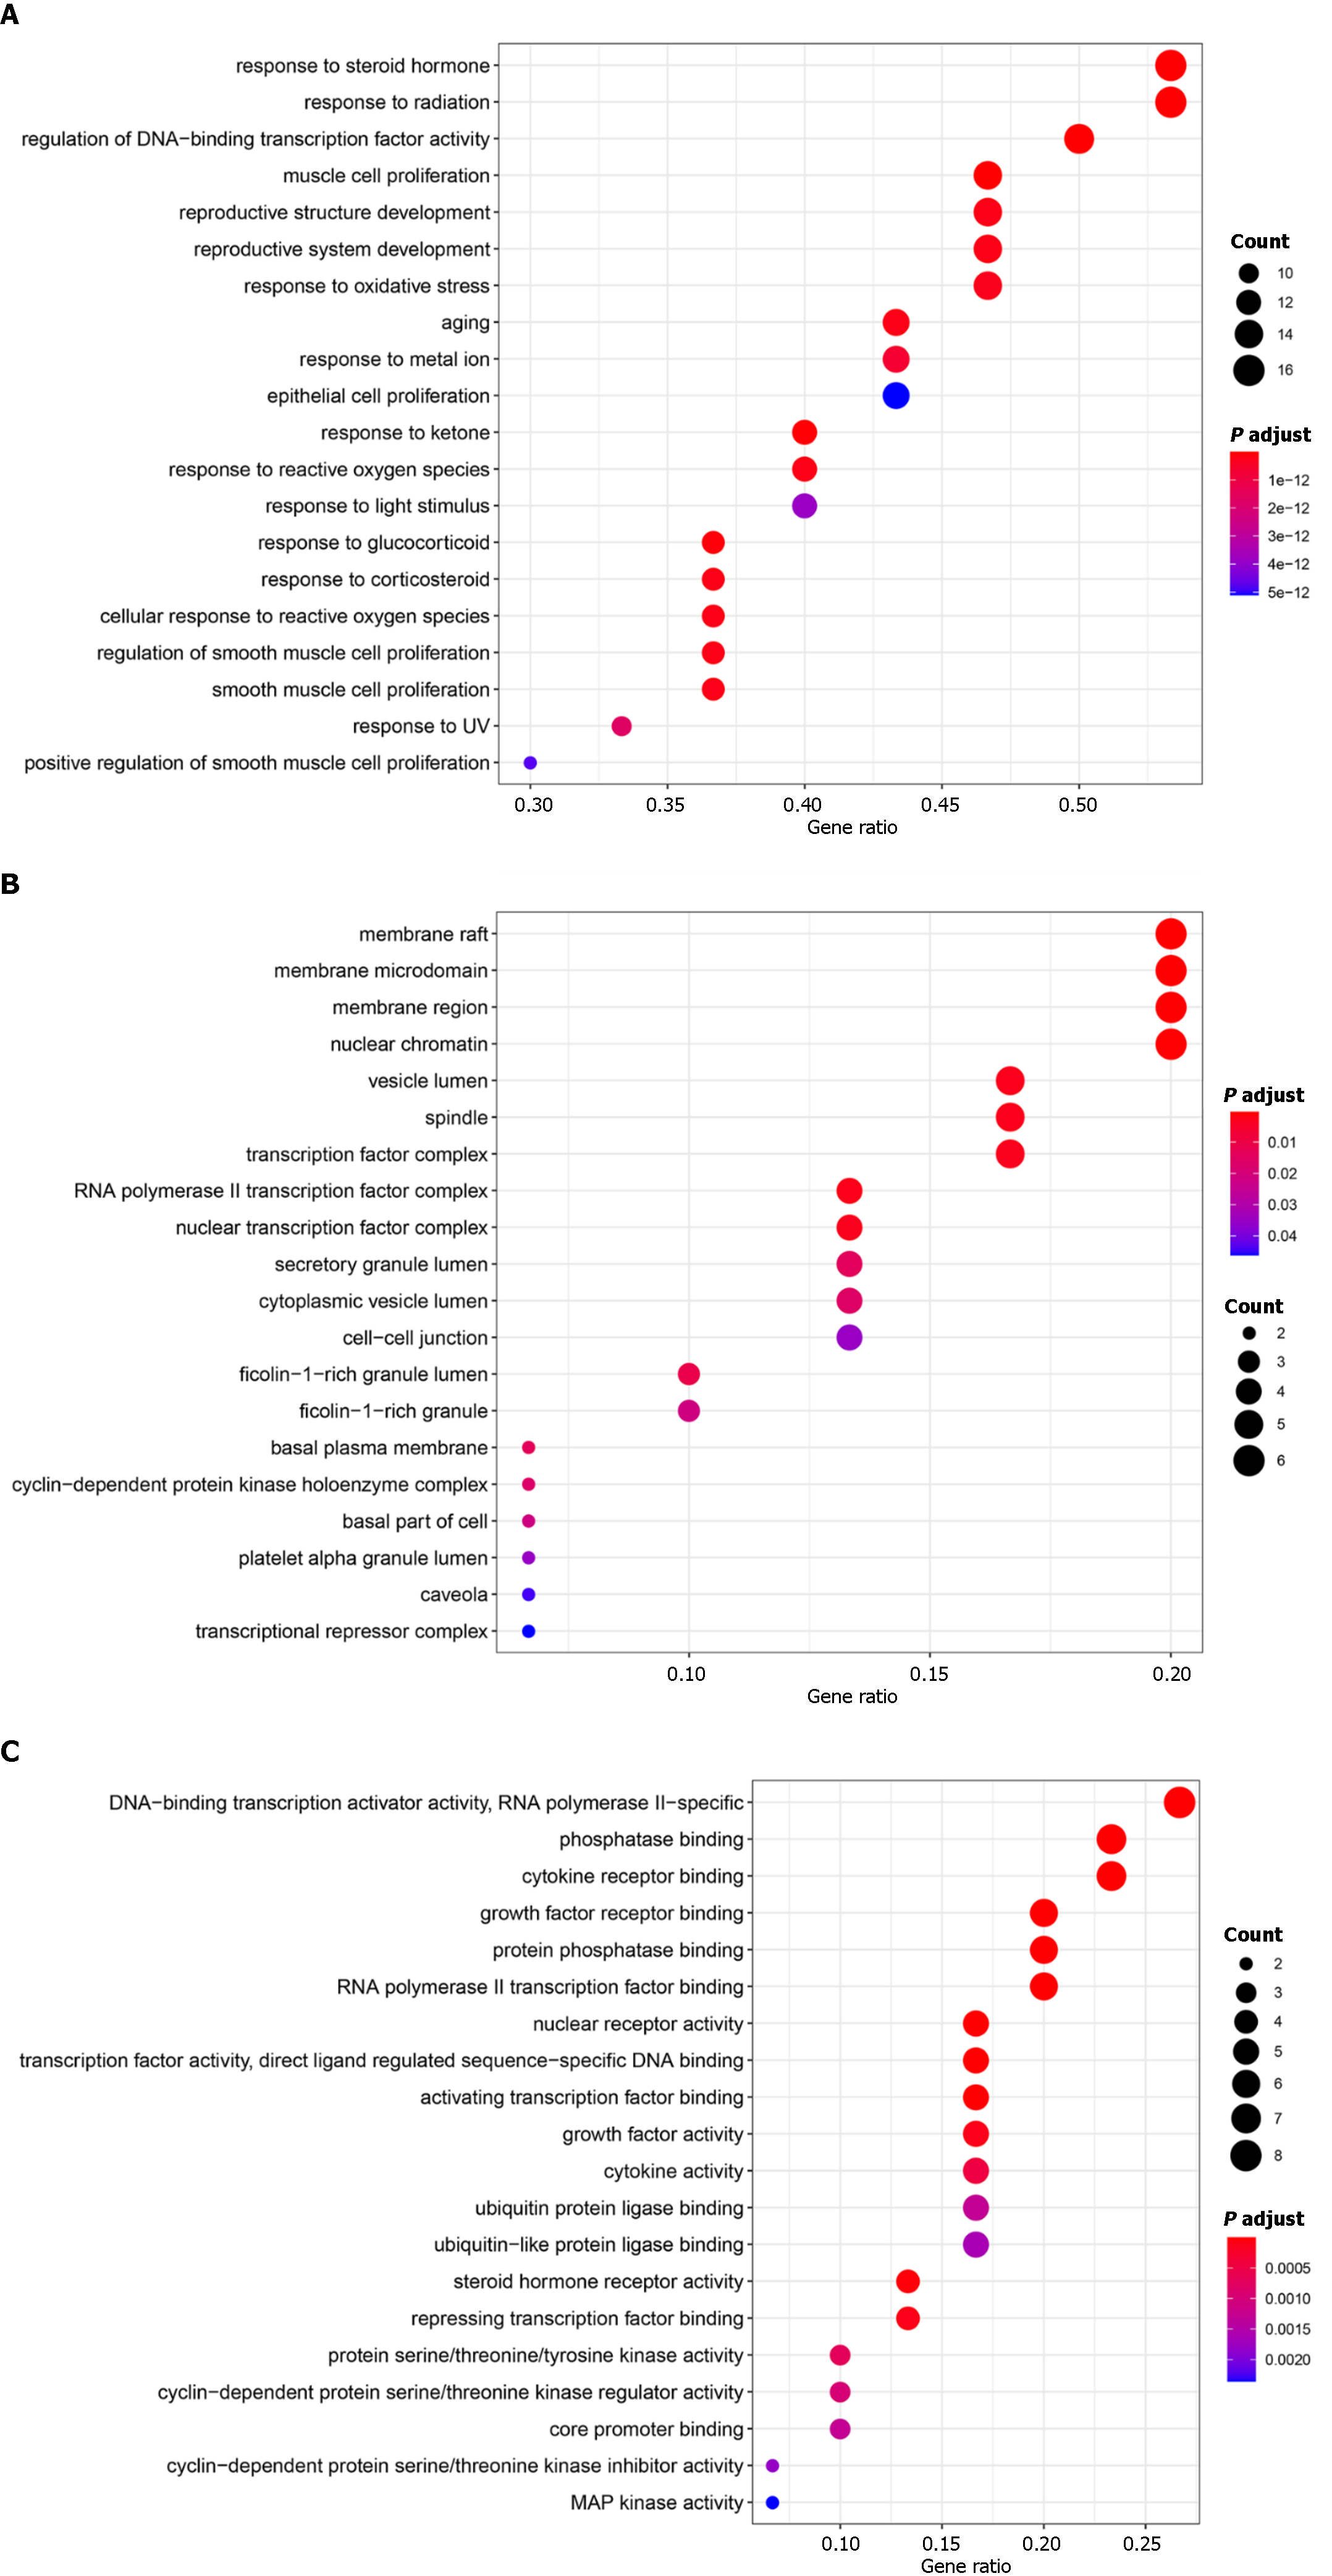
Figure 6 Gene Ontology enrichment analysis of the top targets.
A: Biological process; B: Cellular component; C: Molecular function. BP: Biological process; CC: Cellular component; MF: Molecular function.
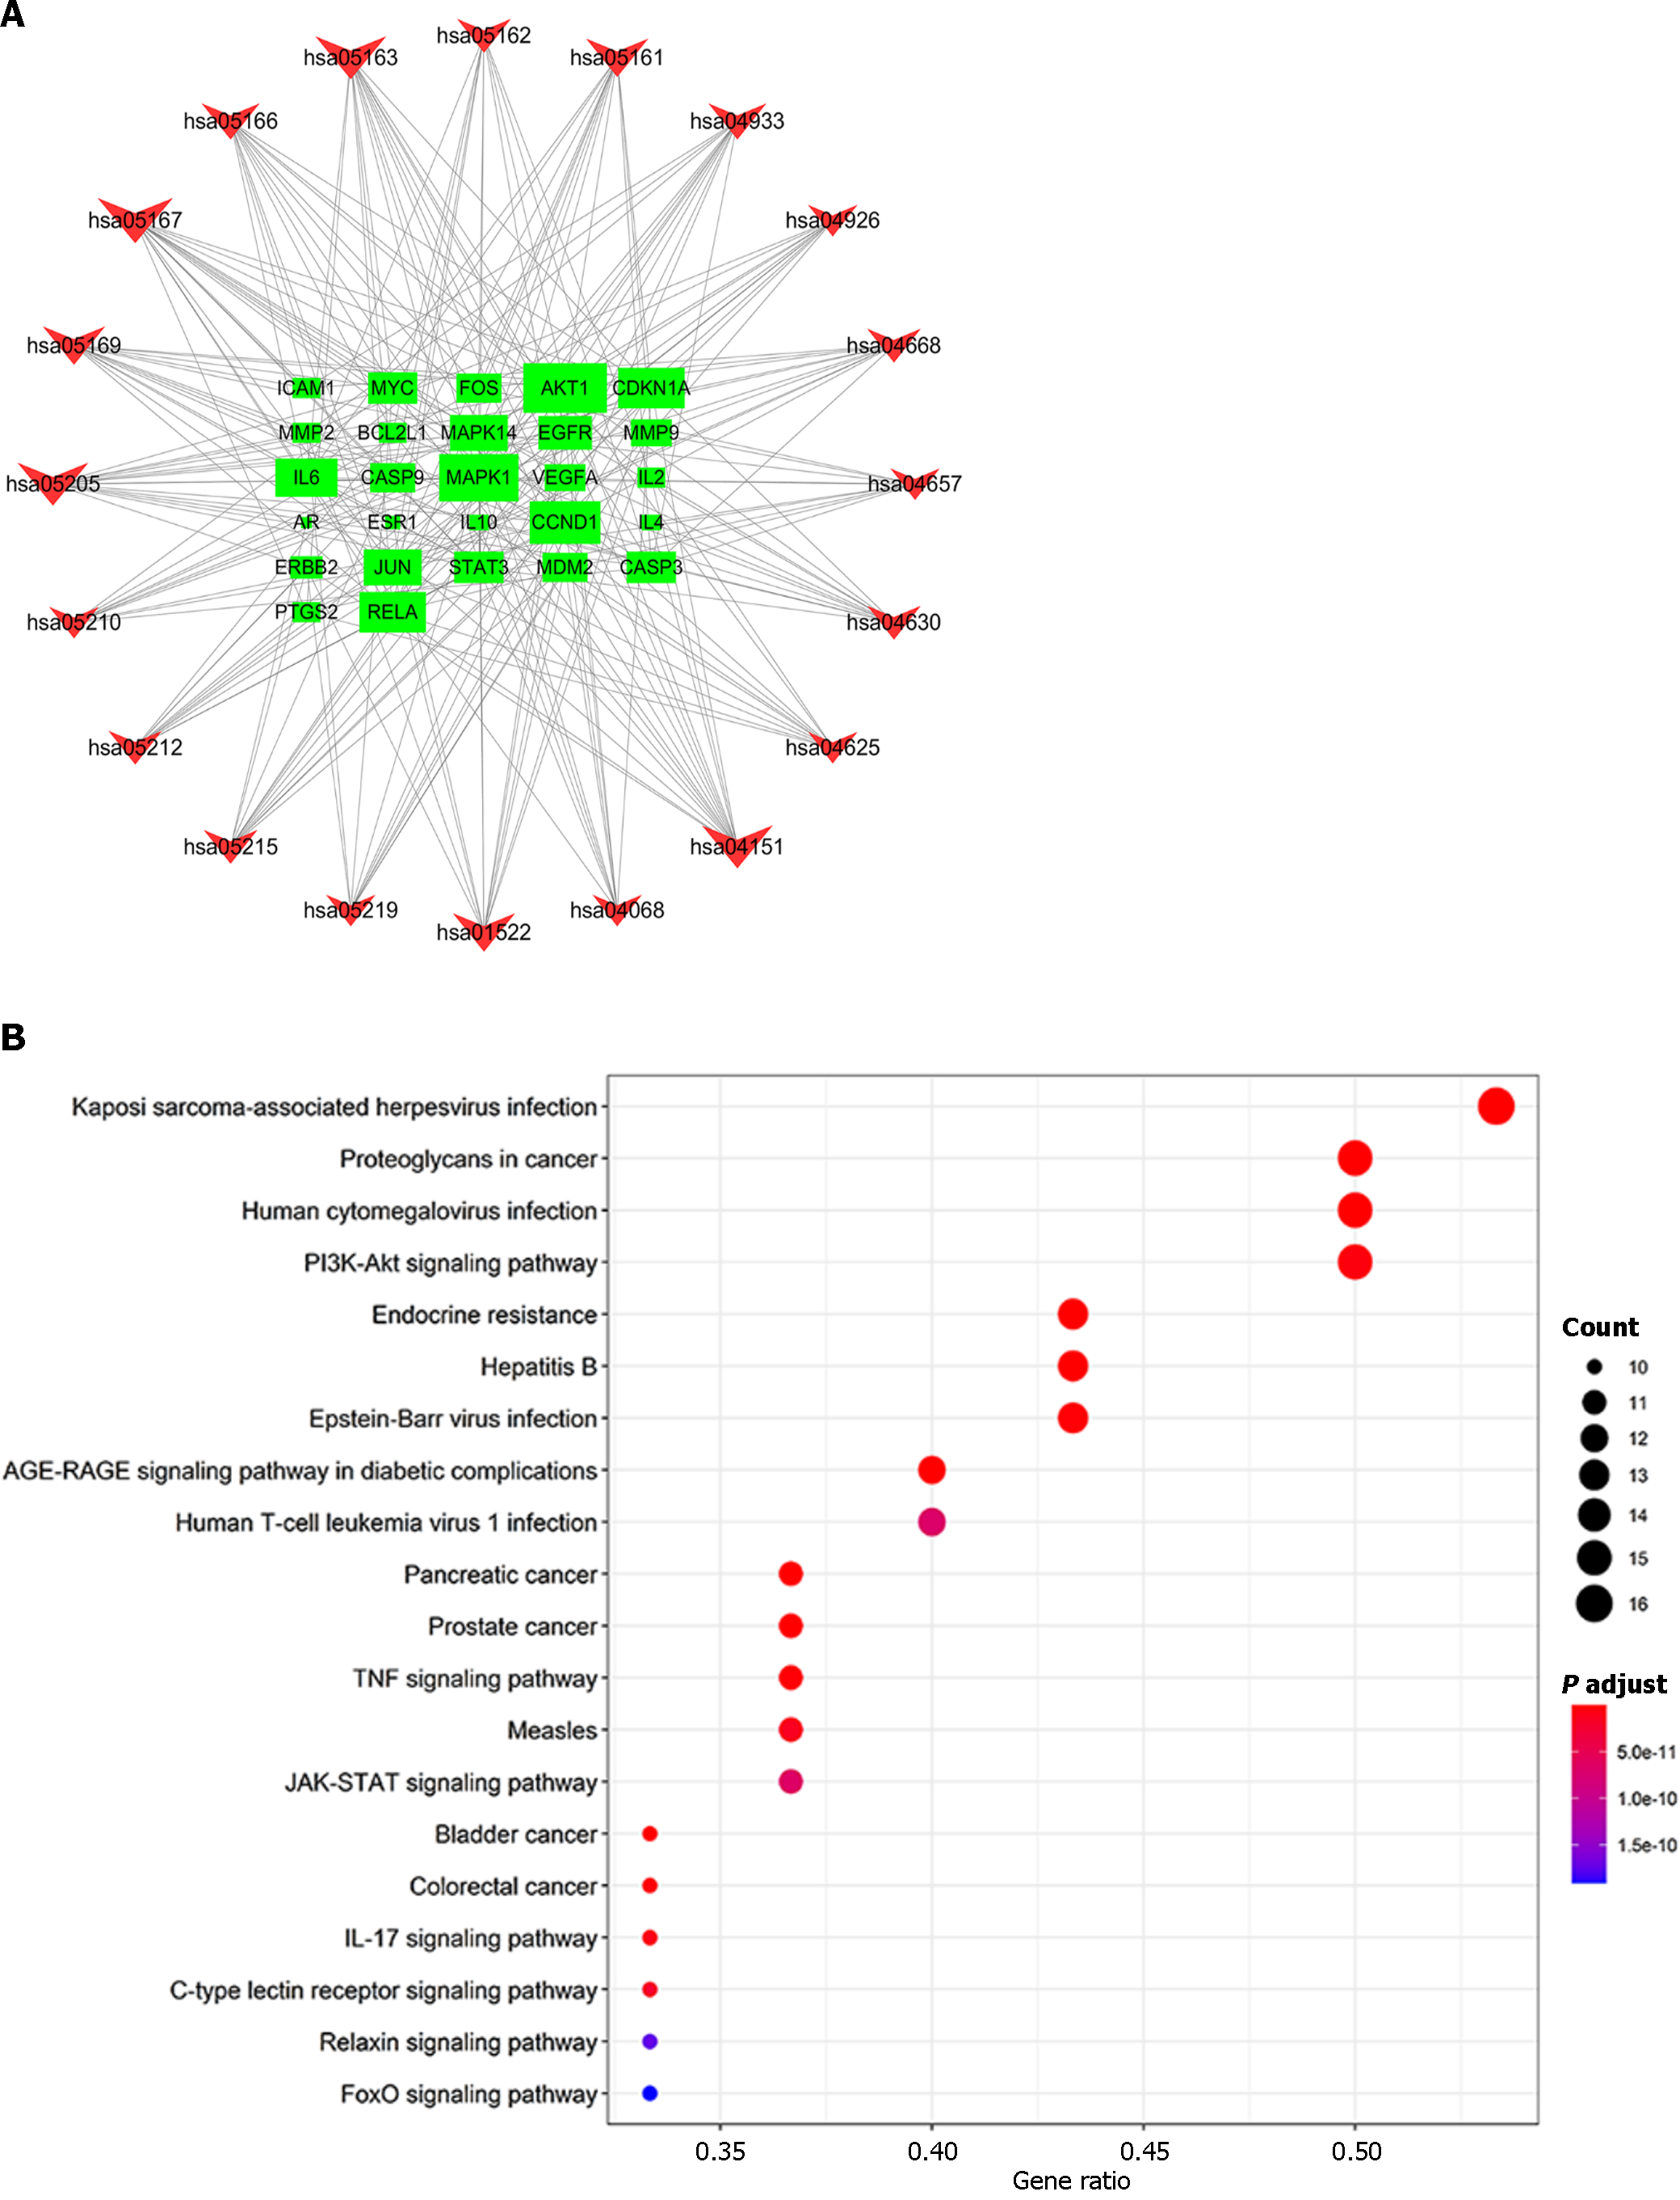
Figure 7 Kyoto Encyclopedia of Genes and Genomes pathway analysis of the top targets.
A: In the Kyoto Encyclopedia of Genes and Genomes (KEGG) network, the green rectangles represent the top targets, and the sizes of the green rectangles represent the target proportions; B: The red inverted triangles represent the top 20 pathways revealed by KEGG pathway analysis; the abscissa represents the gene ratio, and the ordinate scales represent the specific pathways.
- Citation: Kang T, Qin X, Chen Y, Yang Q. Systematic investigation of Radix Salviae for treating diabetic peripheral neuropathy disease based on network Pharmacology. World J Diabetes 2024; 15(5): 945-957
- URL: https://www.wjgnet.com/1948-9358/full/v15/i5/945.htm
- DOI: https://dx.doi.org/10.4239/wjd.v15.i5.945


