Copyright
©The Author(s) 2024.
World J Diabetes. May 15, 2024; 15(5): 898-913
Published online May 15, 2024. doi: 10.4239/wjd.v15.i5.898
Published online May 15, 2024. doi: 10.4239/wjd.v15.i5.898
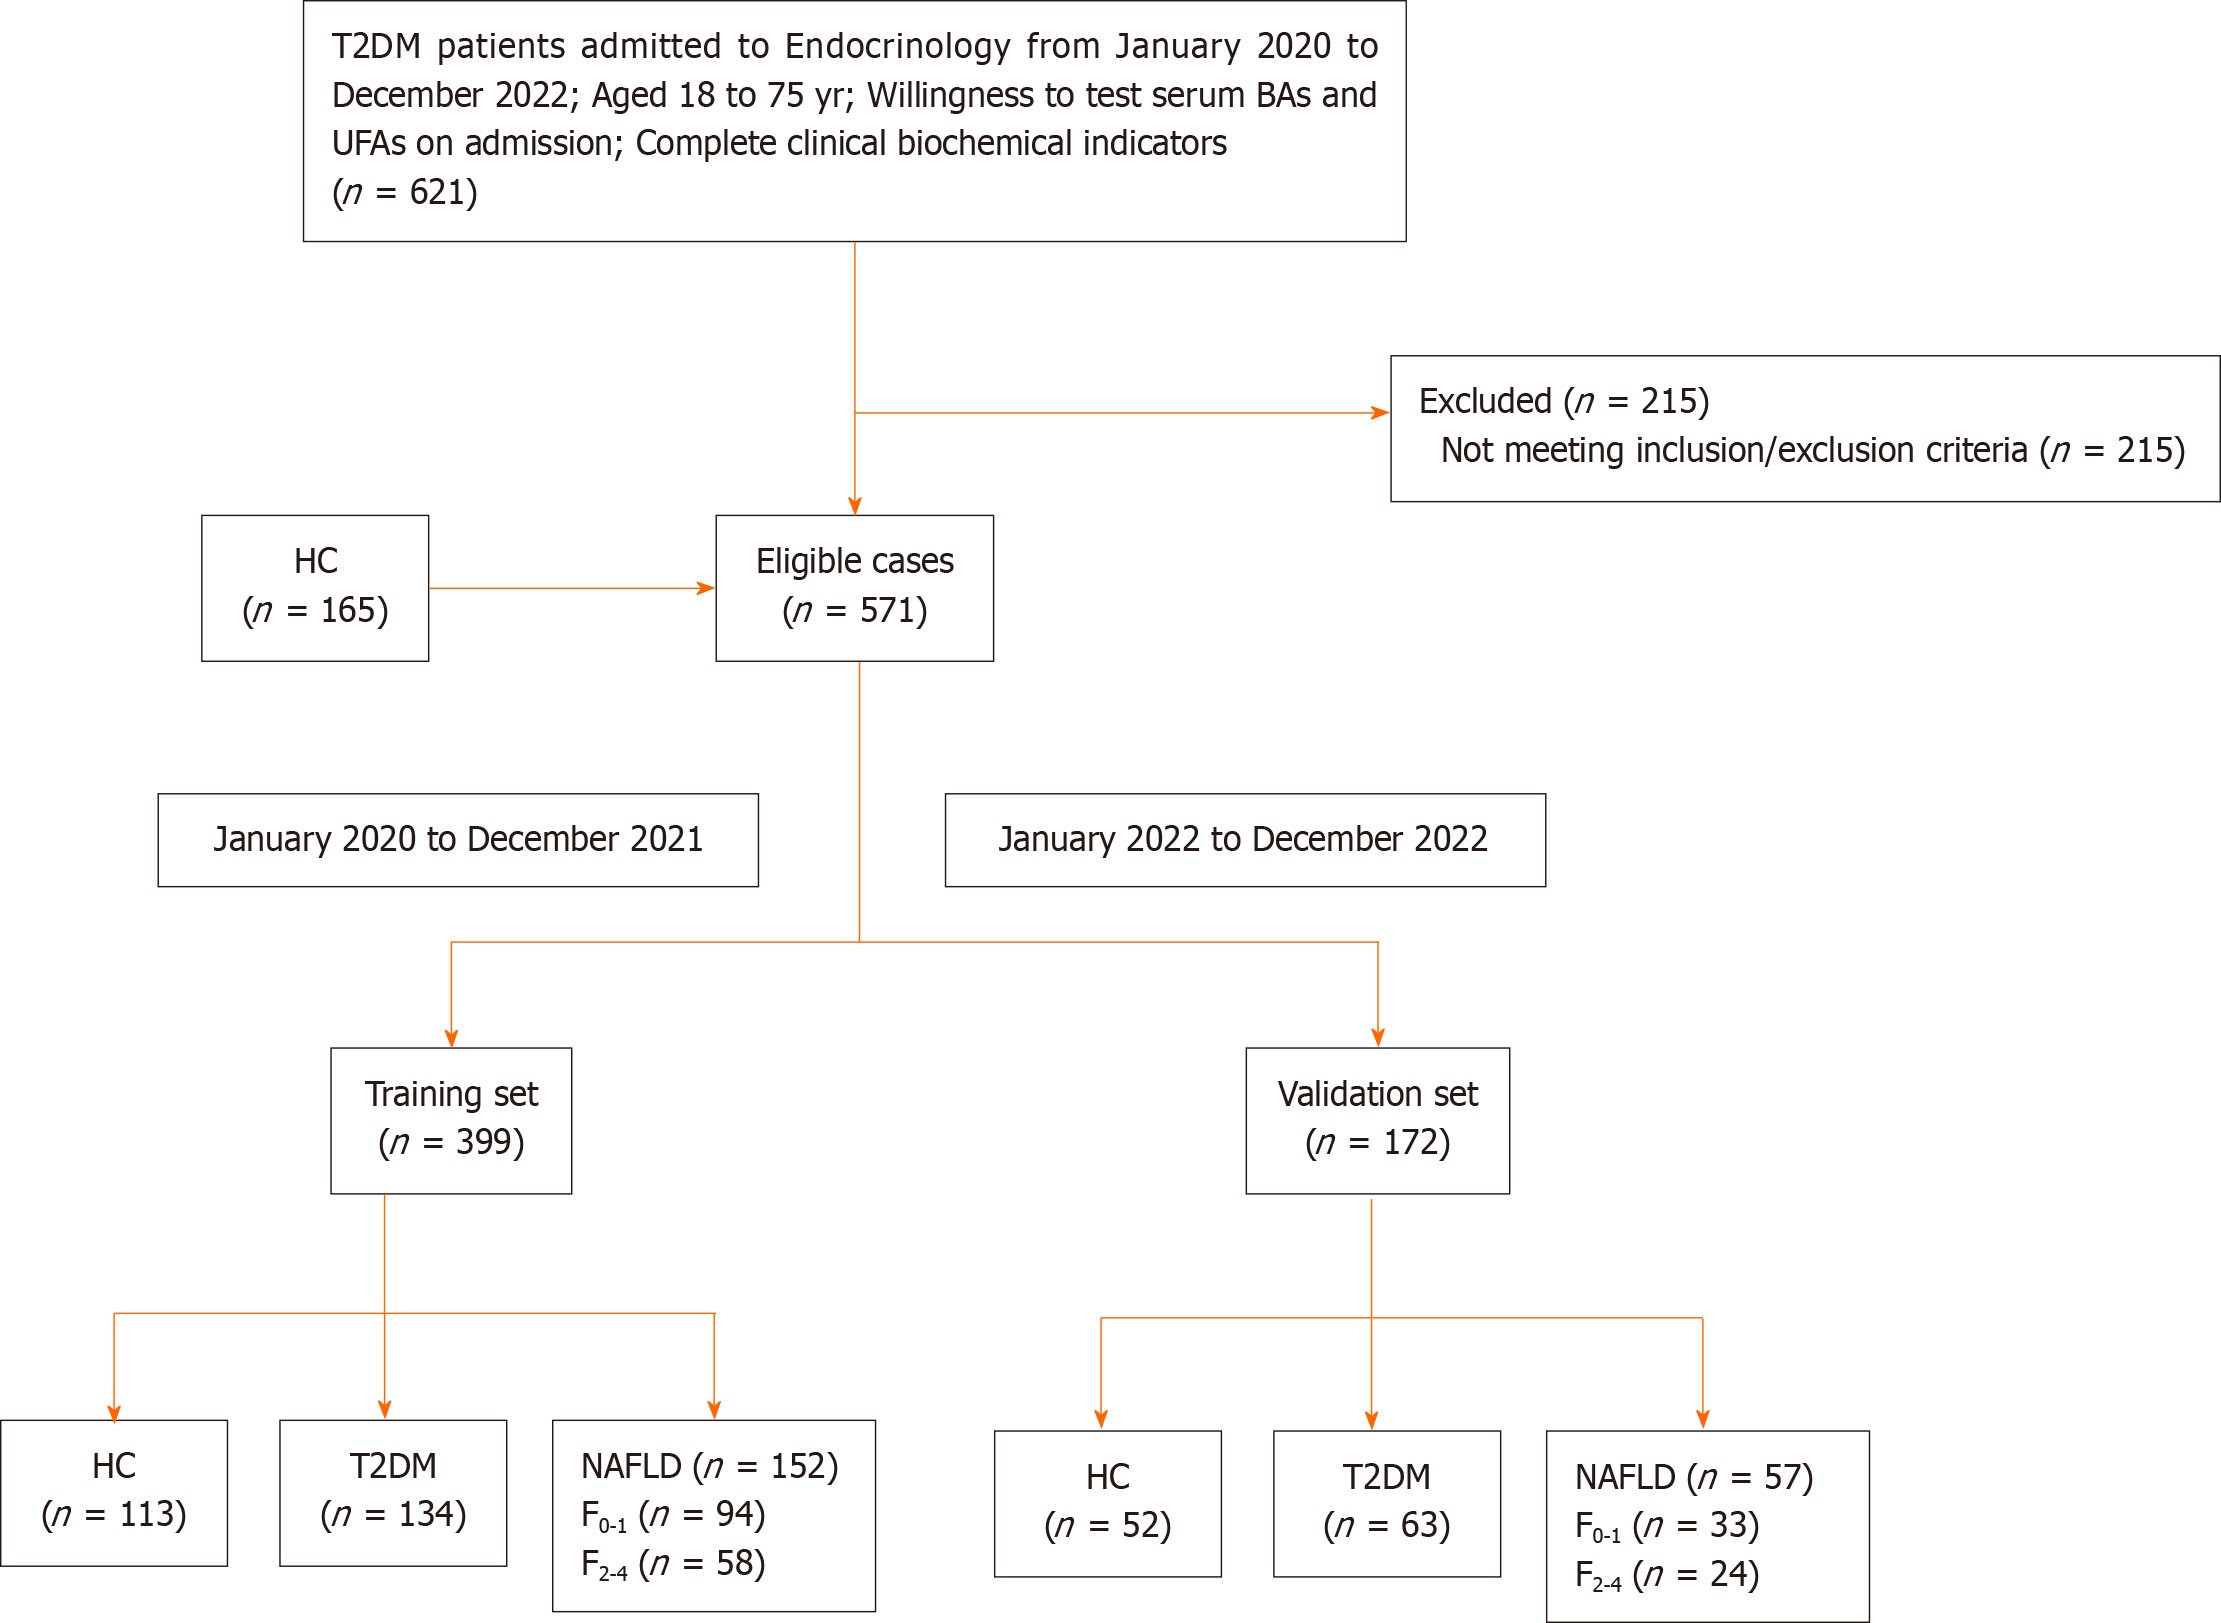
Figure 1 The flow diagram depicts the incorporation and distribution of the study cohort.
T2DM: Type 2 diabetes mellitus; HC: Healthy control; NAFLD: Non-alcoholic fatty liver disease; F0-1: No or mild clinically fibrosis with fibrosis 4 score (FIB-4) < 1.3; F2-4: Clinically significant fibrosis with FIB-4 ≥ 1.3; BAs: Bile acids; UFAs: Unsaturated fatty acids.
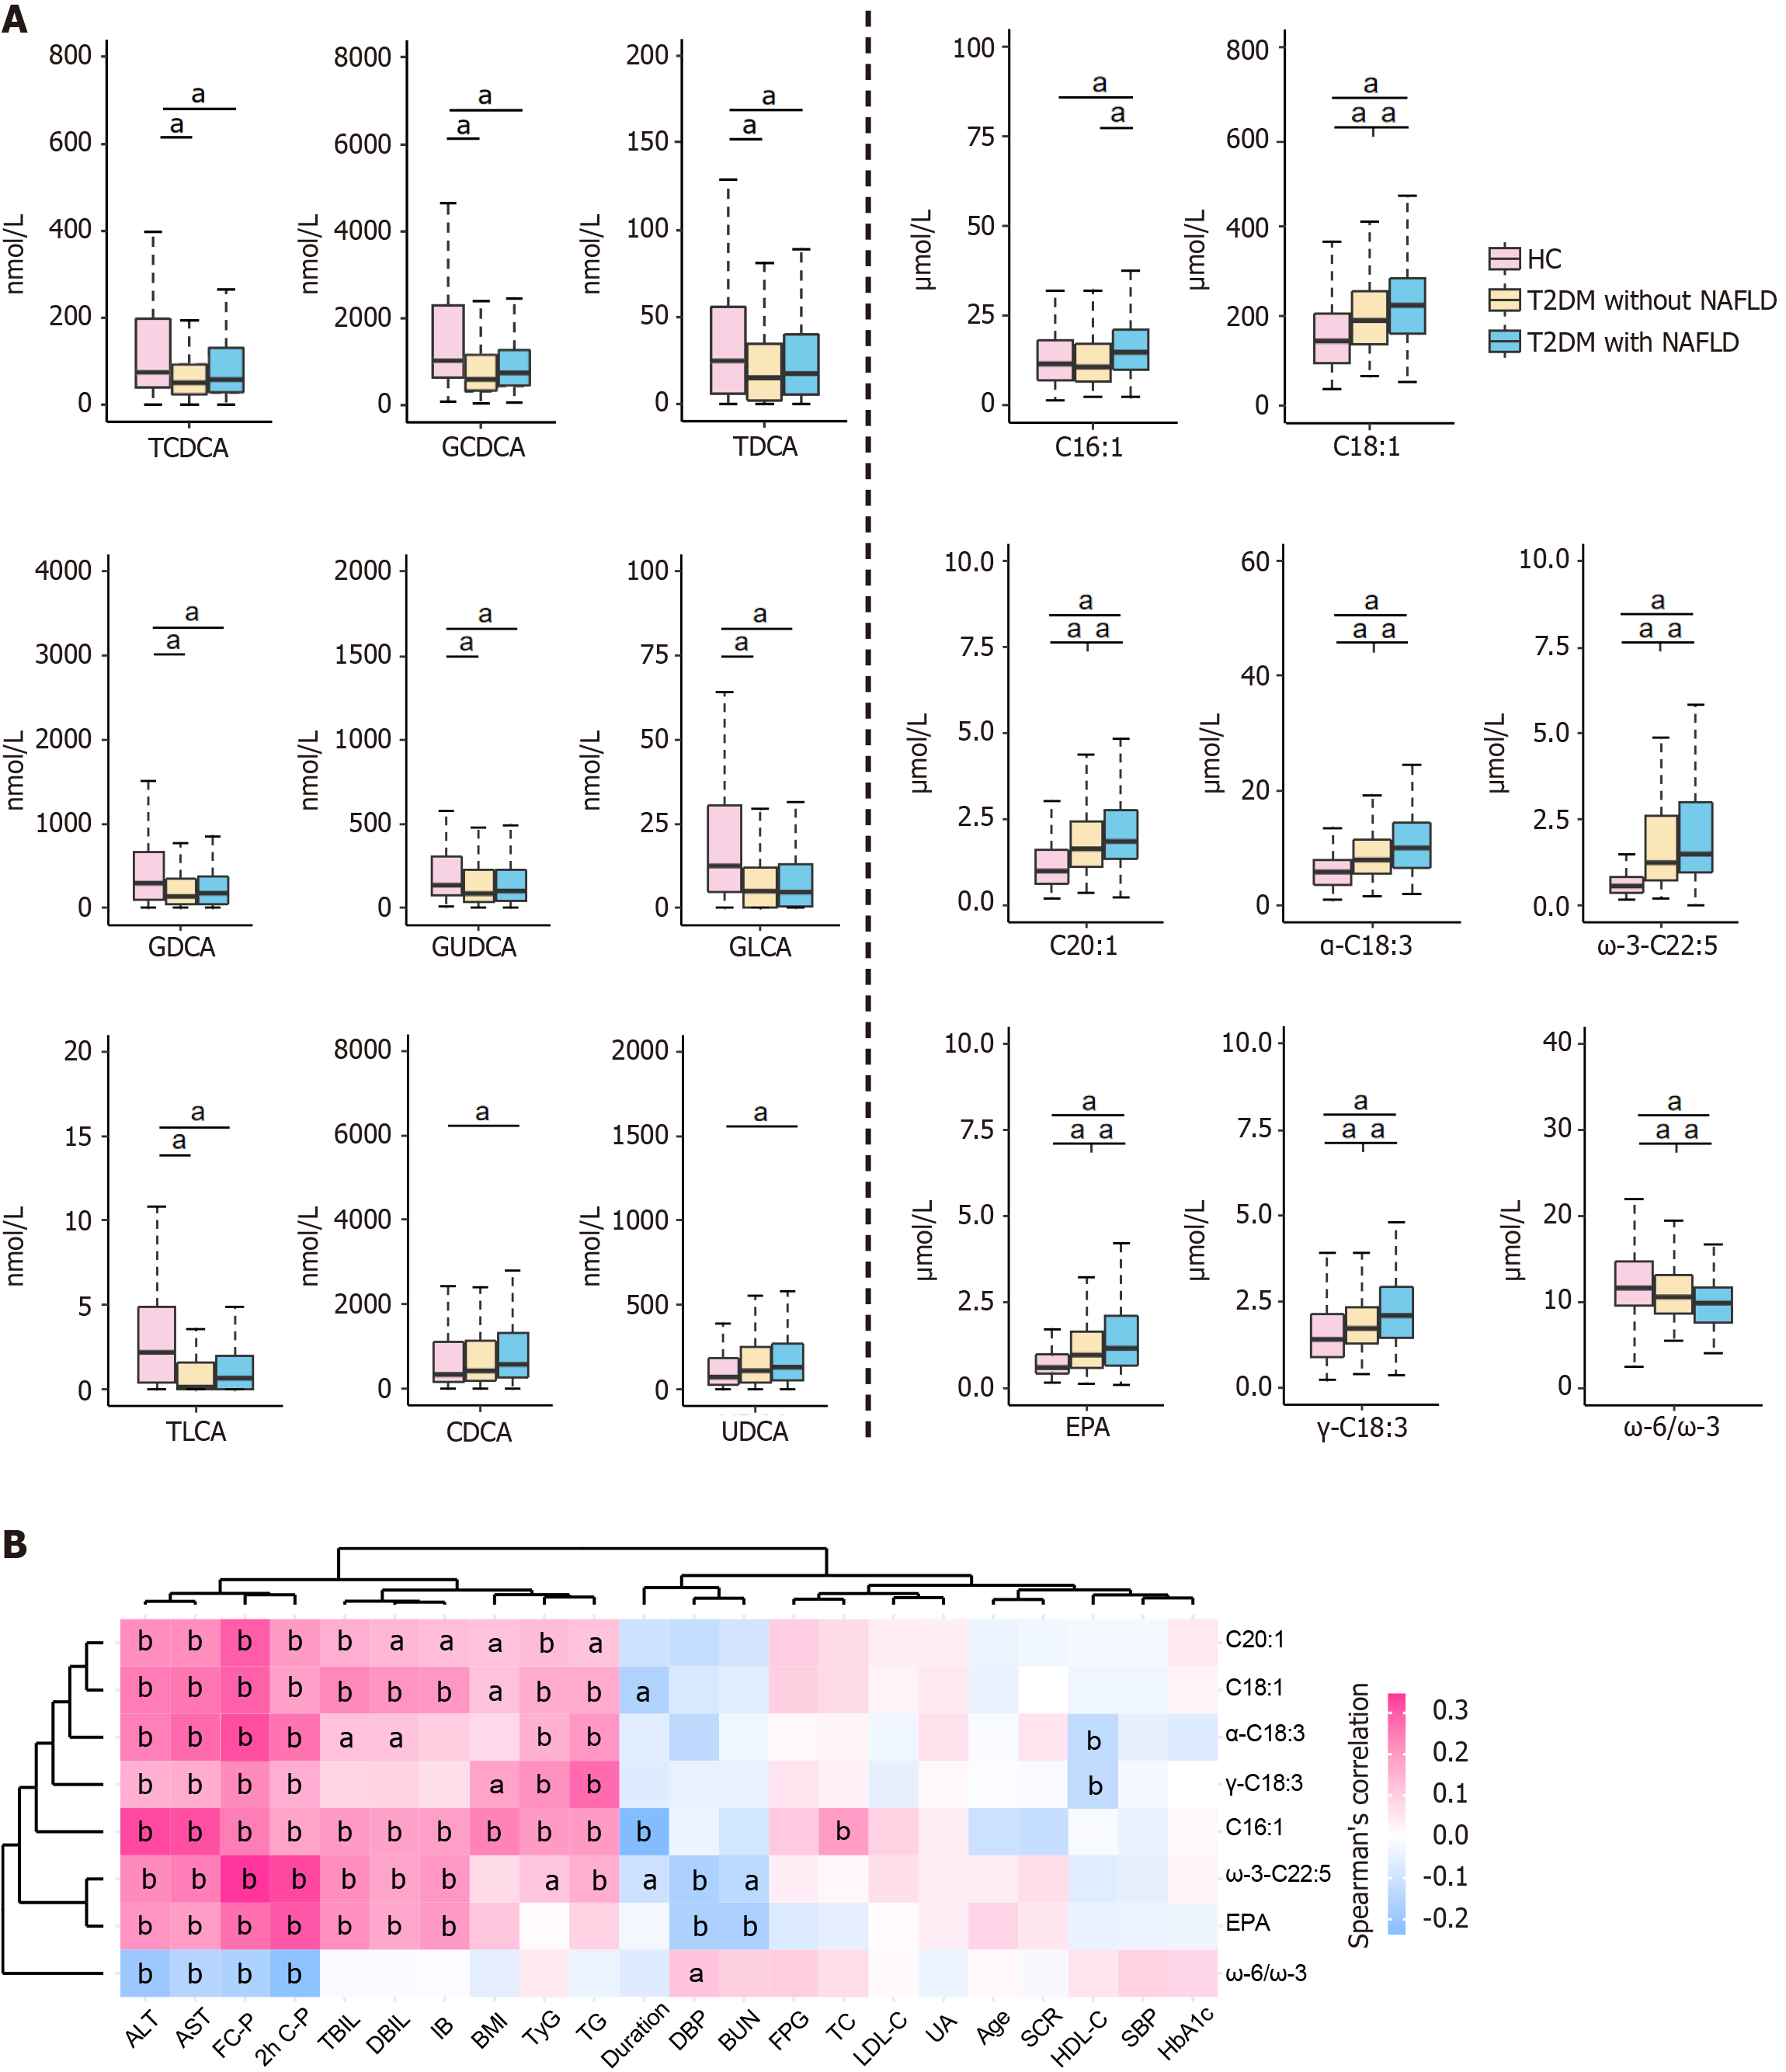
Figure 2 The distribution of bile acids and unsaturated fatty acids distribution among healthy control, type 2 diabetes mellitus without non-alcoholic fatty liver disease, and type 2 diabetes mellitus with non-alcoholic fatty liver disease is examined.
A: Clustering analysis is conducted to analyze the levels of serum bile acids (BAs) and unsaturated fatty acid (UFA). Serum levels of BAs and UFAs in three groups. Wilcoxon test (aP < 0.05); B: Spearman’s correlation analysis between UFAs and clinical indicators in type 2 diabetes mellitus with or without non-alcoholic fatty liver disease (aP < 0.05, bP < 0.01). T2DM: Type 2 diabetes mellitus; HC: Healthy control; NAFLD: Non-alcoholic fatty liver disease; ALT: Alanine aminotransferase; AST: Aspartate aminotransferase; C-P: C-peptide; TBIL: Total bilirubin; DBIL: Direct bilirubin; IB: Indirect bilirubin; BMI: Body mass index; TyG: Triglyceride glucose index; TG: Triglyceride; DBP: Diastolic blood pressure; BUN: Blood urea nitrogen; FPG: Fasting plasma glucose; TC: Total cholesterol; LDL-C: Low-density lipoprotein cholesterol; UA: Uric acid; SCR: Serum creatinine; HDL-C: High-density lipoprotein cholesterol; SBP: Systolic blood pressure; HbA1c: Glycosylated hemoglobin; CDCA: Chenodeoxycholic acid; TLCA: Taurolithocholicacid; GDCA: Glycodeoxycholic acid; UDCA: Ursodeoxycholic acid; TDCA: Taurodeoxycholic acid.
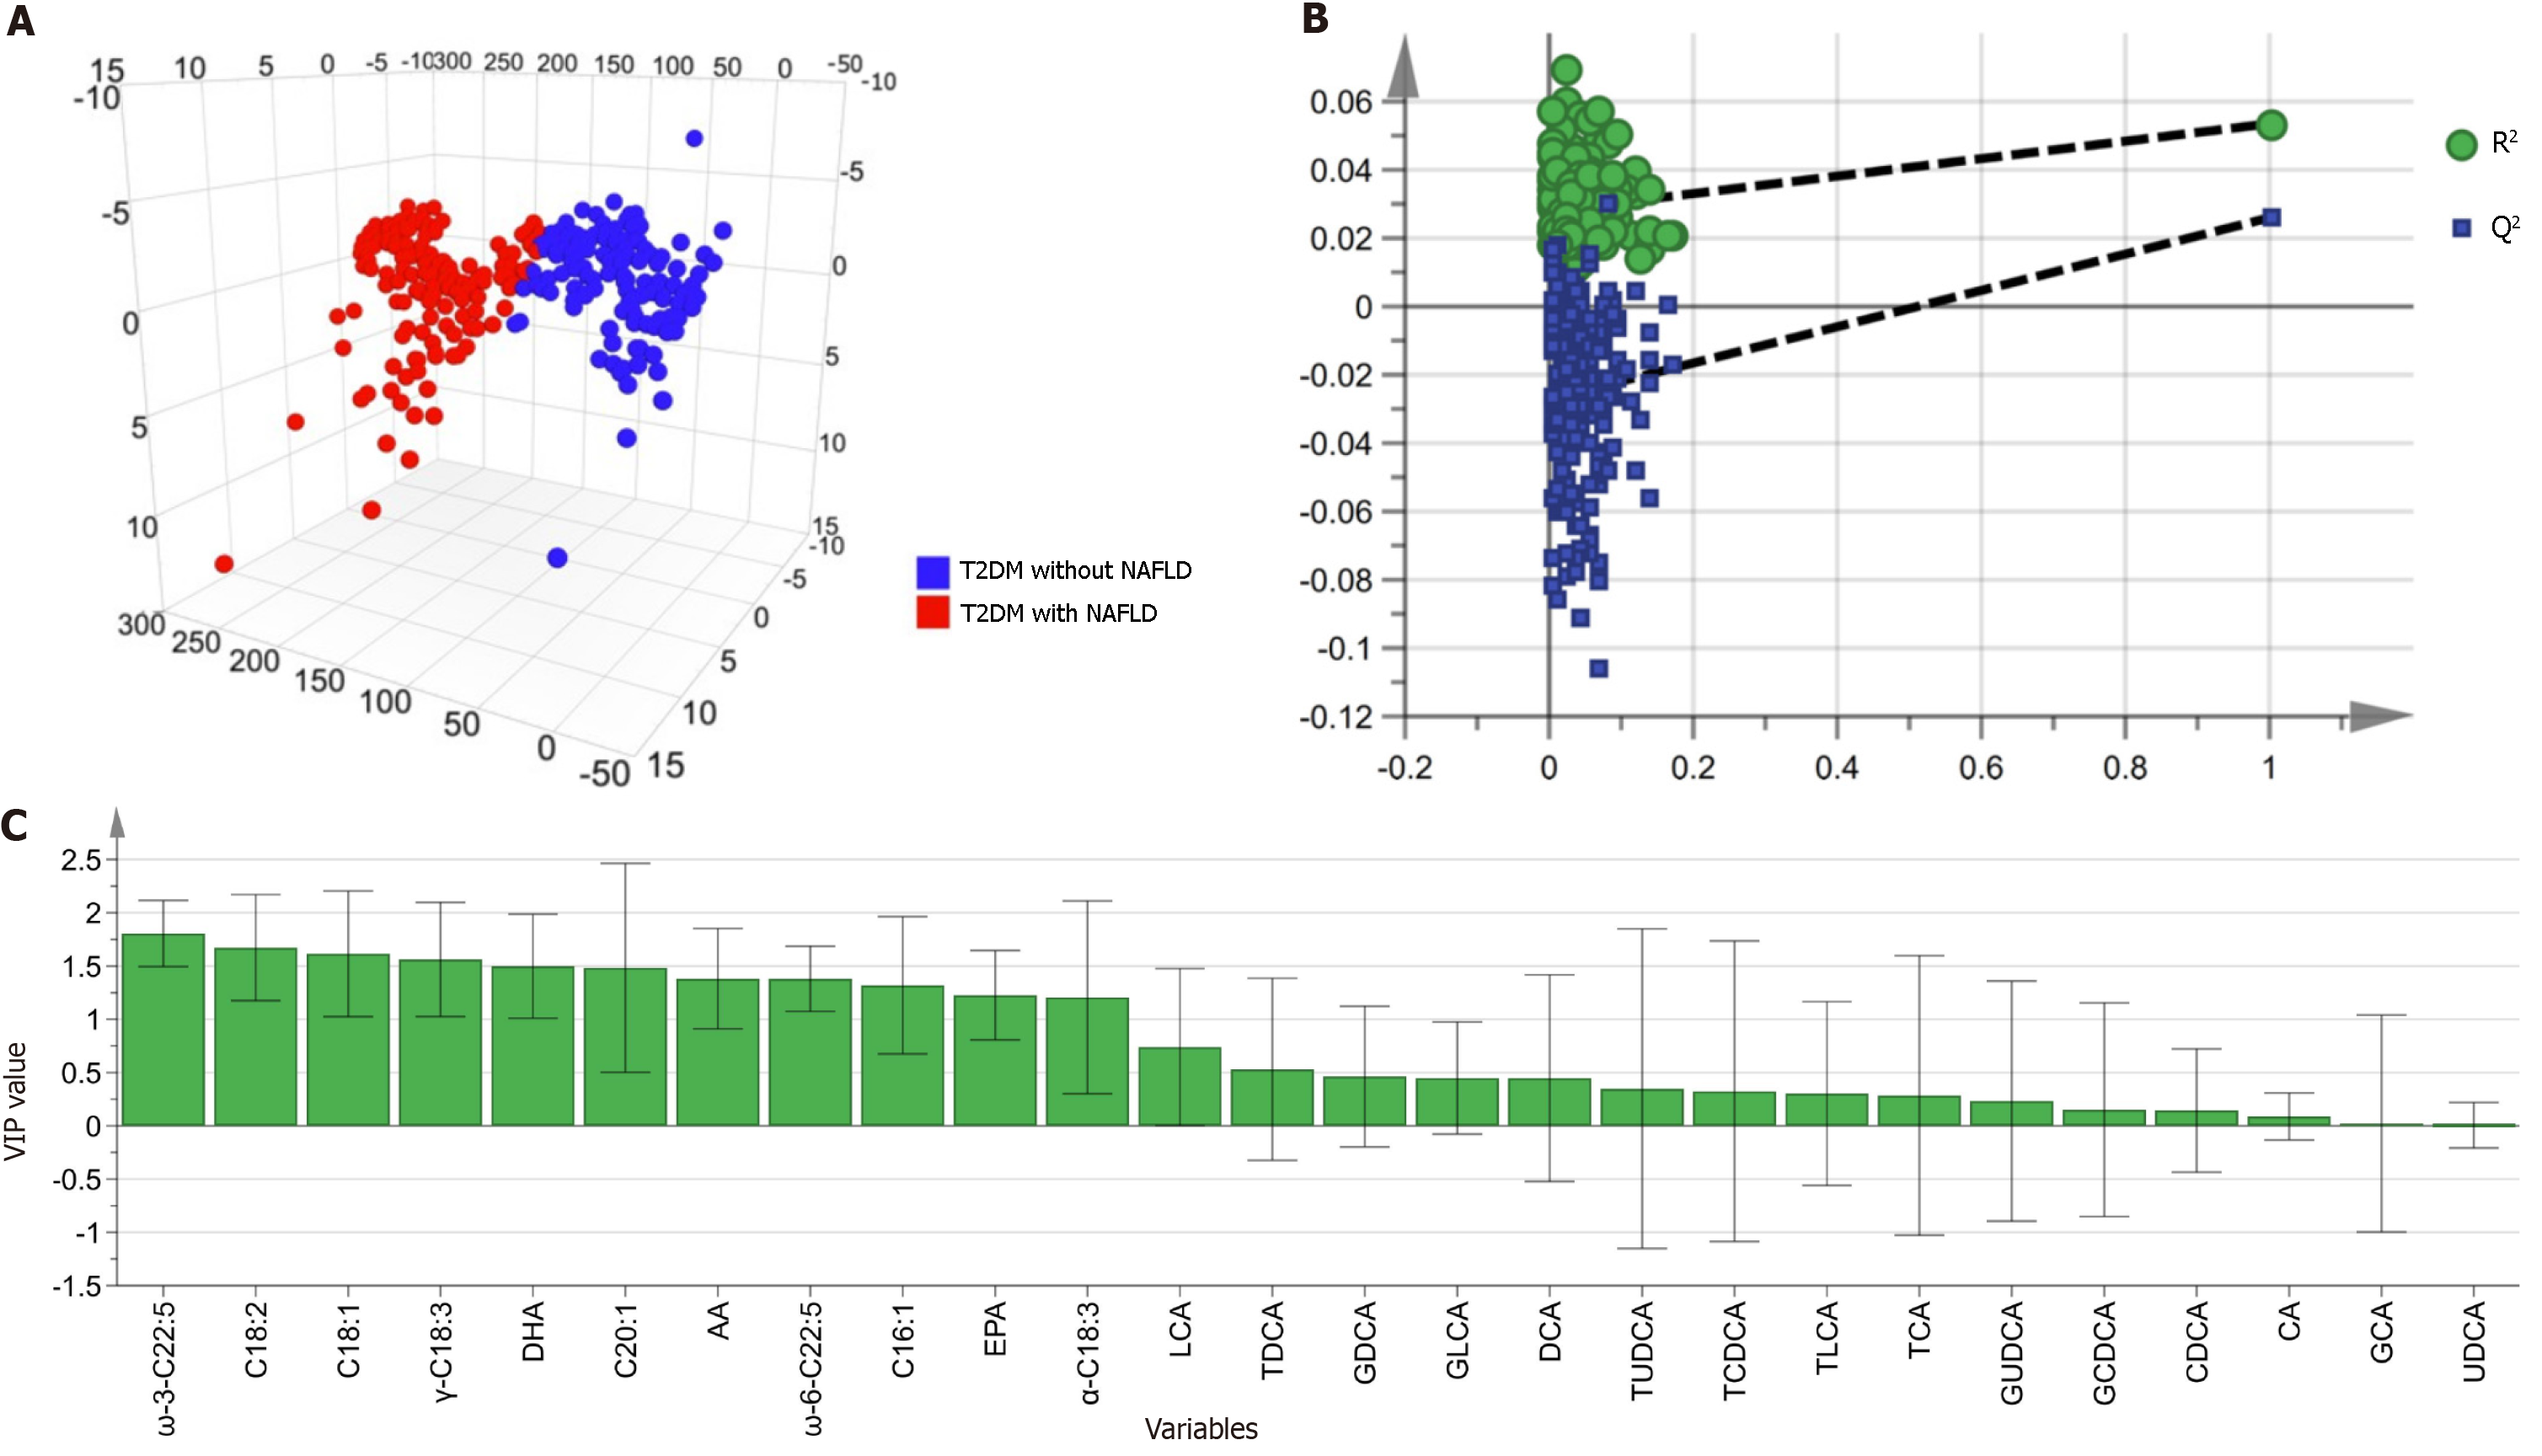
Figure 3 Multivariate analysis of bile acids and unsaturated fatty acids in orthogonal partial least squares-discriminant analysis model.
A: Orthogonal partial least squares-discriminant analysis (OPLS-DA) 3D model between type 2 diabetes (T2DM) with or without non-alcoholic fatty liver disease (NAFLD) groups. R2X = 0.227, R2Y = 0.054, and Q2Y = 0.026; B: The 200−permutation test demonstrated no overfitting in the OPLS-DA model [Q2 = (0, -0.025), R2 = (0, 0.028)]; C: The contribution of the metabolite to distinguish T2DM with or without NAFLD is indicated by variable influence on projection values. NAFLD: Non-alcoholic fatty liver disease; CDCA: Chenodeoxycholic acid; TLCA: Taurolithocholicacid; GDCA: Glycodeoxycholic acid; UDCA: Ursodeoxycholic acid.
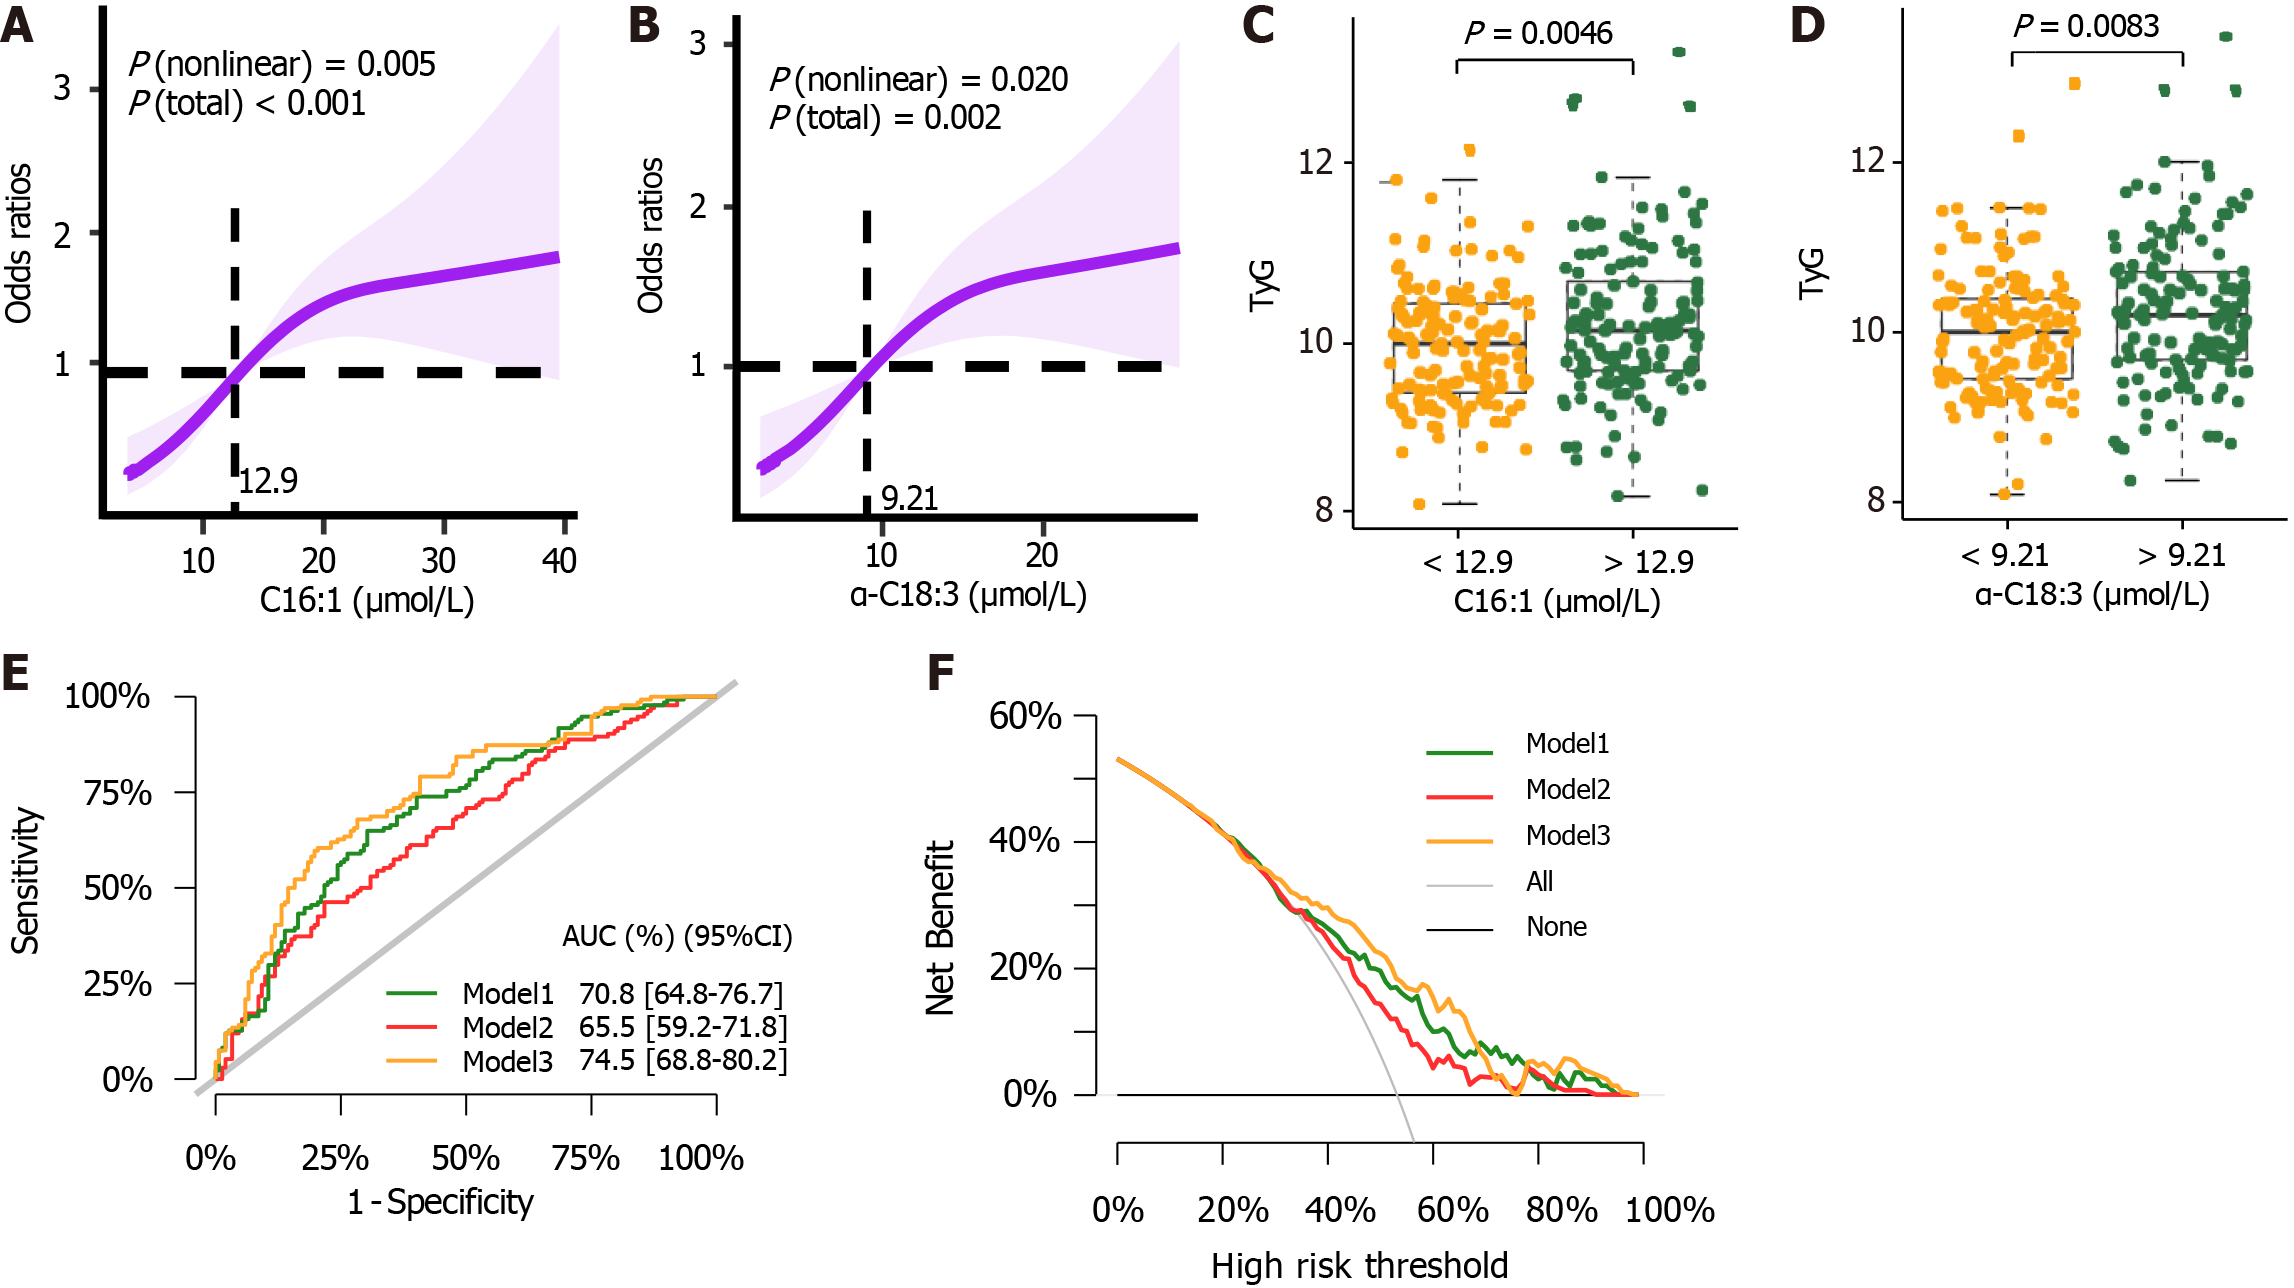
Figure 4 Logistic regression risk prediction model about non-alcoholic fatty liver disease in type 2 diabetes mellitus.
A: Odds ratio (OR) was represented in restricted cubic splines (RCS) nested showing association of palmitoleic acid (C16:1) level on a continuous scale and non-alcoholic fatty liver disease (NAFLD) in type 2 diabetes mellitus (T2DM); B: OR was represented in RCS nested showing association of alpha-octadecatrienoic acid (α-C18:3) level on a continuous scale and NAFLD in T2DM. Shaded areas represent 95% confidence interval (95%CI). 12.9 and 9.21 μmol/L were set as the reference values for C16:1 and α-C18:3 respectively; C: C16:1 was analyzed for their relationship with Triglyceride glucose index (TyG) by threshold; D: α-C18:3 was analyzed for their relationship with TyG by threshold. The statistical comparison was performed by the Wilcoxon test (statistically significant: P < 0.05); E: Comparison of three NAFLD predictive model assessments of the 95%CI of their area under the curve values; F: Comparison of model performance from Decision Curve analysis. Model 1 consists of C16:1, α-C18:3, eicosapentaenoic acid, ω-3 docosapentaenoic acid, γ-linolenic acid. Model 2 consists of sex, age, body mass index, systolic blood pressure, duration of diabetes, TyG, high-density lipoprotein cholesterol, glycosylated hemoglobin, fasting c-peptide, and c-peptide 2 h postprandial. Model 3 was constructed by the factors of model 2 and model 1 together. C16:1: Association of palmitoleic acid; α-C18:3: Alpha-octadecatrienoic acid; 95%CI: 95% confidence interval; AUC: Area under the curve.
Figure 5 Performances of two unsaturated fatty acids with the ability to identify clinically significant fibrosis in nonalcoholic fatty liver disease.
A: Serum levels of alpha-octadecatrienoic acid (α-C18:3) in healthy control (HC), type 2 diabetes mellitus (T2DM), no or mild clinically fibrosis with fibrosis 4 score (FIB-4) < 1.3 (F0-1) and clinically significant fibrosis with FIB-4 ≥ 1.3 (F2-4) groups; B: Serum levels of γ-linolenic acid (γ-C18:3) in HC, T2DM, F0-1 and F2-4 groups; C: Comparison of three clinically significant fibrosis predictive model assessments of the 95%CI on their area under the curve values. Model 1 consists of α-C18:3 and γ-C18:3. Model 2 consists of sex, age, body mass index, systolic blood pressure, duration of diabetes, Triglyceride glucose index, high-density lipoprotein cholesterol, glycosylated hemoglobin, fasting c-peptide, and c-peptide 2 h postprandial. Model 3 was constructed by the factors of model 2 and model 1 together. Wilcoxon test (aP < 0.05). α-C18:3: Alpha-octadecatrienoic acid; HC: Healthy control; γ-C18:3: γ-linolenic acid; T2DM: Type 2 diabetes mellitus; 95%CI: 95% confidence interval; HC: Healthy control; AUC: Area under the curve; F0-1: No or mild clinically fibrosis with fibrosis 4 score (FIB-4) < 1.3; F2-4: Clinically significant fibrosis with FIB-4 ≥ 1.3.
- Citation: Feng SS, Wang SJ, Guo L, Ma PP, Ye XL, Pan ML, Hang B, Mao JH, Snijders AM, Lu YB, Ding DF. Serum bile acid and unsaturated fatty acid profiles of non-alcoholic fatty liver disease in type 2 diabetic patients. World J Diabetes 2024; 15(5): 898-913
- URL: https://www.wjgnet.com/1948-9358/full/v15/i5/898.htm
- DOI: https://dx.doi.org/10.4239/wjd.v15.i5.898


