Copyright
©The Author(s) 2024.
World J Diabetes. May 15, 2024; 15(5): 886-897
Published online May 15, 2024. doi: 10.4239/wjd.v15.i5.886
Published online May 15, 2024. doi: 10.4239/wjd.v15.i5.886
Figure 1 Histological appearance of metabolic dysfunction-associated steatotic liver disease and metabolic dysfunction-associated steatohepatitis at 100 × magnification (hematoxylin and eosin stain).
A: A non-alcoholic fatty liver diseases activity score (NAS) 3/8; B: A NAS 6/8 which constitutes a moderate-severe steatohepatitis. Blue triangles denote macrovesicular steatosis. Black stars denote ballooned hepatocytes. Black bars in lower right corner denote scale bar of 50 μm.
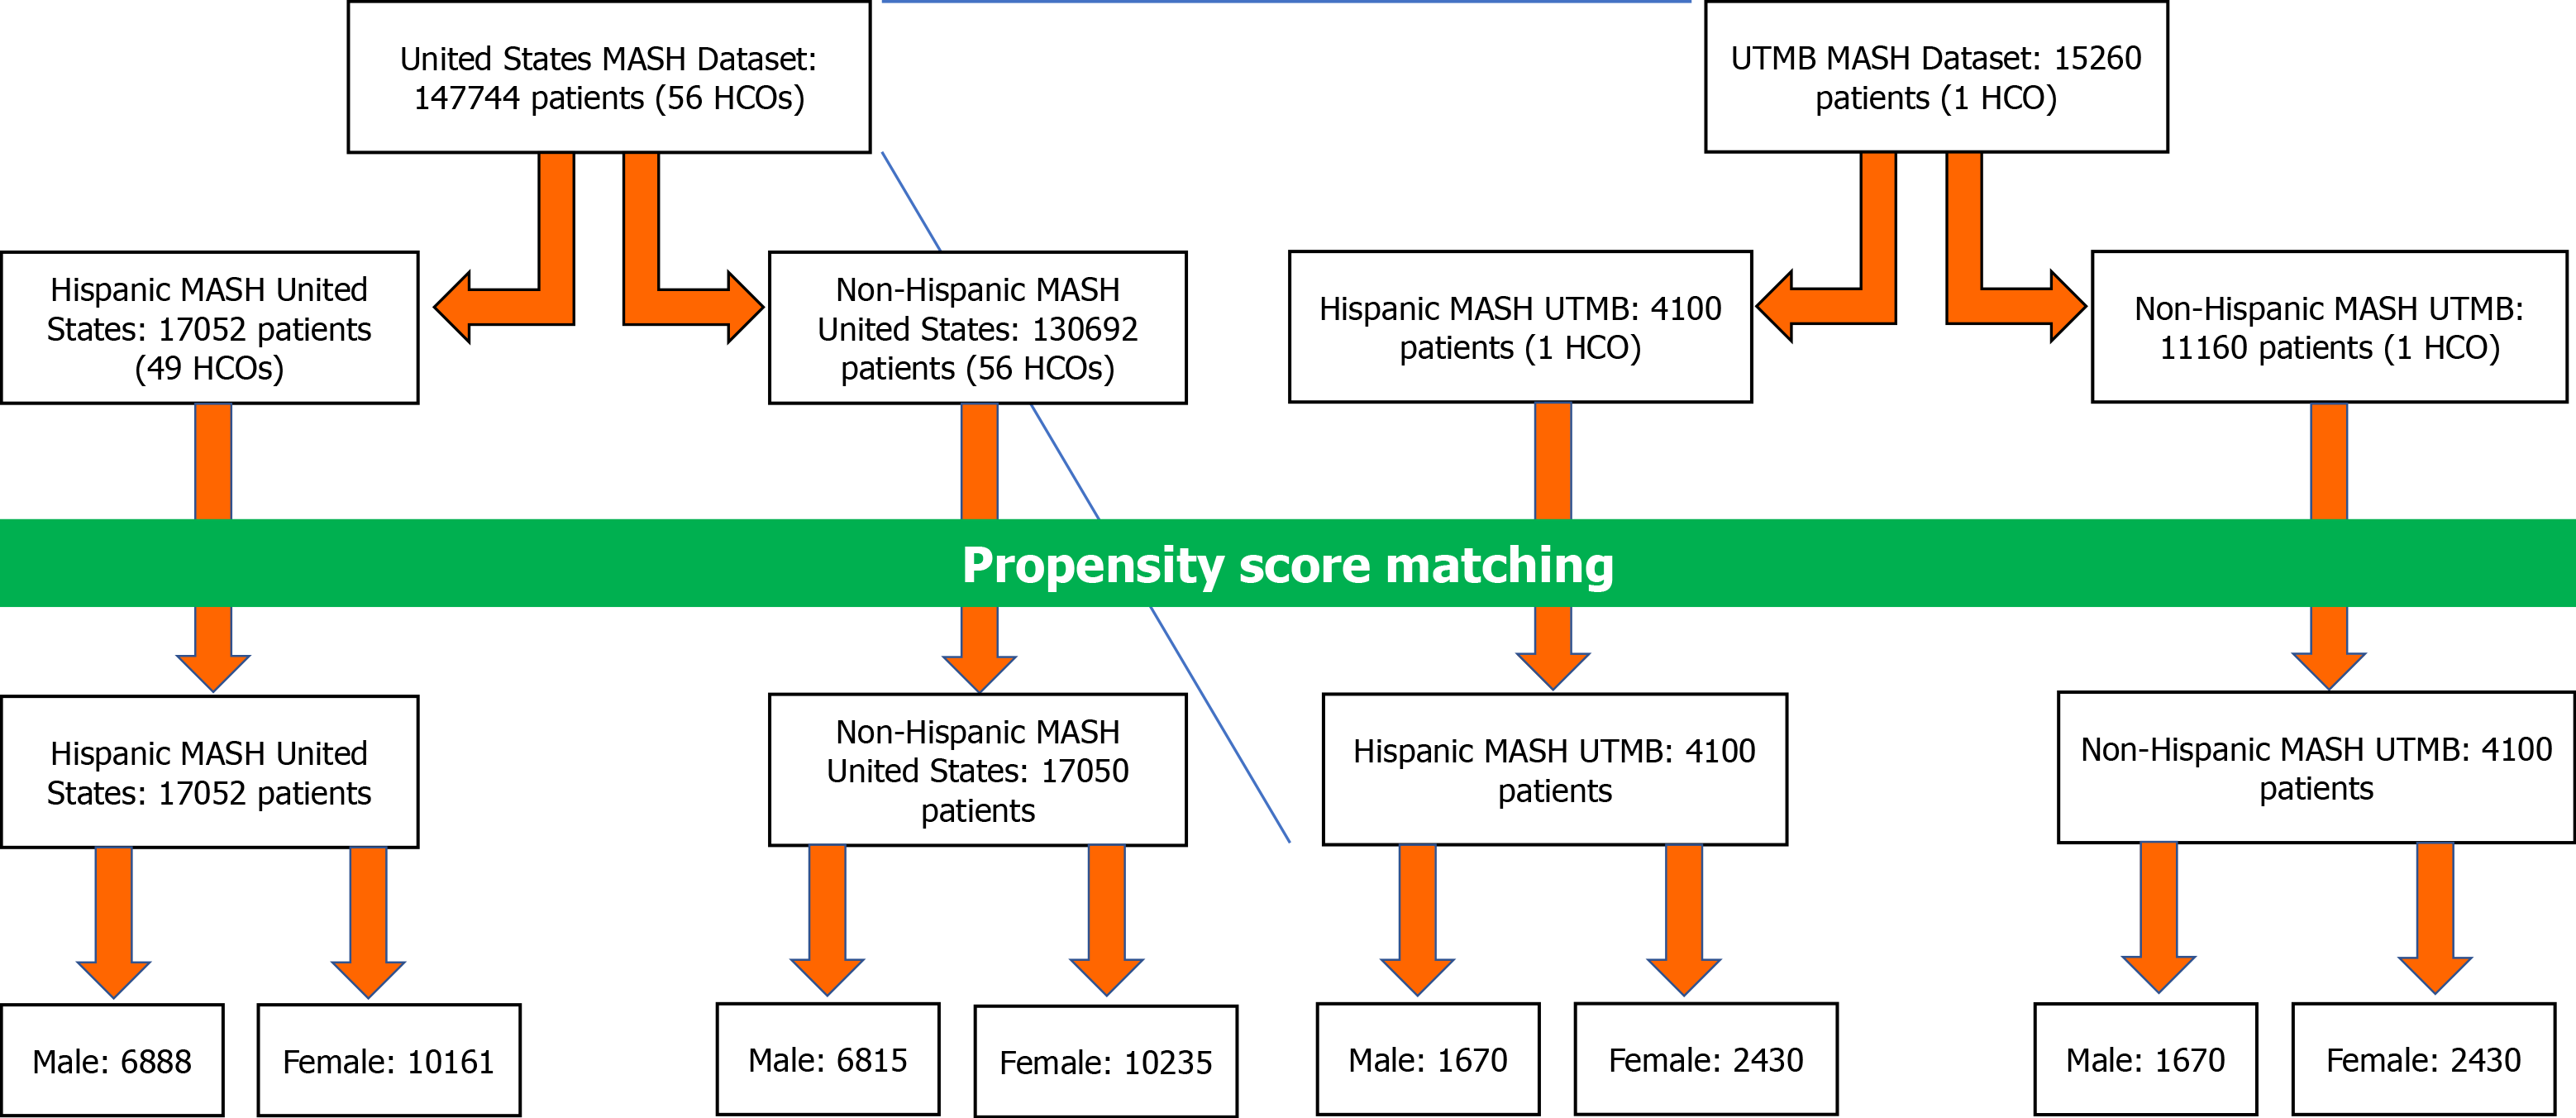
Figure 2 Patient demographic flow chart.
The chart demonstrates the total number of metabolic dysfunction-associated steatohepatitis patients in both United States and University of Texas Medical Branch cohorts, total number of Hispanic/Latino and non-Hispanic/Latino patients in each cohort, the effects of Propensity Score Matching on cohort size, and the total number of male and female patients in each sub-cohort. MASH: Metabolic dysfunction-associated steatohepatitis; UTMB: University of Texas Medical Branch; HCO: Healthcare organizations.
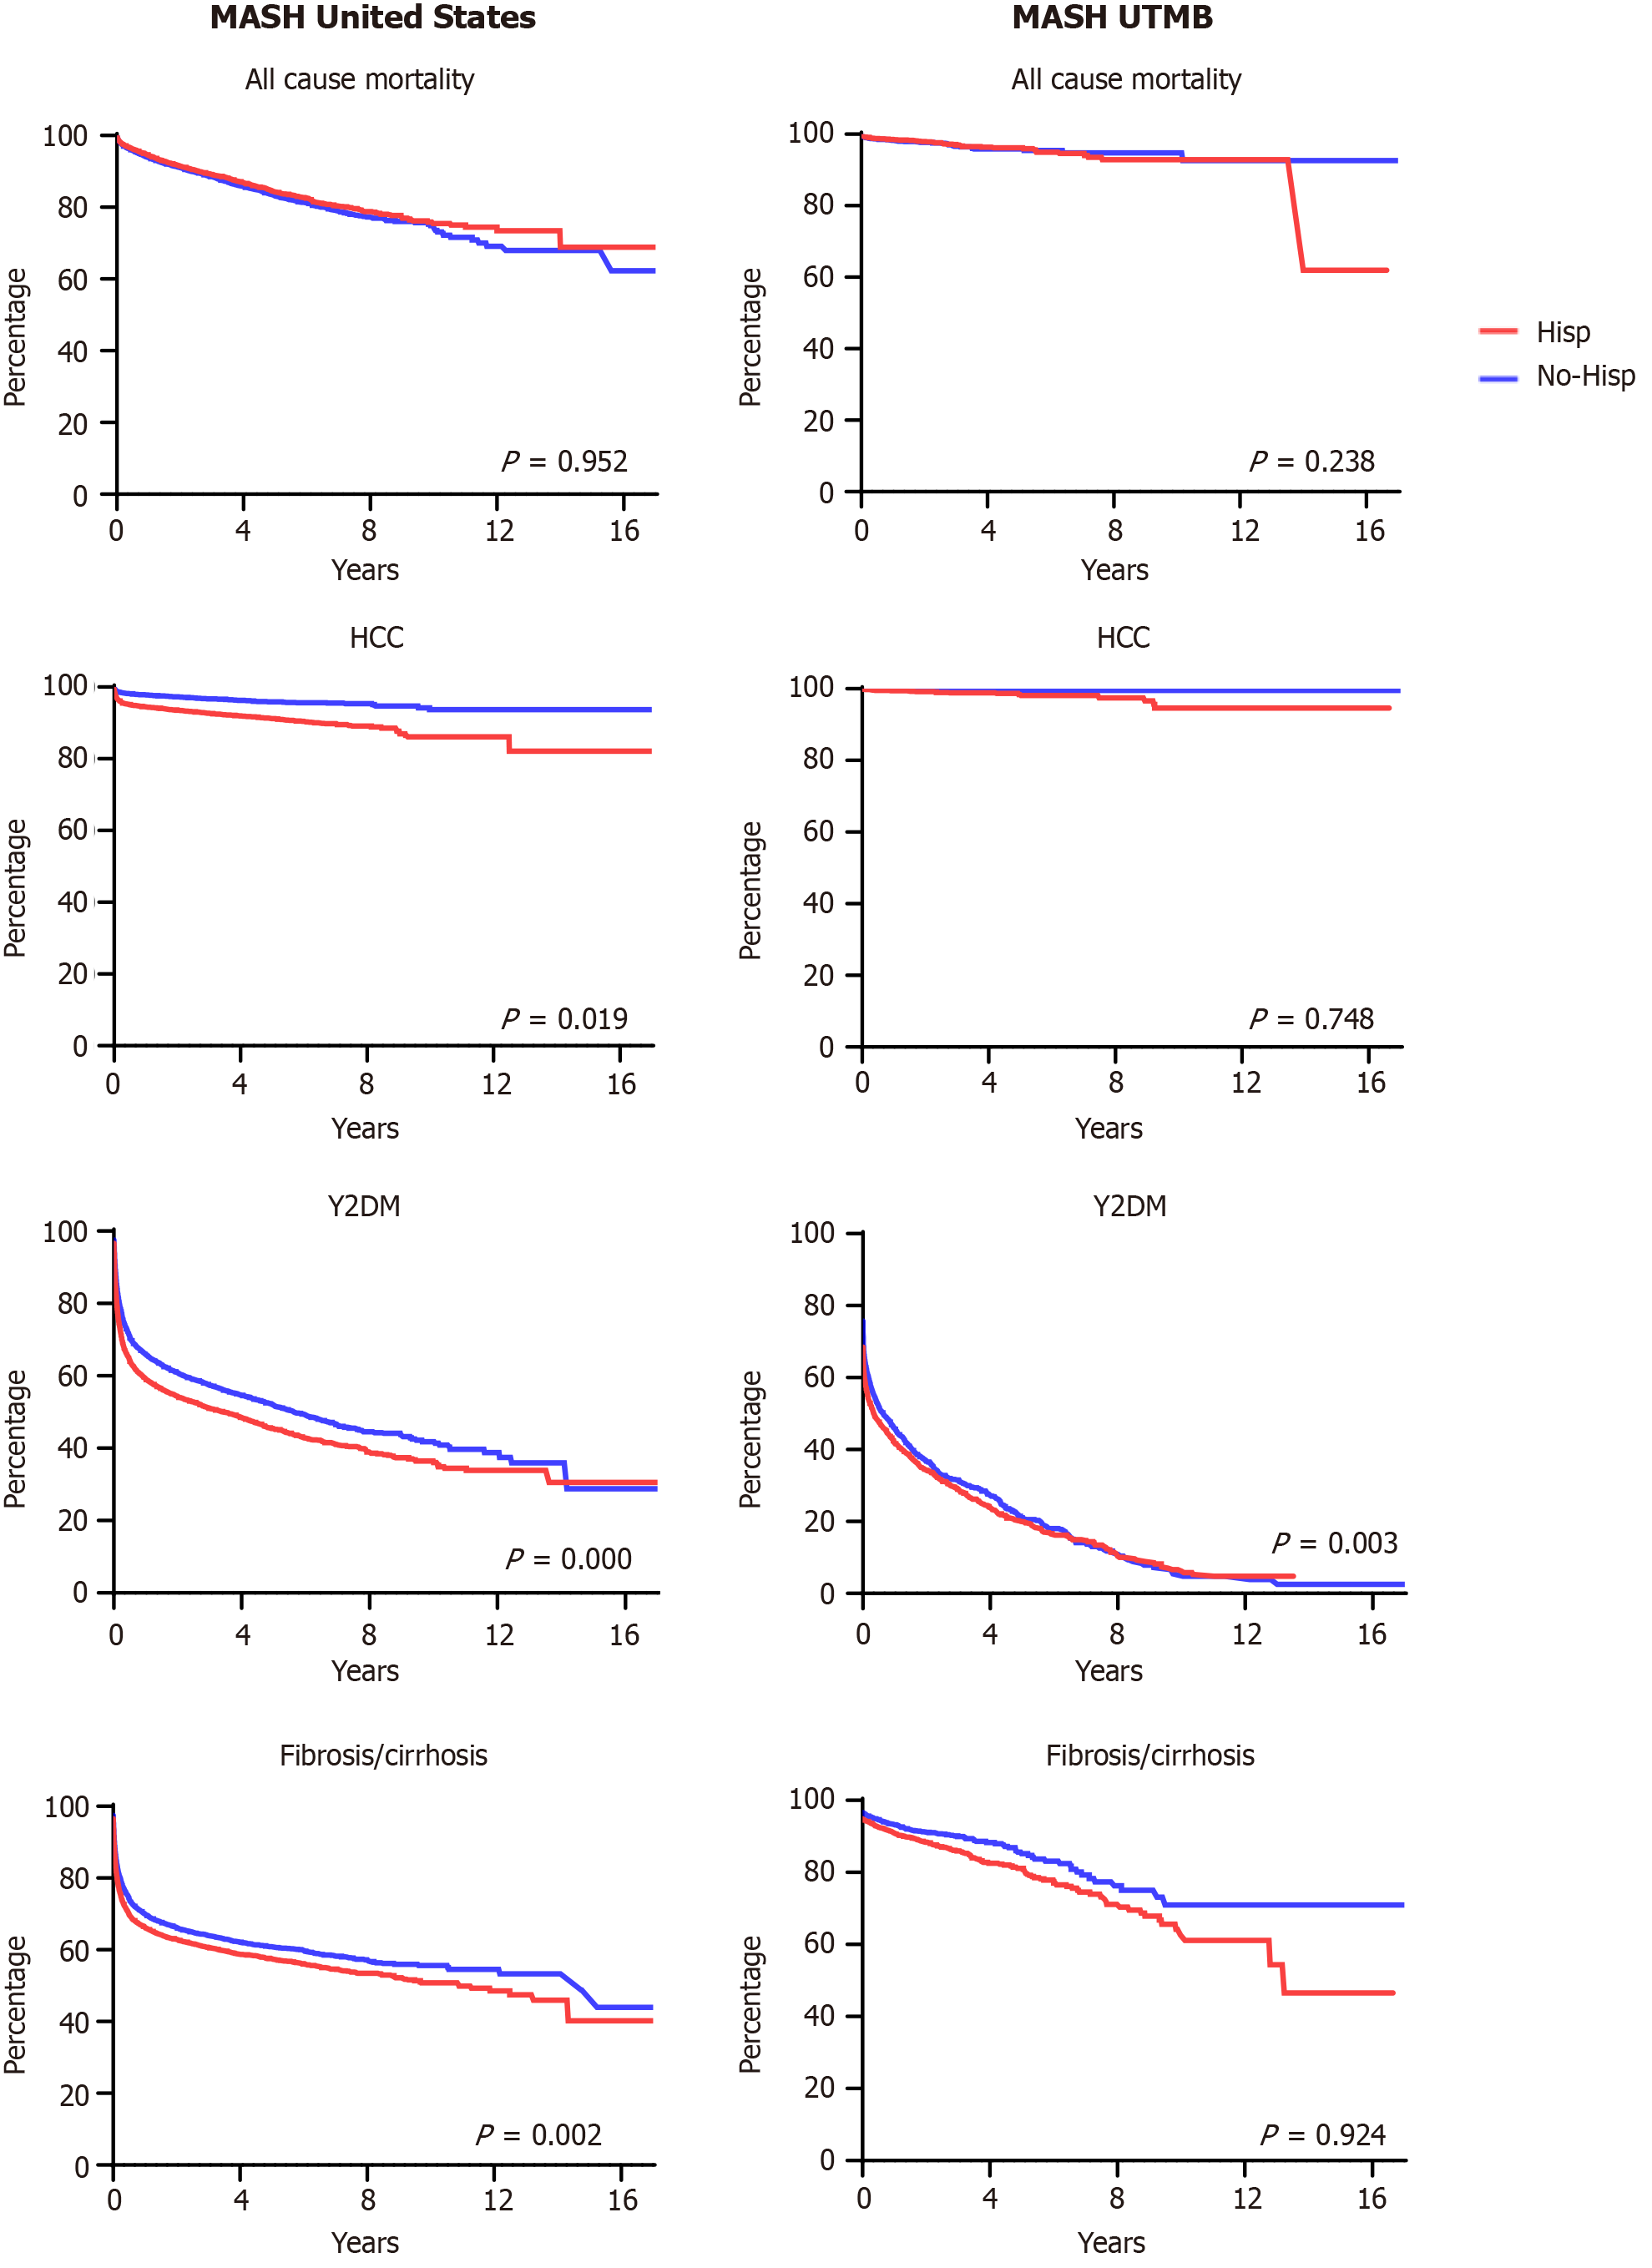
Figure 3 Kaplan-Meier survival analysis curves for United States and University of Texas Medical Branch cohorts.
Hispanic/Latino patients are represented in red, while non-Hispanic/Latino patients are represented in blue. The four primary outcomes (all-cause mortality, hepatocellular carcinoma, type 2 diabetes mellitus, and fibrosis/cirrhosis of the liver) are represented for both cohorts. MASH: Metabolic dysfunction-associated steatohepatitis; UTMB: University of Texas Medical Branch; HCC: Hepatocellular carcinoma; T2DM: Type 2 diabetes mellitus.
- Citation: Gosnell JM, Golovko G, Arroyave E, Moghe A, Kueht ML, Saldarriaga OA, McKinney KH, Stevenson HL, Ferguson MR. Disparate outcomes in Hispanic patients with metabolic dysfunction-associated steatotic liver disease/steatohepatitis and type 2 diabetes: Large cohort study. World J Diabetes 2024; 15(5): 886-897
- URL: https://www.wjgnet.com/1948-9358/full/v15/i5/886.htm
- DOI: https://dx.doi.org/10.4239/wjd.v15.i5.886


