Copyright
©The Author(s) 2024.
World J Diabetes. Apr 15, 2024; 15(4): 724-734
Published online Apr 15, 2024. doi: 10.4239/wjd.v15.i4.724
Published online Apr 15, 2024. doi: 10.4239/wjd.v15.i4.724
Figure 1 Teneligliptin ameliorated myocardial hypertrophy in streptozotocin-induced diabetic mice.
A: Molecular structure of teneligliptin; B: Quantitative analysis of cardiomyocyte area; C: Heart weight/tibia length. aP < 0.05 vs control group; bP < 0.05 vs streptozotocin group, n = 8. STZ: Streptozotocin.
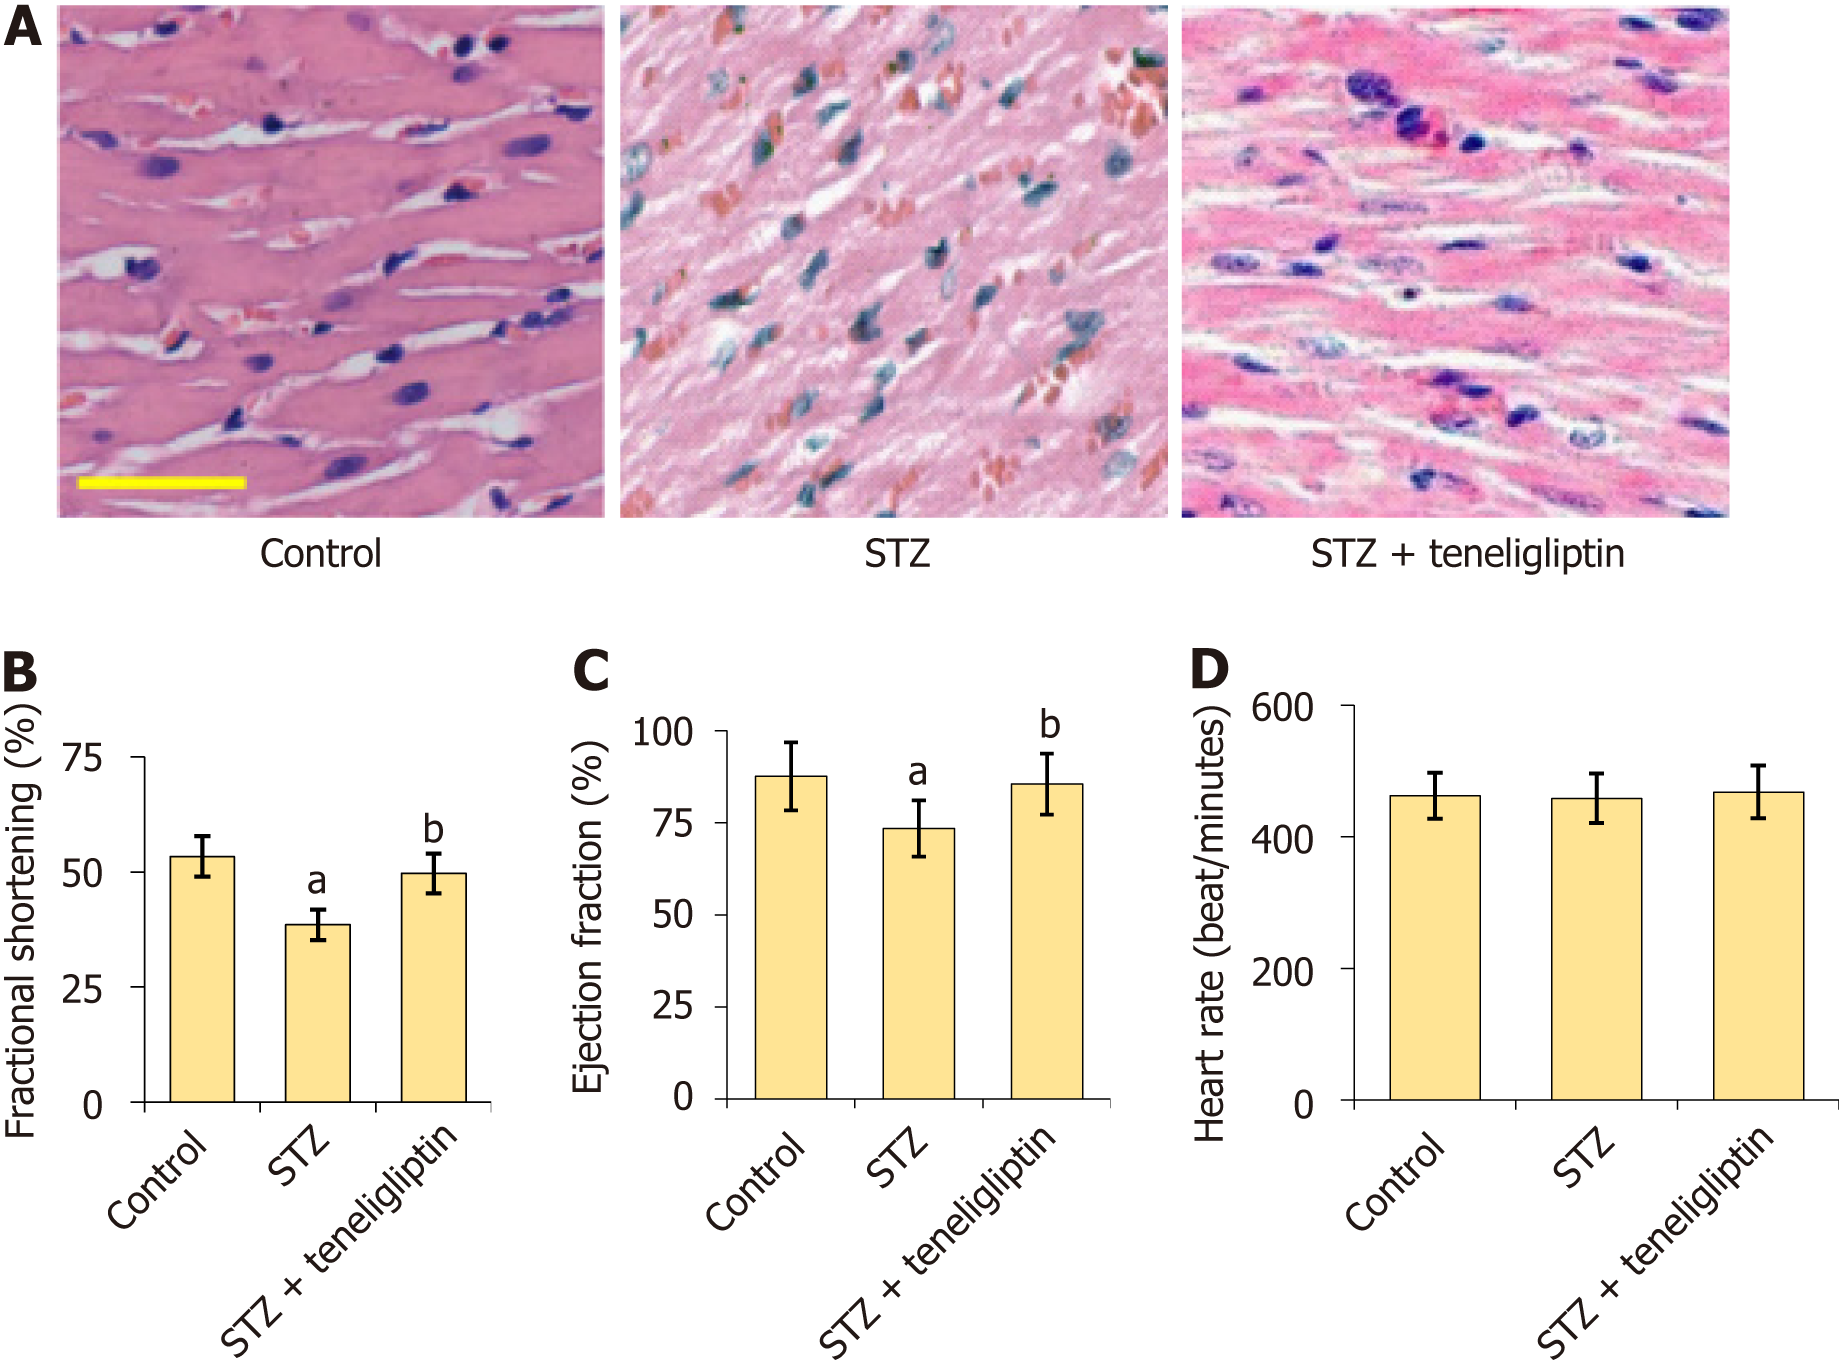
Figure 2 Teneligliptin improved heart function in streptozotocin-induced diabetic mice.
A: The results of HE staining, Scale bar = 50 µm; B-D: Mice heart fractional shortening, ejection fraction, and heart rate was measured by echo. aP < 0.05 vs control group; bP < 0.05 vs streptozotocin group, n = 8. STZ: Streptozotocin.
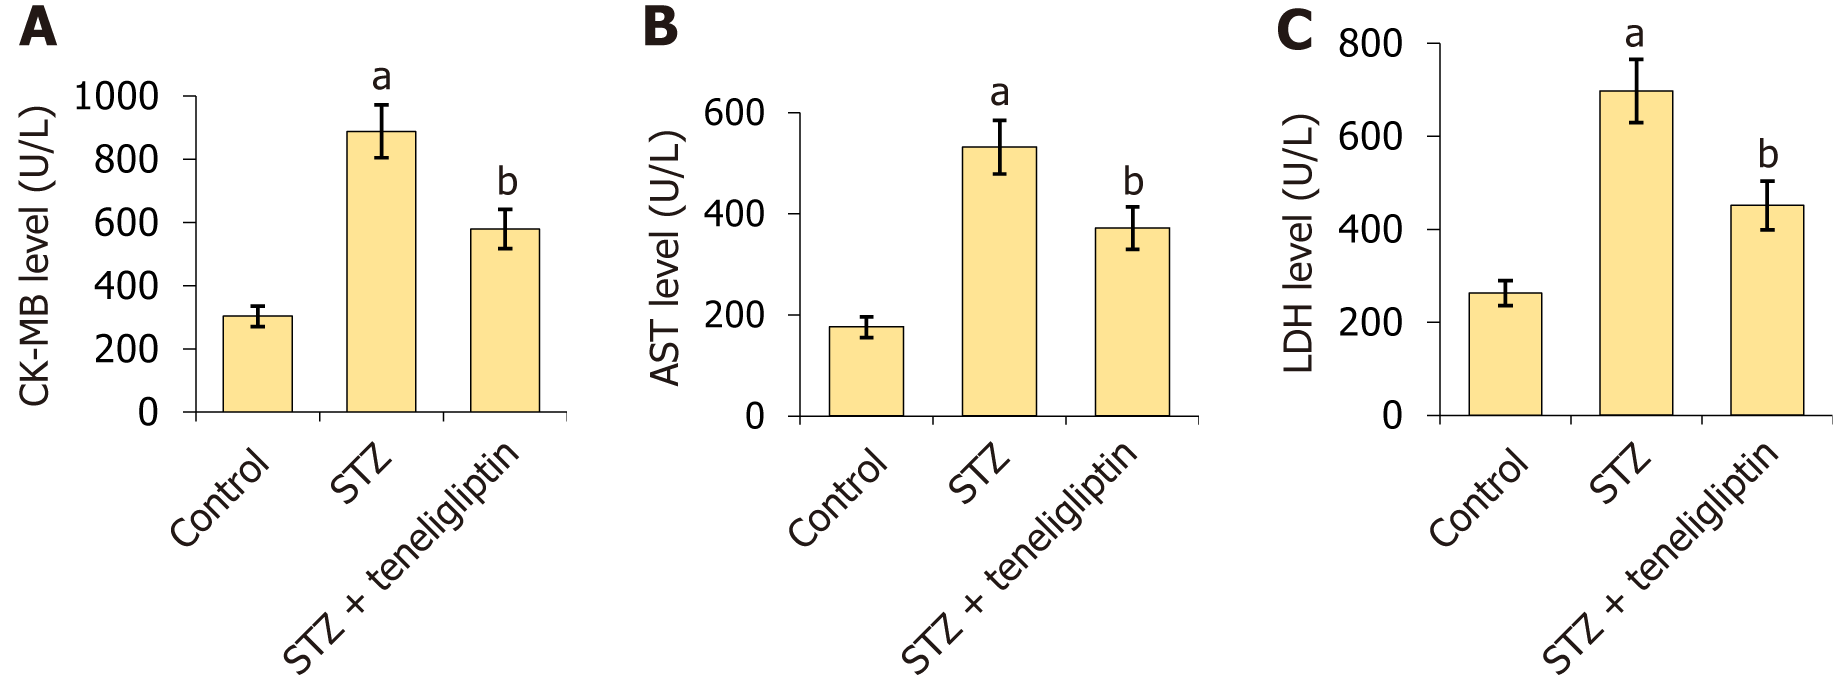
Figure 3 Teneligliptin reduced the expression of the myocardial injury indicators in streptozotocin-induced diabetic mice.
A: Creatine kinase-MB level; B: The aspartate transaminase level; C: The lactate dehydrogenase level. aP < 0.05 vs control group; bP < 0.05 vs streptozotocin group, n = 8. STZ: Streptozotocin; CK-MB: Creatine kinase-MB; AST: Aspartate transaminase; LDH: Lactate dehydrogenase.
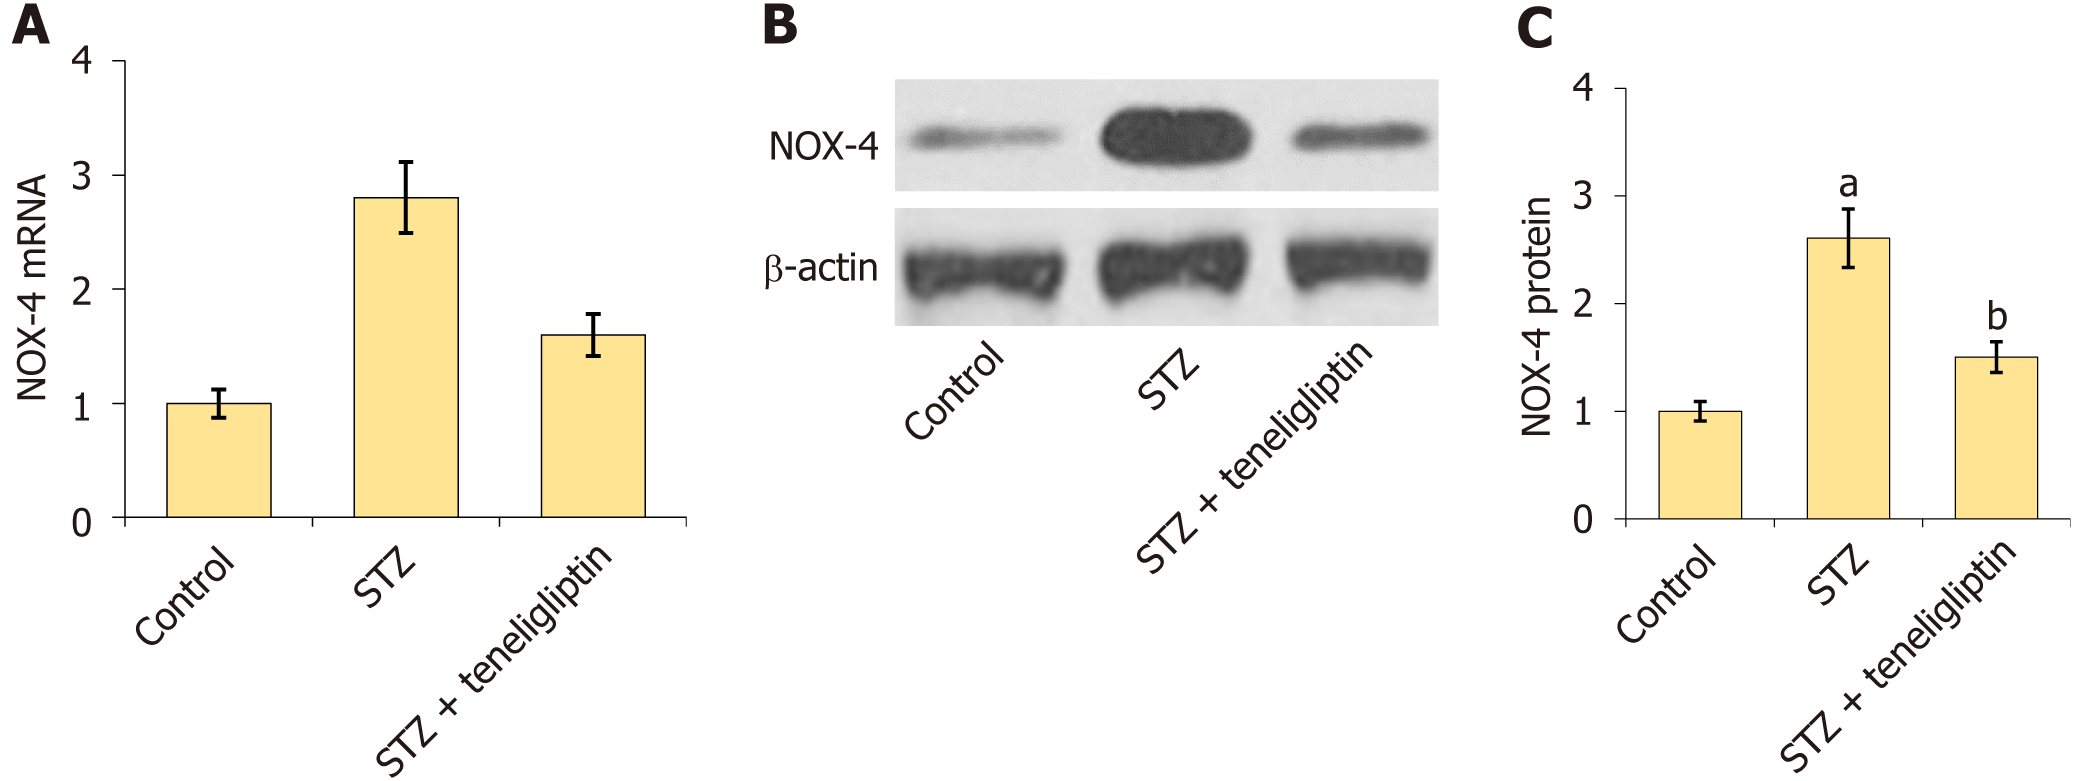
Figure 4 Teneligliptin reduced the expression of NOX4 in diabetic mice.
A: mRNA of NOX-4; B: Protein of NOX-4; C: Quantitative analysis of protein expression levels for panel B. aP < 0.05 vs control group; bP < 0.05 vs streptozotocin group, n = 8. STZ: Streptozotocin.
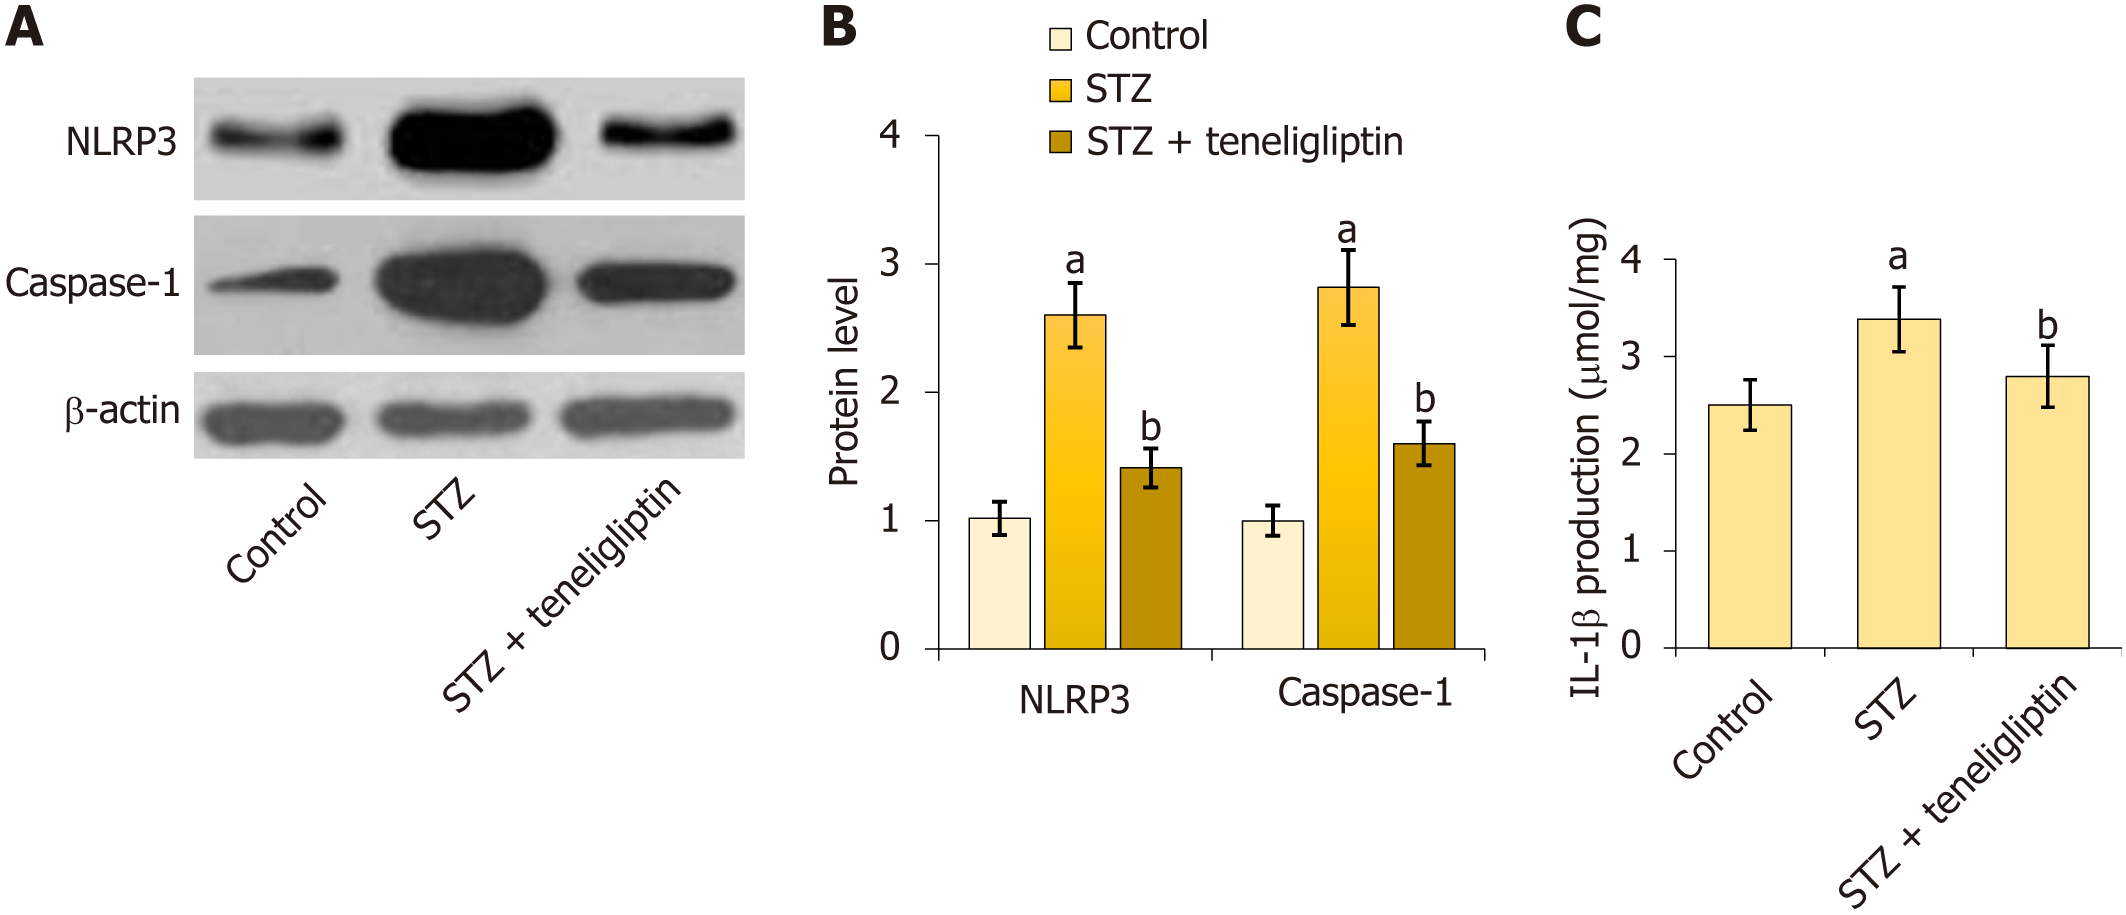
Figure 5 Teneligliptin reduced activation of the cardiac NLRP3 inflammasome in the control and diabetic mice.
A: NLRP3 and caspase-1 measured by Western blot assays; B: Quantitative analysis of protein expression levels for panel A; C: Production of interleukin-1β as measured by ELISA. aP < 0.05 vs control group; bP < 0.05 vs streptozotocin group, n = 8. STZ: Streptozotocin.
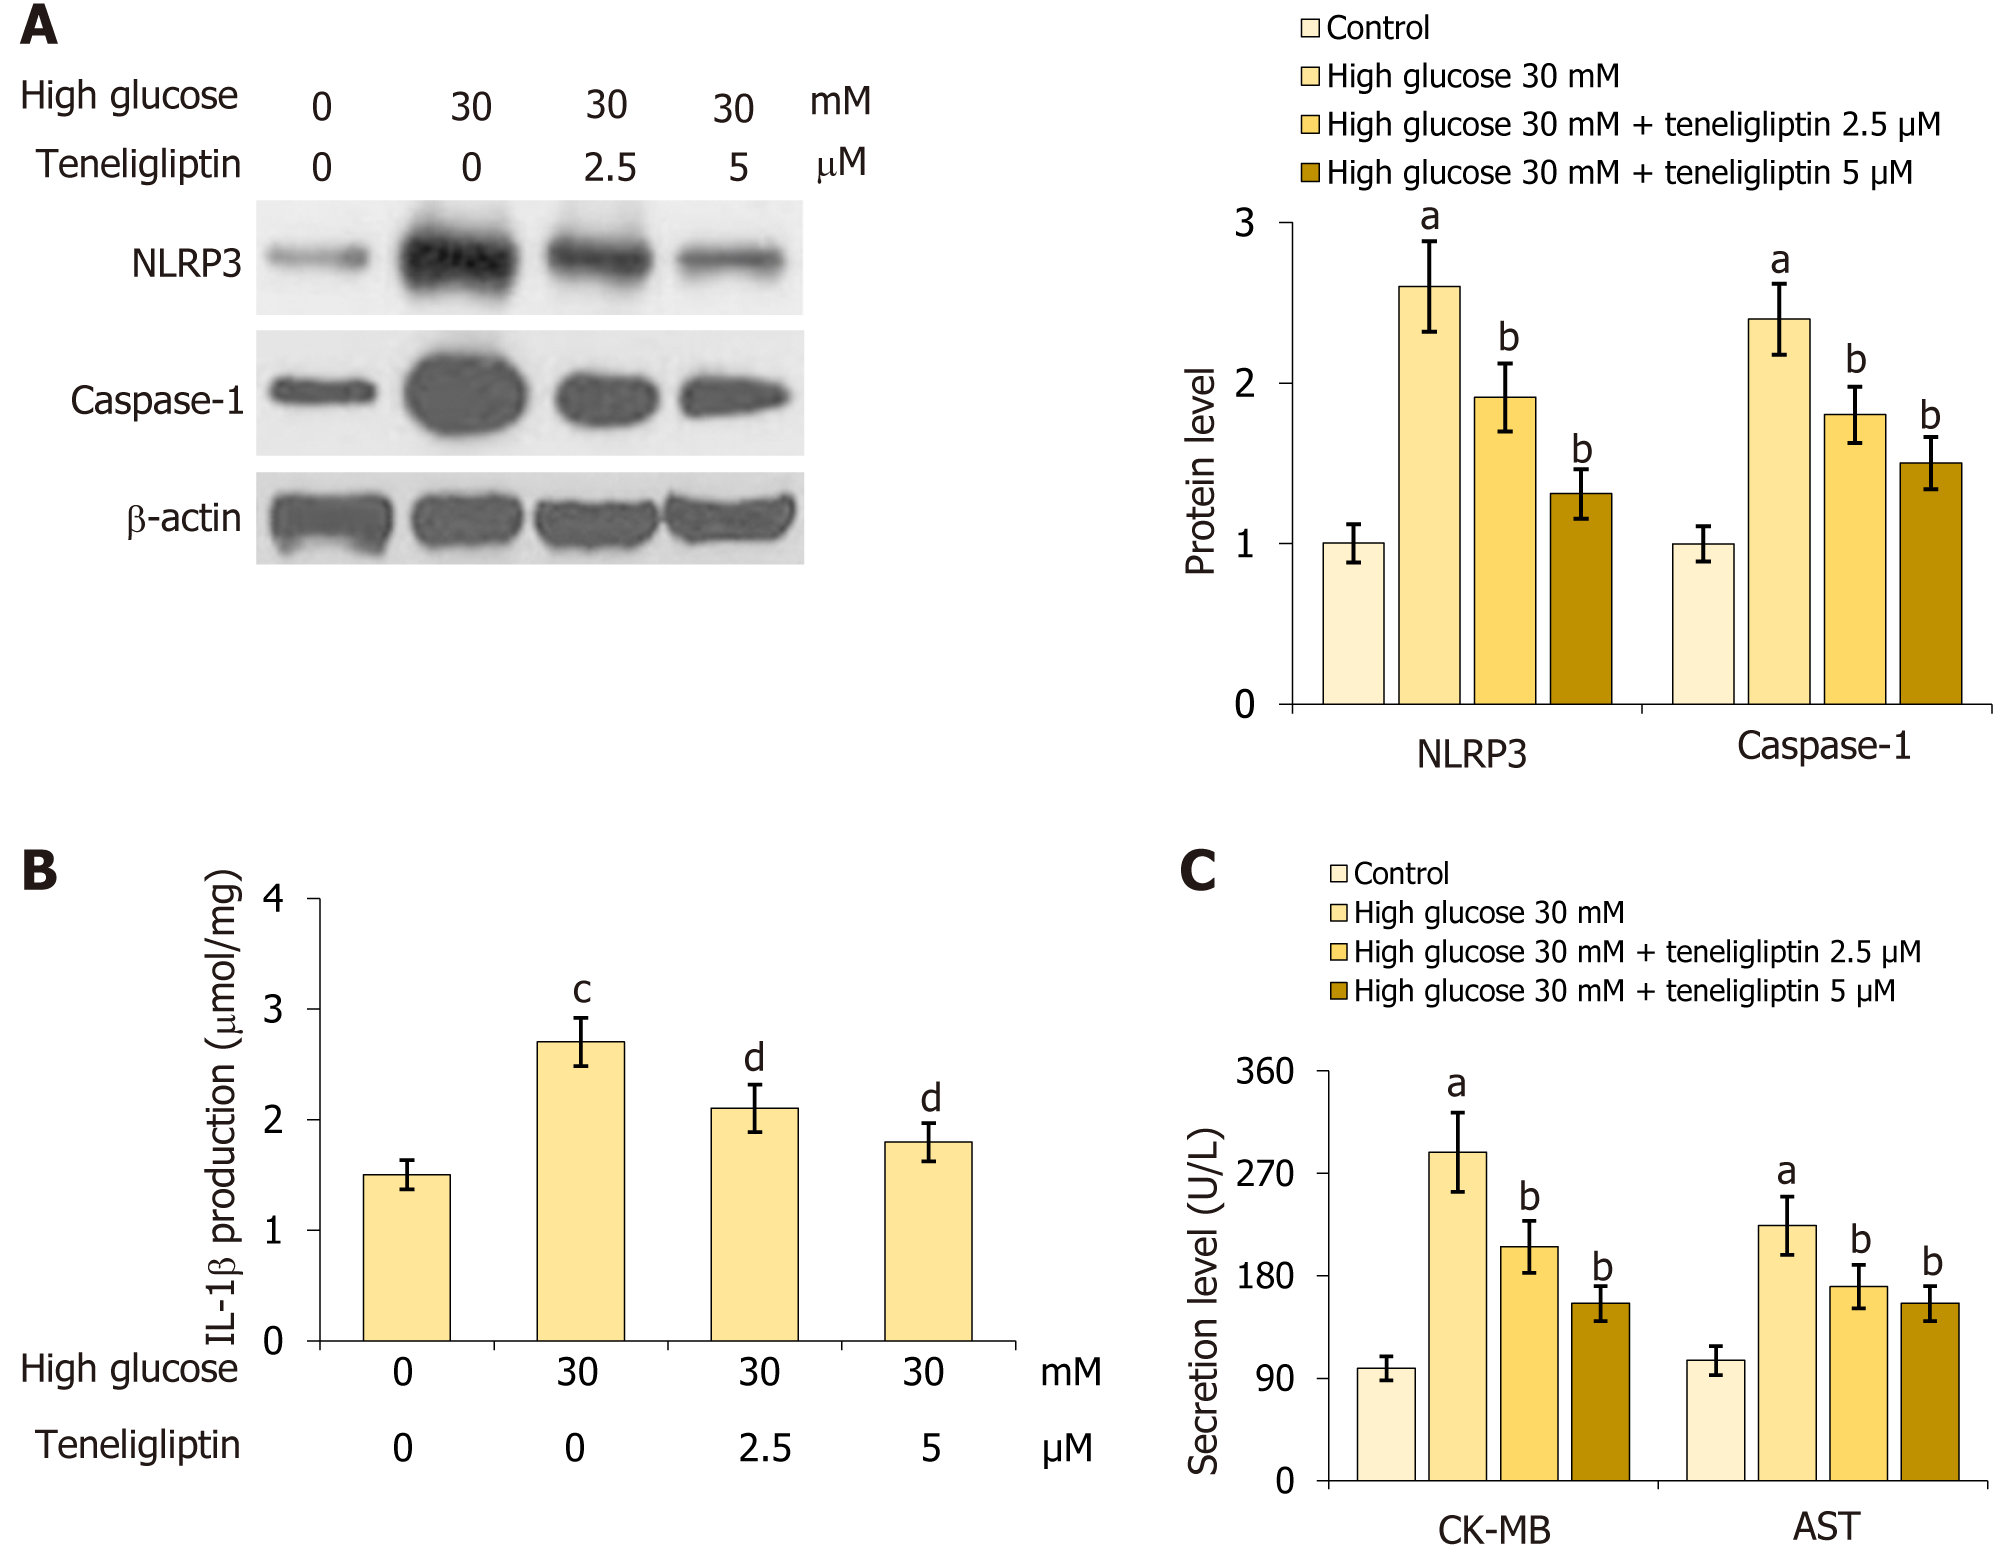
Figure 6 Teneligliptin prevented activation of the cardiac NLRP3 inflammasome and injury in cardiomyocytes.
Primary cardiomyocytes were treated with high glucose (30 mmol/L) with or without teneligliptin (2.5 or 5 µM) for 24 h. A: Expression of NLRP3 and caspase-1 were measured by western blot assays; B: Levels of IL-1β as measured by ELISA; C: Levels of creatine kinase-MB and aspartate transaminase level. aP < 0.05 vs control group; bP < 0.05 vs high glucose 30 mmol/L group; cP < 0.05 vs high glucose 0 mmol/L + teneligliptin 0 µM group; dP < 0.05 vs high glucose 30 mmol/L + teneligliptin 0 µM group, n = 5. CK-MB: Creatine kinase-MB; AST: Aspartate transaminase; IL: Interleukin.
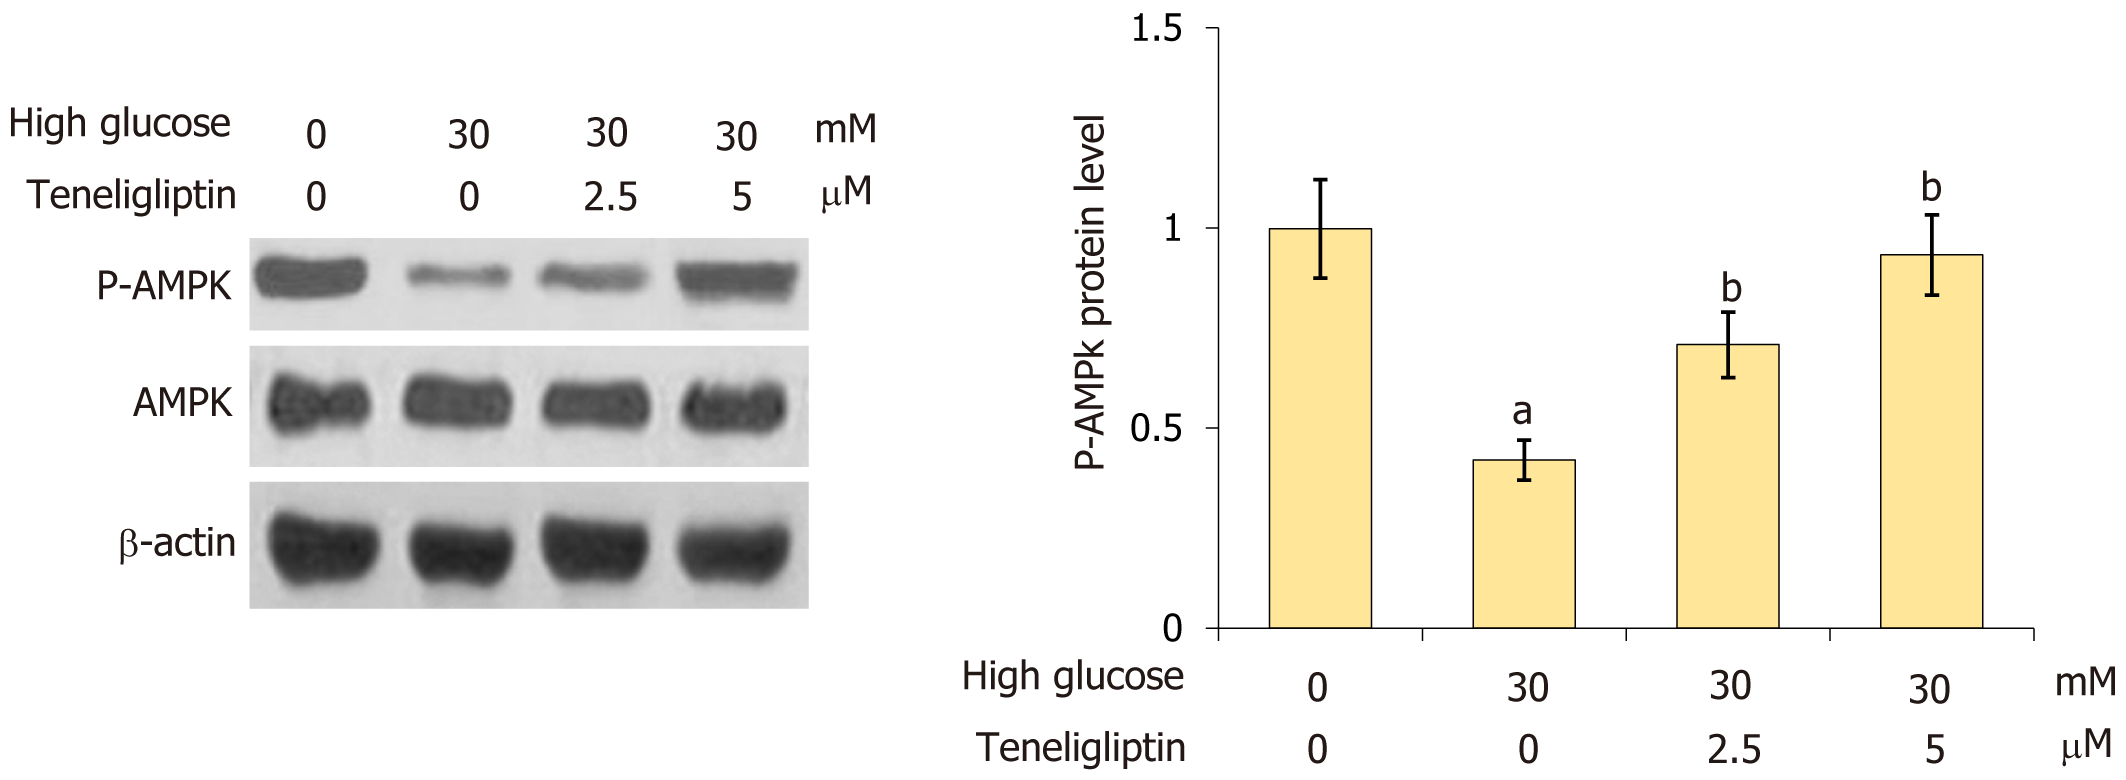
Figure 7 Teneligliptin increased the phosphorylation of AMPK against high glucose in cardiomyocytes.
Primary cardiomyocytes were treated with high glucose (30 mmol/L) with or without teneligliptin (2.5 or 5 µM) for 24 h. Levels of p-AMPK were measured by western blot assays. aP < 0.05 vs control group; bP < 0.05 vs high glucose 30 mmol/L + teneligliptin 0 µM group, n = 5.
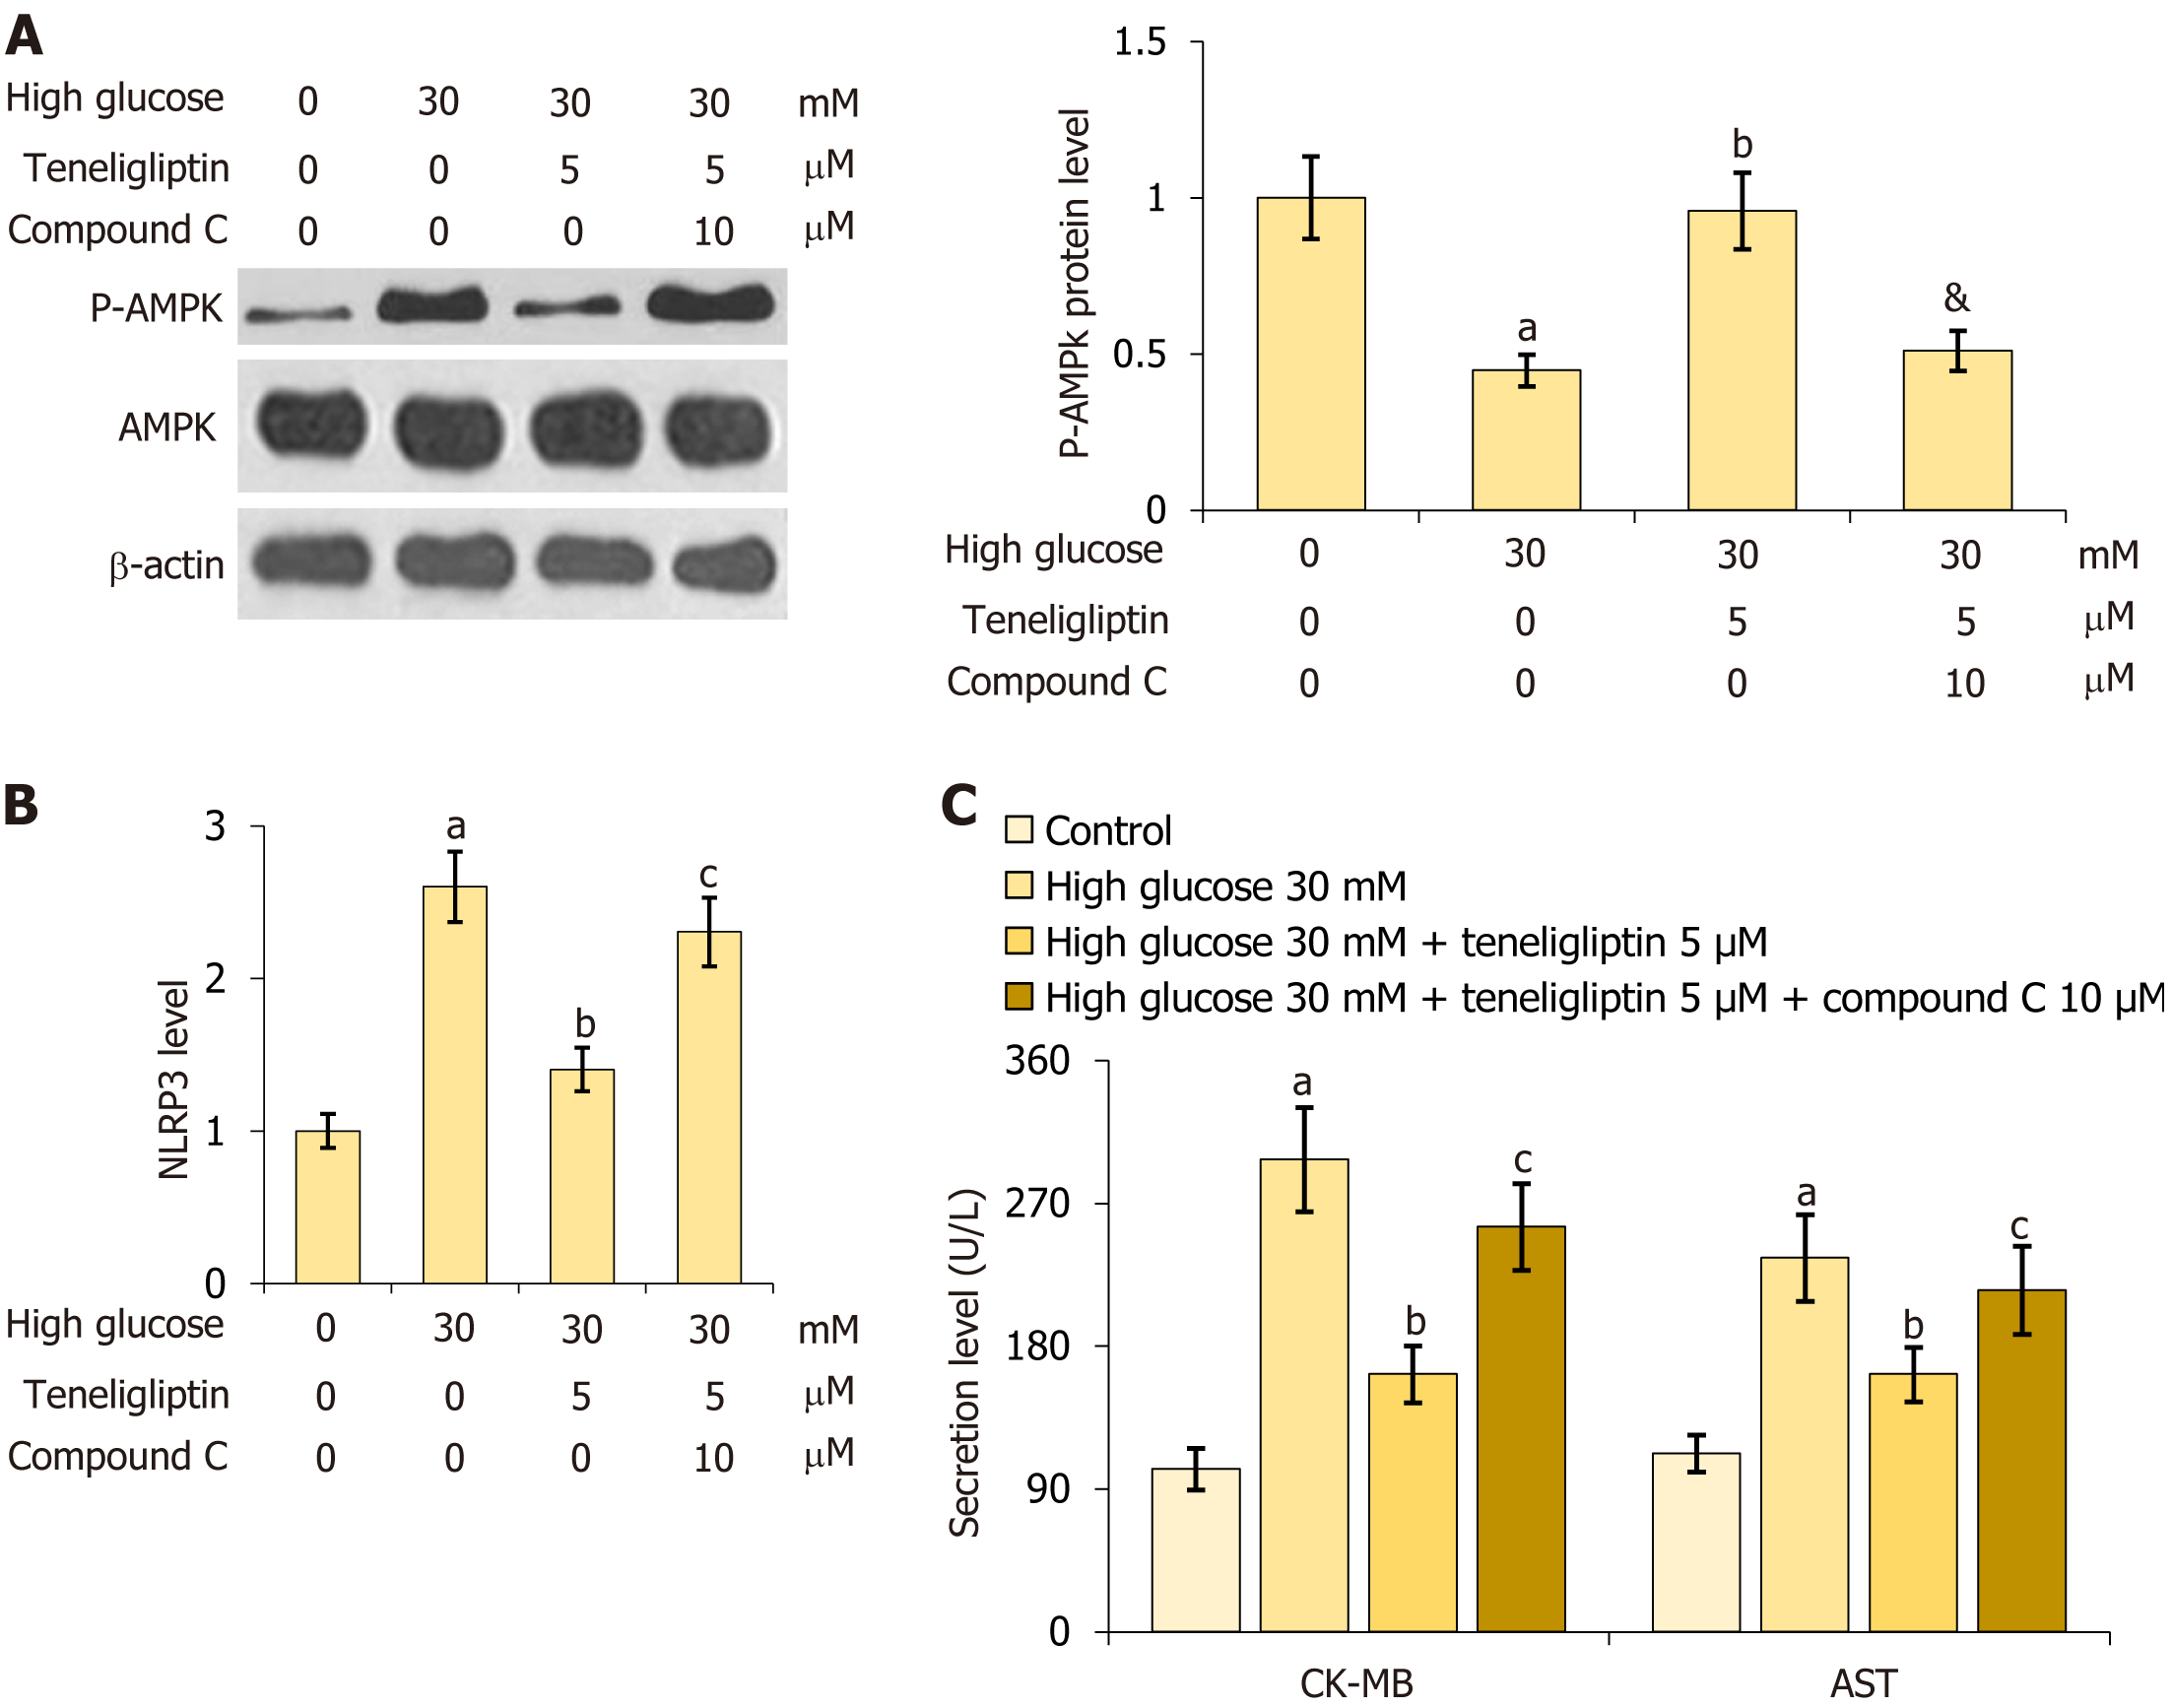
Figure 8 Inhibition of AMPK abolished the beneficial effects of teneligliptin against high glucose in cardiomyocytes.
Primary cardiomyocytes were treated with high glucose (30 mmol/L) with or without teneligliptin (5 µM) and compound C (10 μM). A: Levels of p-AMPK; B: The levels of NLRP3; C: Levels of creatine kinase-MB and aspartate transaminase level. aP < 0.05 vs control group; bP < 0.05 vs high glucose 30 mmol/L group; cP < 0.05 vs high glucose 30 mmol/L + teneligliptin 5 µM group, n = 5.
- Citation: Zhang GL, Liu Y, Liu YF, Huang XT, Tao Y, Chen ZH, Lai HL. Teneligliptin mitigates diabetic cardiomyopathy by inhibiting activation of the NLRP3 inflammasome. World J Diabetes 2024; 15(4): 724-734
- URL: https://www.wjgnet.com/1948-9358/full/v15/i4/724.htm
- DOI: https://dx.doi.org/10.4239/wjd.v15.i4.724


