Copyright
©The Author(s) 2024.
World J Diabetes. Apr 15, 2024; 15(4): 712-723
Published online Apr 15, 2024. doi: 10.4239/wjd.v15.i4.712
Published online Apr 15, 2024. doi: 10.4239/wjd.v15.i4.712
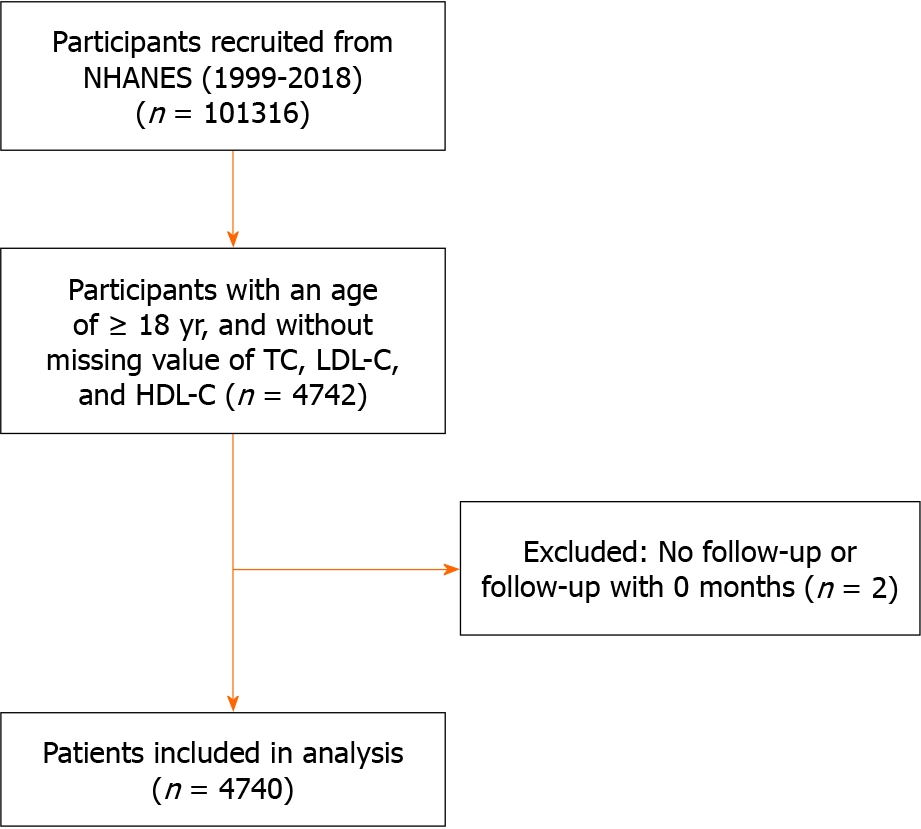
Figure 1 Trial flow chart.
TC: Total cholesterol; HDL-C: High-density lipoprotein cholesterol; LDL-C: Low-density lipoprotein cholesterol; NHANES: National Health and Nutrition Examination Survey.
Figure 2 Association of remnant cholesterol with all-cause mortality.
A: Multiple-adjusted restricted cubic splines showing hazard ratios (HR) for the risk of incident all-cause mortality associated with remnant cholesterol. Red solid lines represent HRs, and shaded areas represent 95% confidence intervals. Analysis was adjusted for age, gender, ethnicity, body mass index, poverty-income ratio, education, smoking status, alcohol consumption, survey period, hypercholesterolemia, hypertension, heart failure, coronary heart disease, and cancer; B: Multiple-adjusted HRs for remnant cholesterol by quarters and per standard deviation, in association with the risk of all-cause mortality.
Figure 3 Association of remnant cholesterol with cardiovascular mortality.
A: Multiple-adjusted restricted cubic splines showing hazard ratios (HR) for the risk of incident cardiovascular mortality associated with remnant cholesterol. Red solid lines represent HRs, and shaded areas represent 95% confidence intervals. Analysis was adjusted for age, gender, ethnicity, body mass index, poverty-income ratio, education, smoking status, alcohol consumption, survey period, hypercholesterolemia, hypertension, heart failure, coronary heart disease, and cancer; B: Multiple-adjusted HRs for remnant cholesterol by quarters and per standard deviation, in association with the risk of cardiovascular mortality.
- Citation: Pan D, Xu L, Zhang LX, Shi DZ, Guo M. Associations between remnant cholesterol levels and mortality in patients with diabetes. World J Diabetes 2024; 15(4): 712-723
- URL: https://www.wjgnet.com/1948-9358/full/v15/i4/712.htm
- DOI: https://dx.doi.org/10.4239/wjd.v15.i4.712


