Copyright
©The Author(s) 2024.
World J Diabetes. Mar 15, 2024; 15(3): 429-439
Published online Mar 15, 2024. doi: 10.4239/wjd.v15.i3.429
Published online Mar 15, 2024. doi: 10.4239/wjd.v15.i3.429
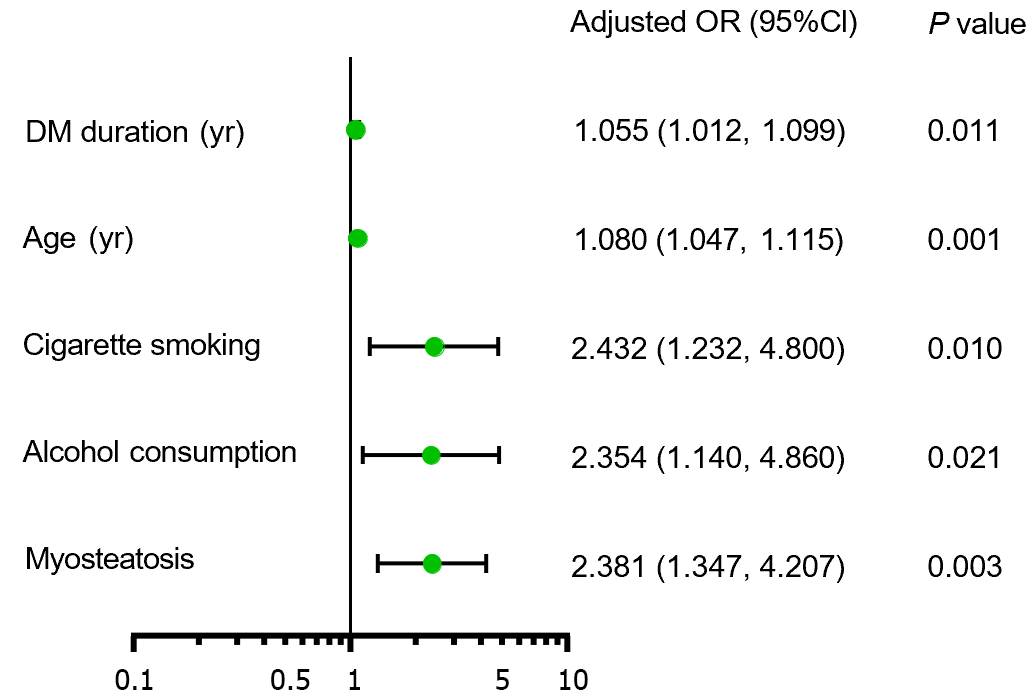
Figure 1 Forest plot of independent factors identified from logistic linear regression for severe coronary artery calcification.
DM: Diabetes mellitus.
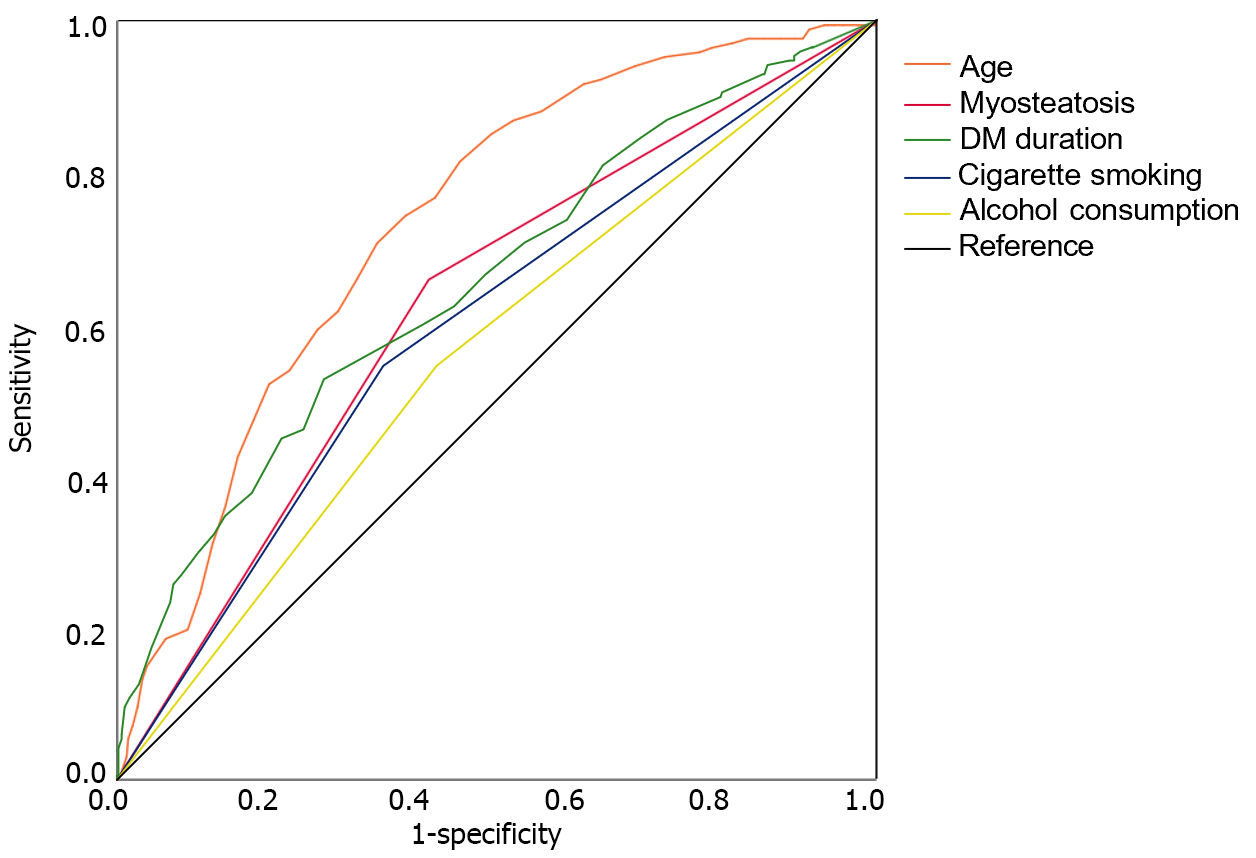
Figure 2 Receiver operating characteristic curve analysis of risk factors for severe coronary artery calcification alone or in combination.
DM: Diabetes mellitus.
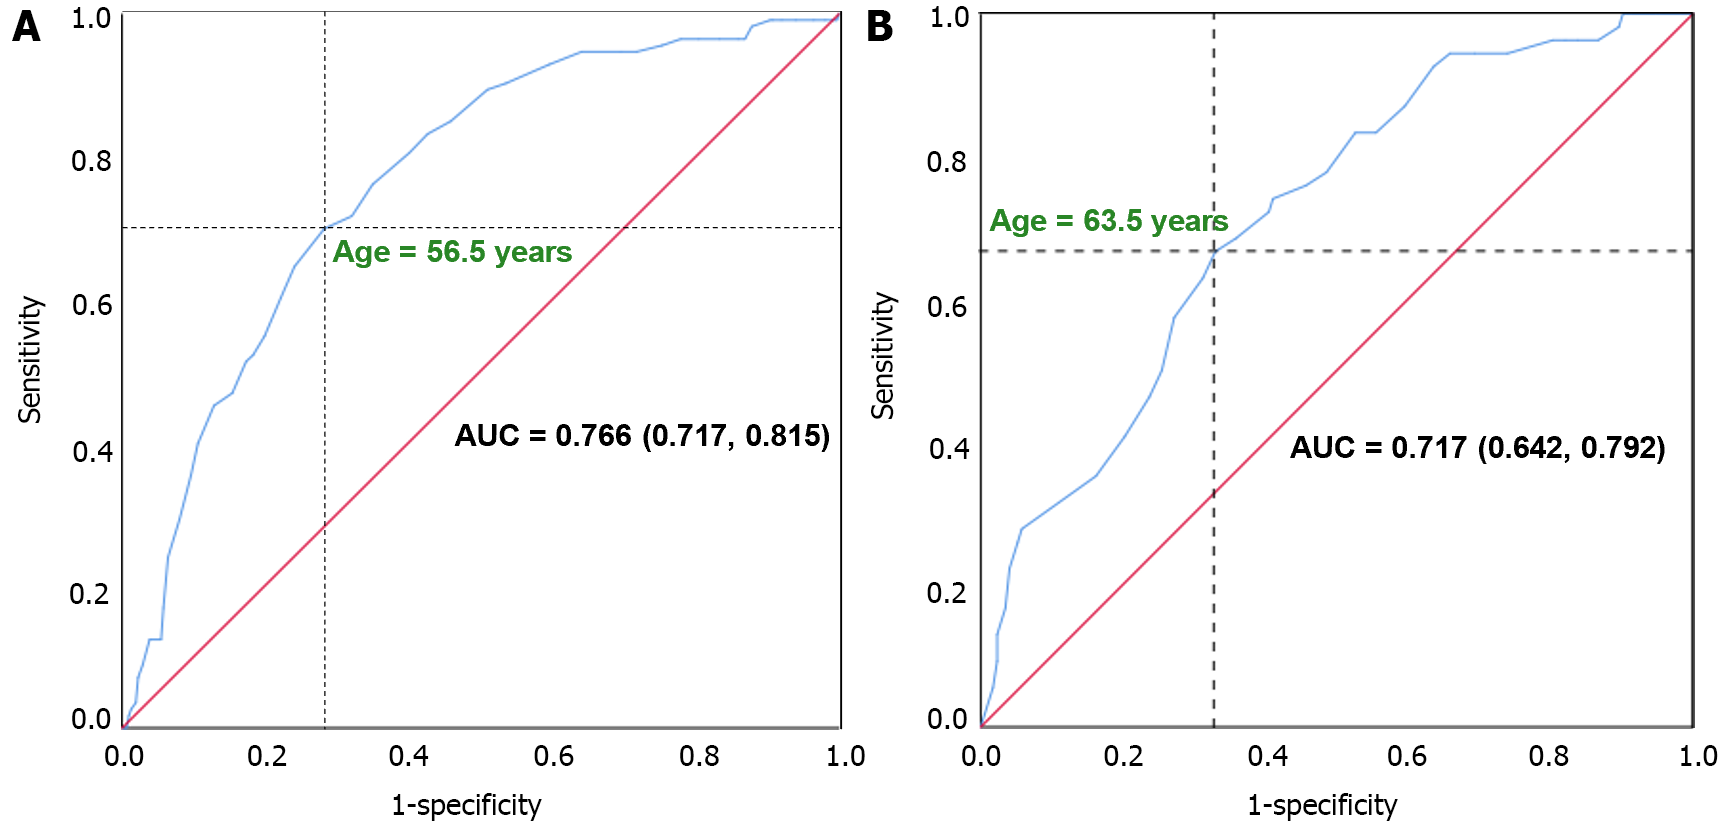
Figure 3 Cut-off points of age for severe coronary artery calcification.
A. Subgroup of males; B. Subgroup of females. AUC: Area under the curve.
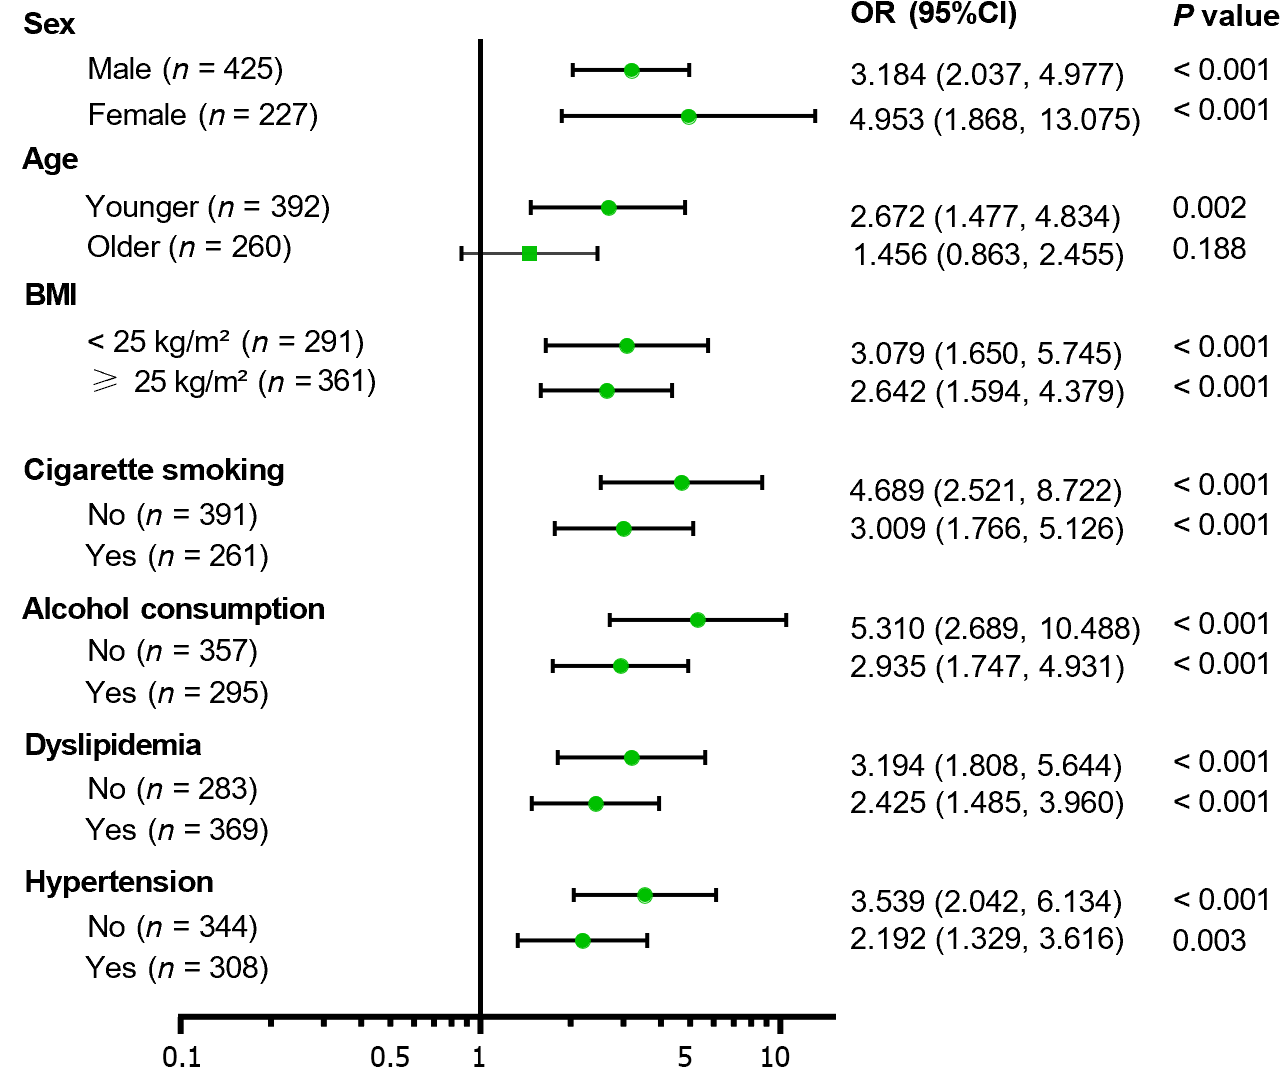
Figure 4 Subgroup analyses of myosteatosis in predicting severe coronary artery calcification.
BMI: Body mass index.
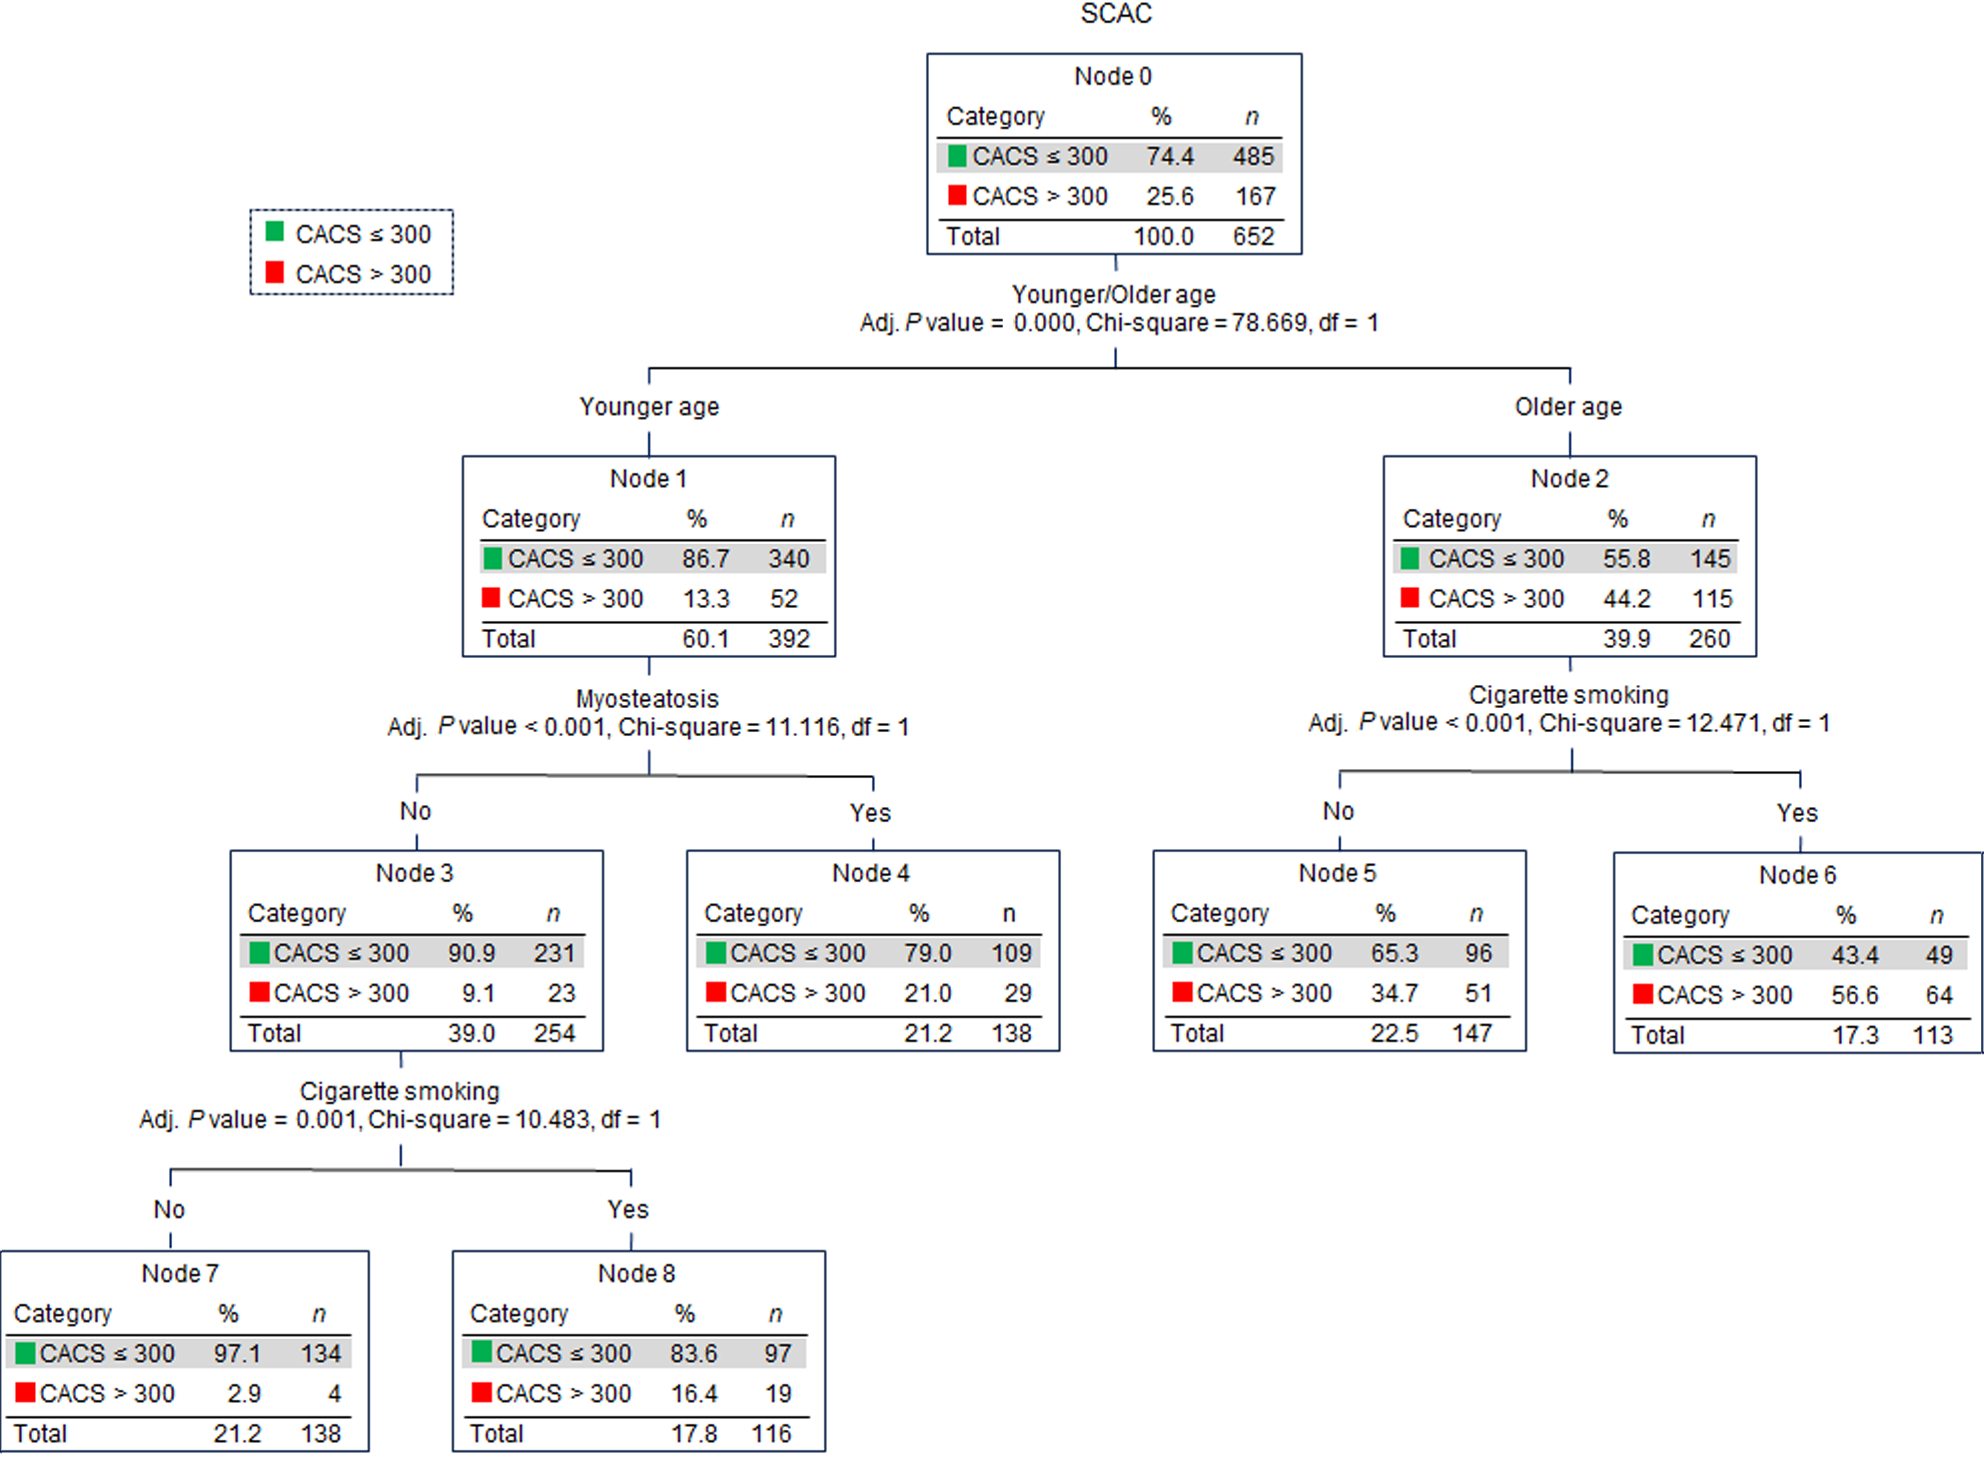
Figure 5 Chi-squared automatic interaction detection decision tree analysis.
SCAC: severe coronary artery calcification; CACS: Severe coronary artery calcification score.
- Citation: Liu FP, Guo MJ, Yang Q, Li YY, Wang YG, Zhang M. Myosteatosis is associated with coronary artery calcification in patients with type 2 diabetes. World J Diabetes 2024; 15(3): 429-439
- URL: https://www.wjgnet.com/1948-9358/full/v15/i3/429.htm
- DOI: https://dx.doi.org/10.4239/wjd.v15.i3.429


