Copyright
©The Author(s) 2024.
World J Diabetes. Mar 15, 2024; 15(3): 418-428
Published online Mar 15, 2024. doi: 10.4239/wjd.v15.i3.418
Published online Mar 15, 2024. doi: 10.4239/wjd.v15.i3.418
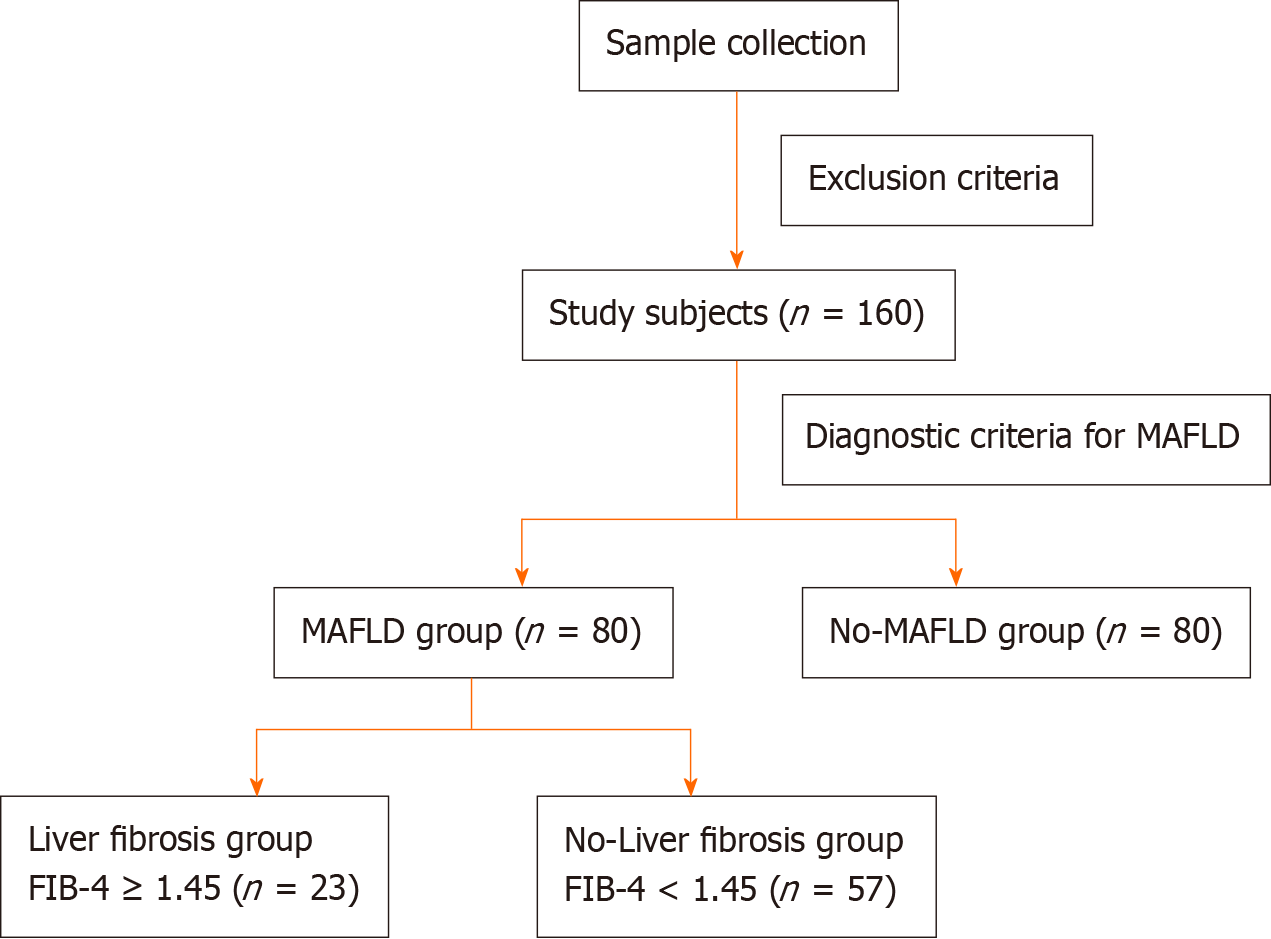
Figure 1 Flow chart of subject selection.
MAFLD: Metabolic dysfunction-associated fatty liver disease; FIB-4 index: Fibrosis-4 index.
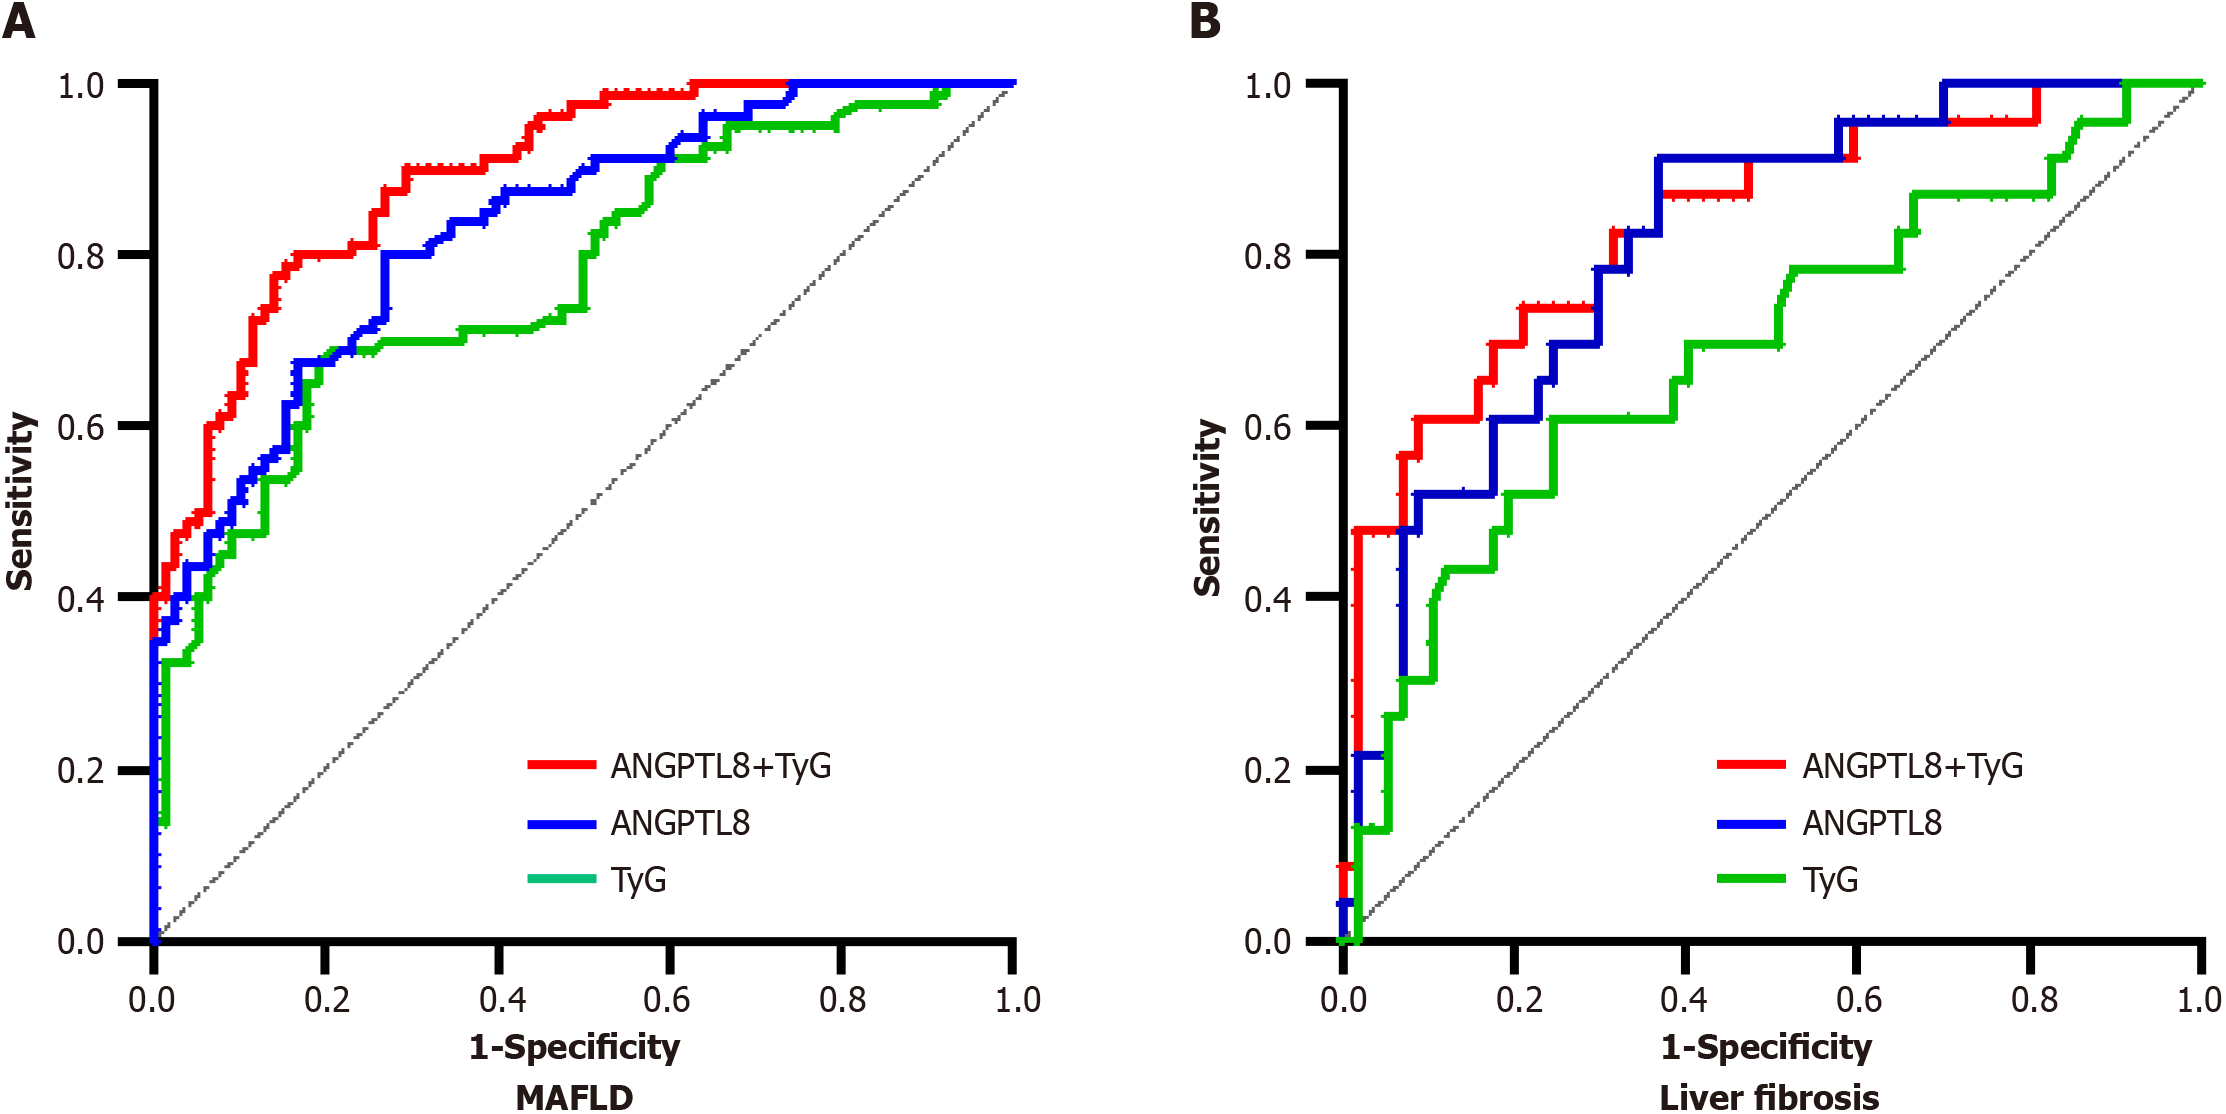
Figure 2 Predictive value of angiopoietin-like protein 8 and triglyceride-glucose index.
A: Predictive value in metabolic dysfunction-associated fatty liver disease; B: Predictive value in liver fibrosis. MAFLD: Metabolic dysfunction-associated fatty liver disease; ANGPTL8: Angiopoietin-like protein 8; TyG index: Triglyceride-glucose index.
Figure 3 Comparison of 3 indexs between the liver fibrosis and non-fibrosis groups.
A: Angiopoietin-like protein 8; B: Triglyceride-glucose index levels; C: C-reactive protein. MAFLD: Metabolic dysfunction-associated fatty liver disease; ANGPTL8: Angiopoietin-like protein 8; CRP: C-reactive protein.
- Citation: Gan LL, Xia C, Zhu X, Gao Y, Wu WC, Li Q, Li L, Dai Z, Yan YM. Predictive value of angiopoietin-like protein 8 in metabolic dysfunction-associated fatty liver disease and its progression: A case-control study. World J Diabetes 2024; 15(3): 418-428
- URL: https://www.wjgnet.com/1948-9358/full/v15/i3/418.htm
- DOI: https://dx.doi.org/10.4239/wjd.v15.i3.418


