Copyright
©The Author(s) 2024.
World J Diabetes. Feb 15, 2024; 15(2): 170-185
Published online Feb 15, 2024. doi: 10.4239/wjd.v15.i2.170
Published online Feb 15, 2024. doi: 10.4239/wjd.v15.i2.170
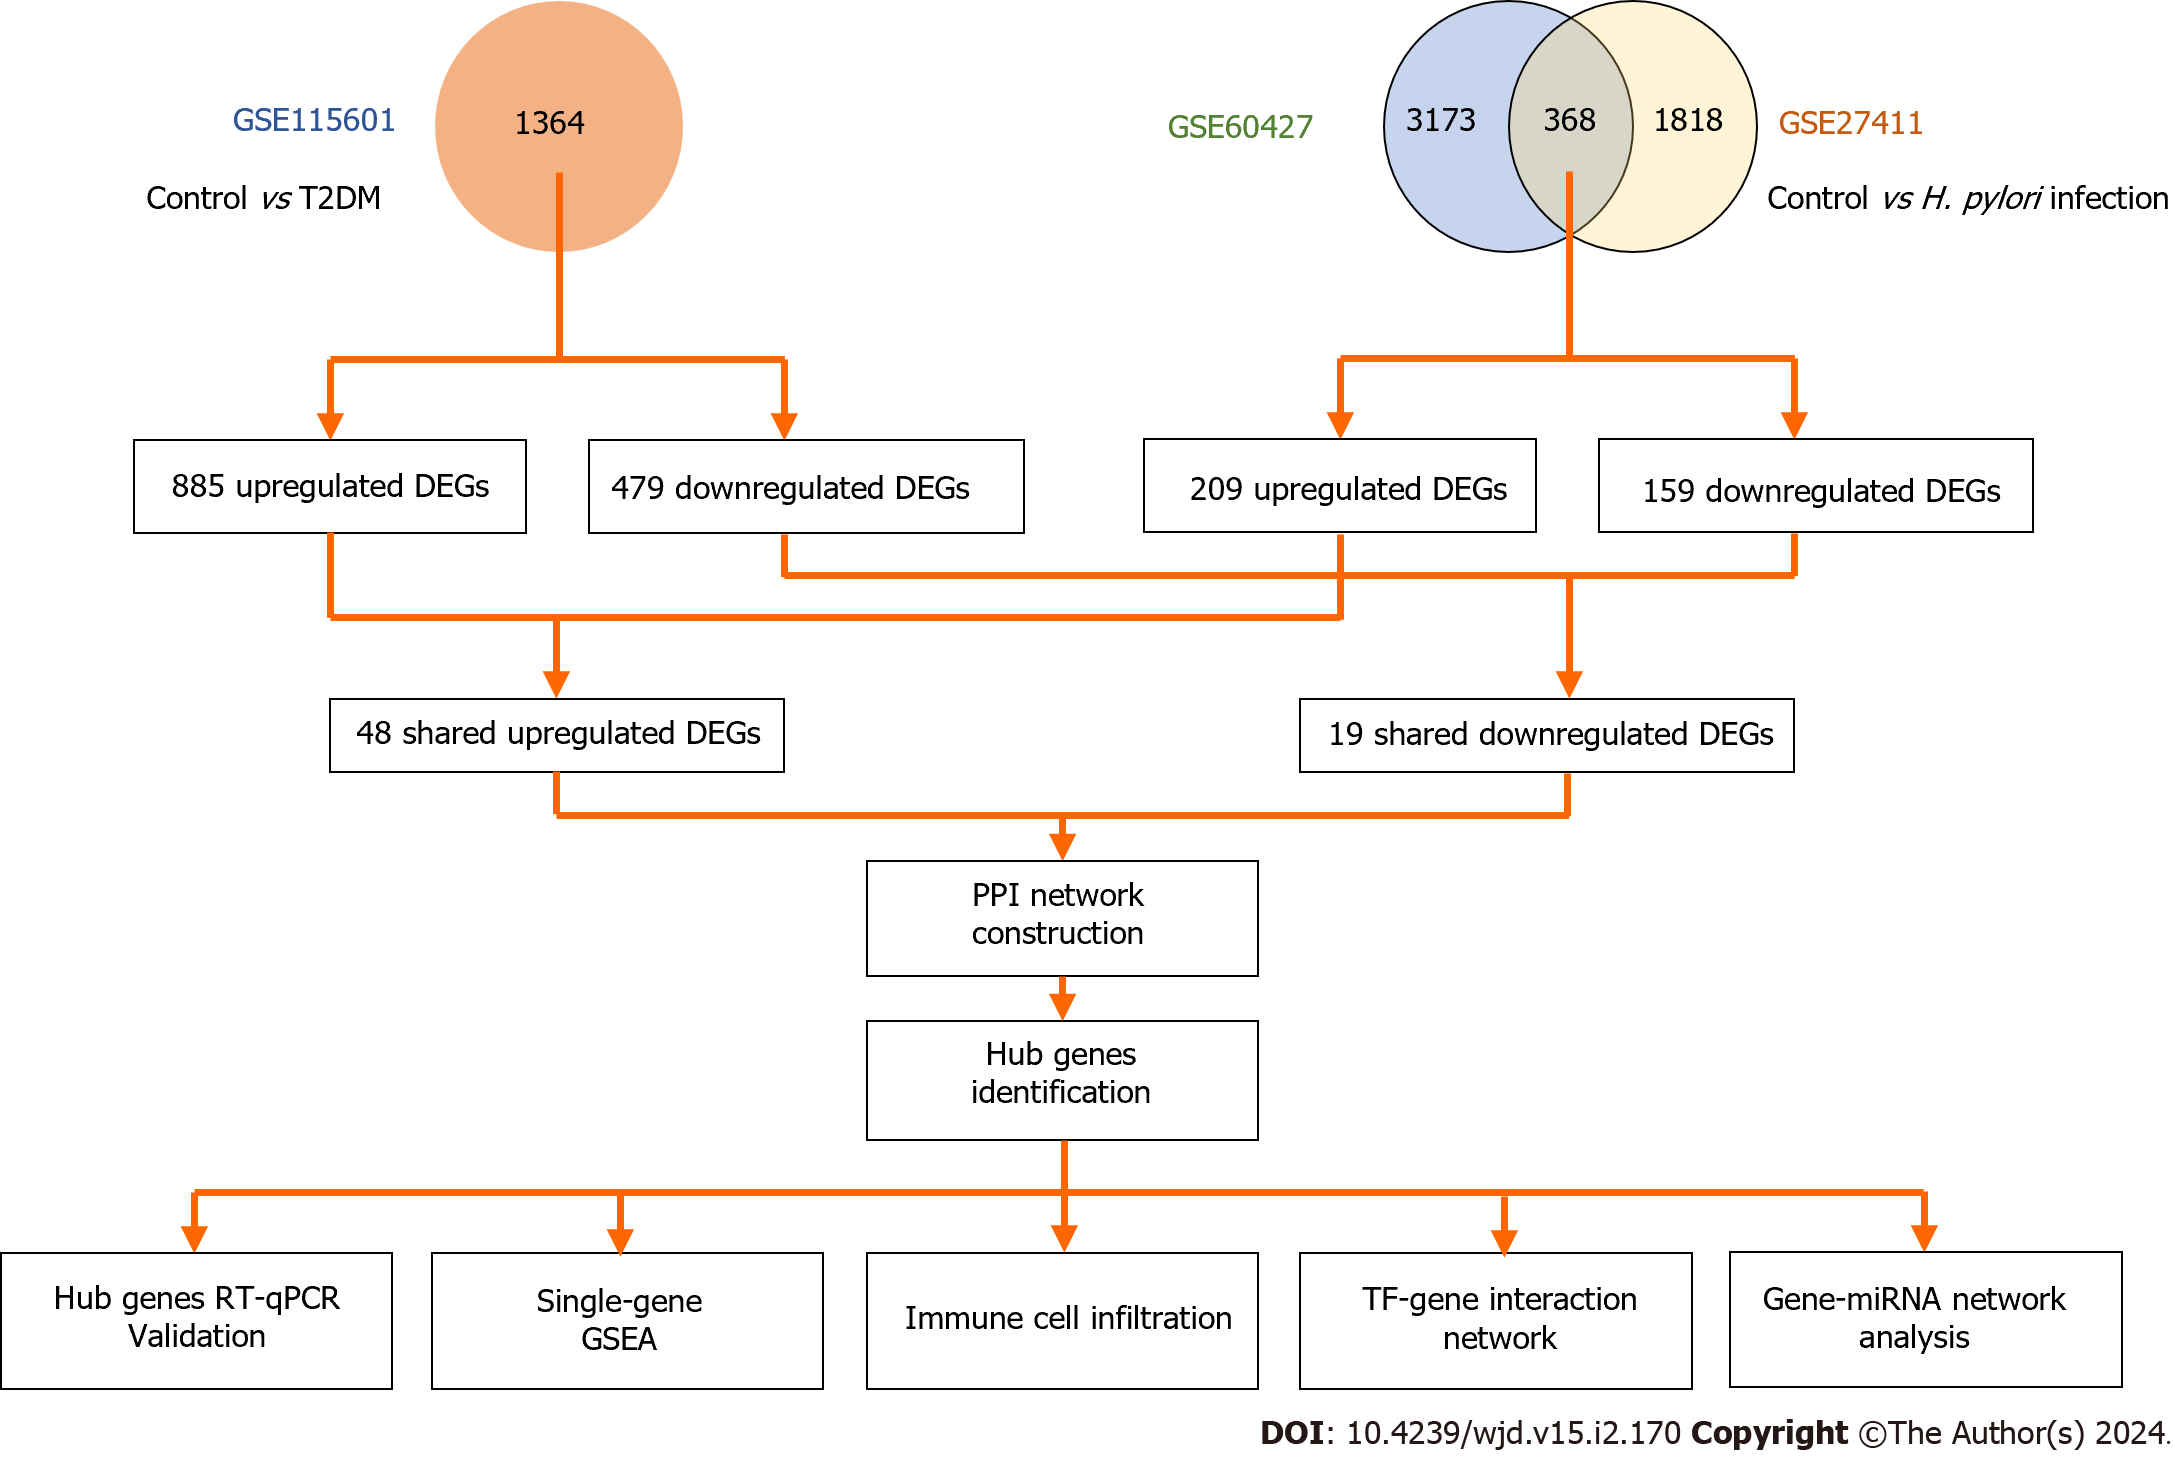
Figure 1 Overall workflow of the study.
T2DM: Type 2 diabetes mellitus; H. pylori: Helicobacter pylori; DEGs: Differentially expressed genes; TF: Transcriptional factor; PPI: Protein-protein interaction; GSEA: Gene set enrichment analysis.
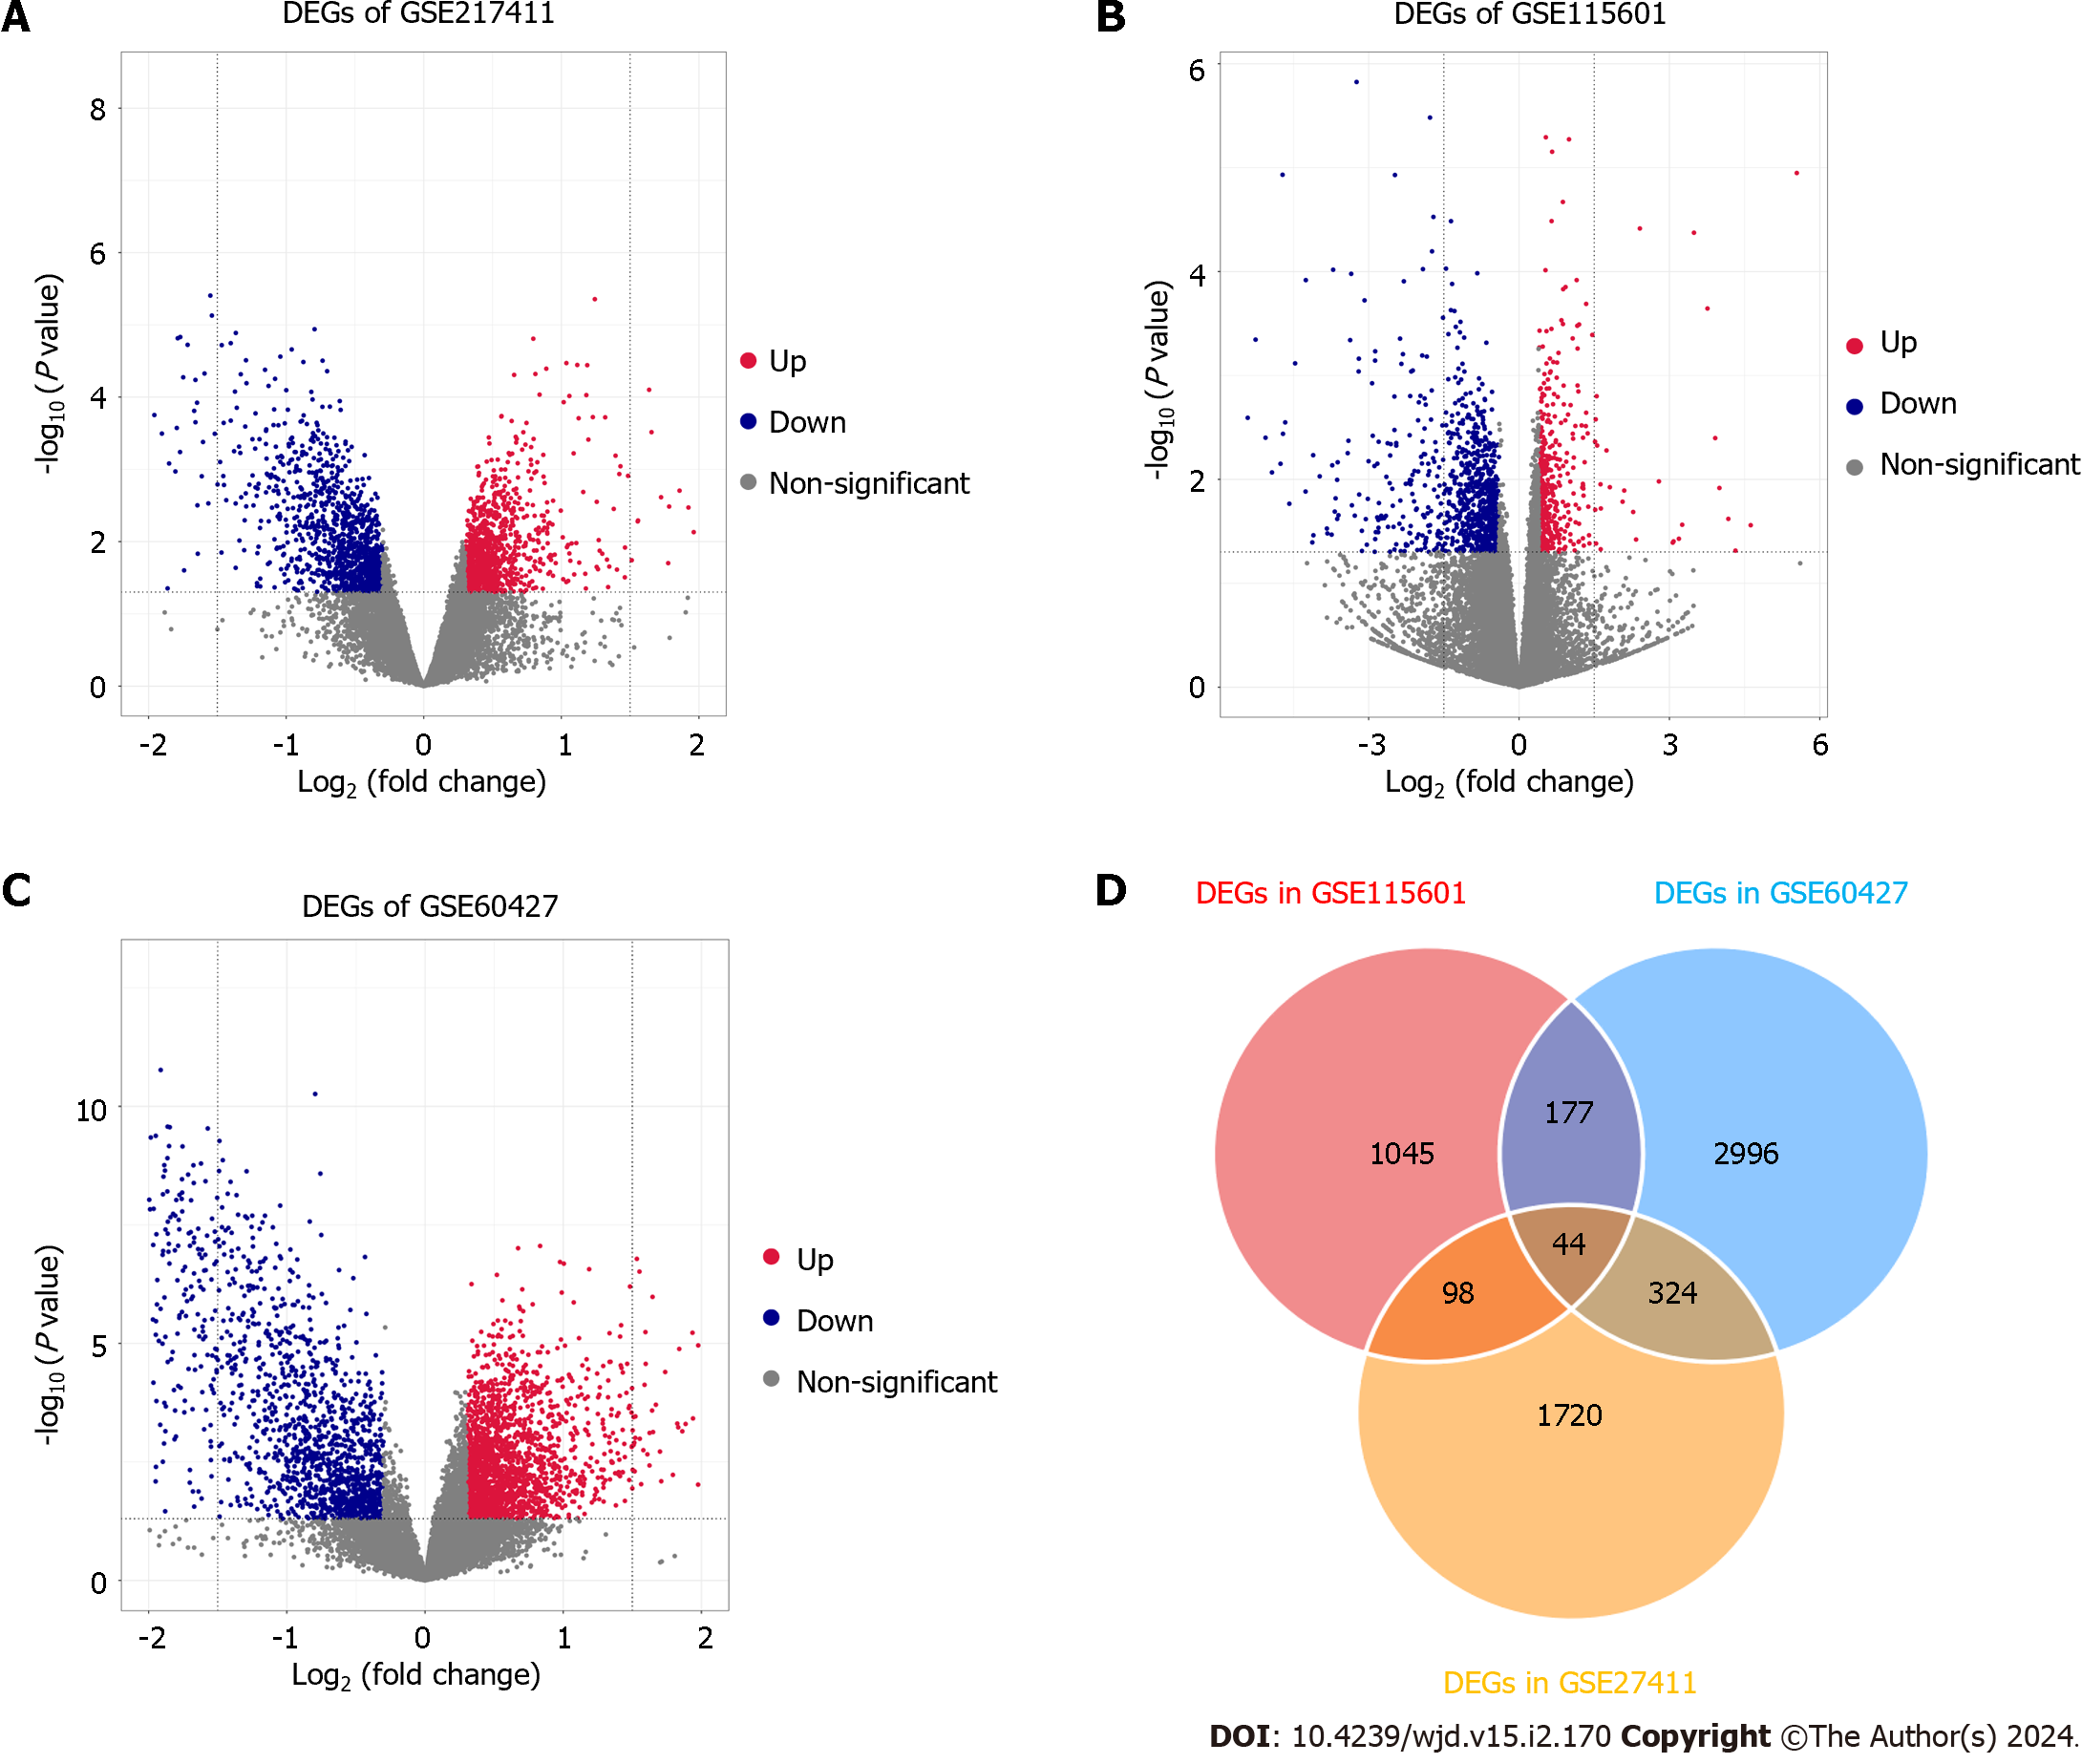
Figure 2 The expression levels of differentially expressed genes in three datasets.
A-C: The volcano plot distribution of differentially expressed genes (DEGs) of GSE60427 (A), GSE27411 (B) and GSE115601 (C). The blue dots indicate the screened downregulated DEGs, red dots indicate the screened upregulated DEGs, and the grey dots indicate genes with no significant differences; D: The Venn diagram of DEGs based on the three datasets. DEGs: Differentially expressed genes.
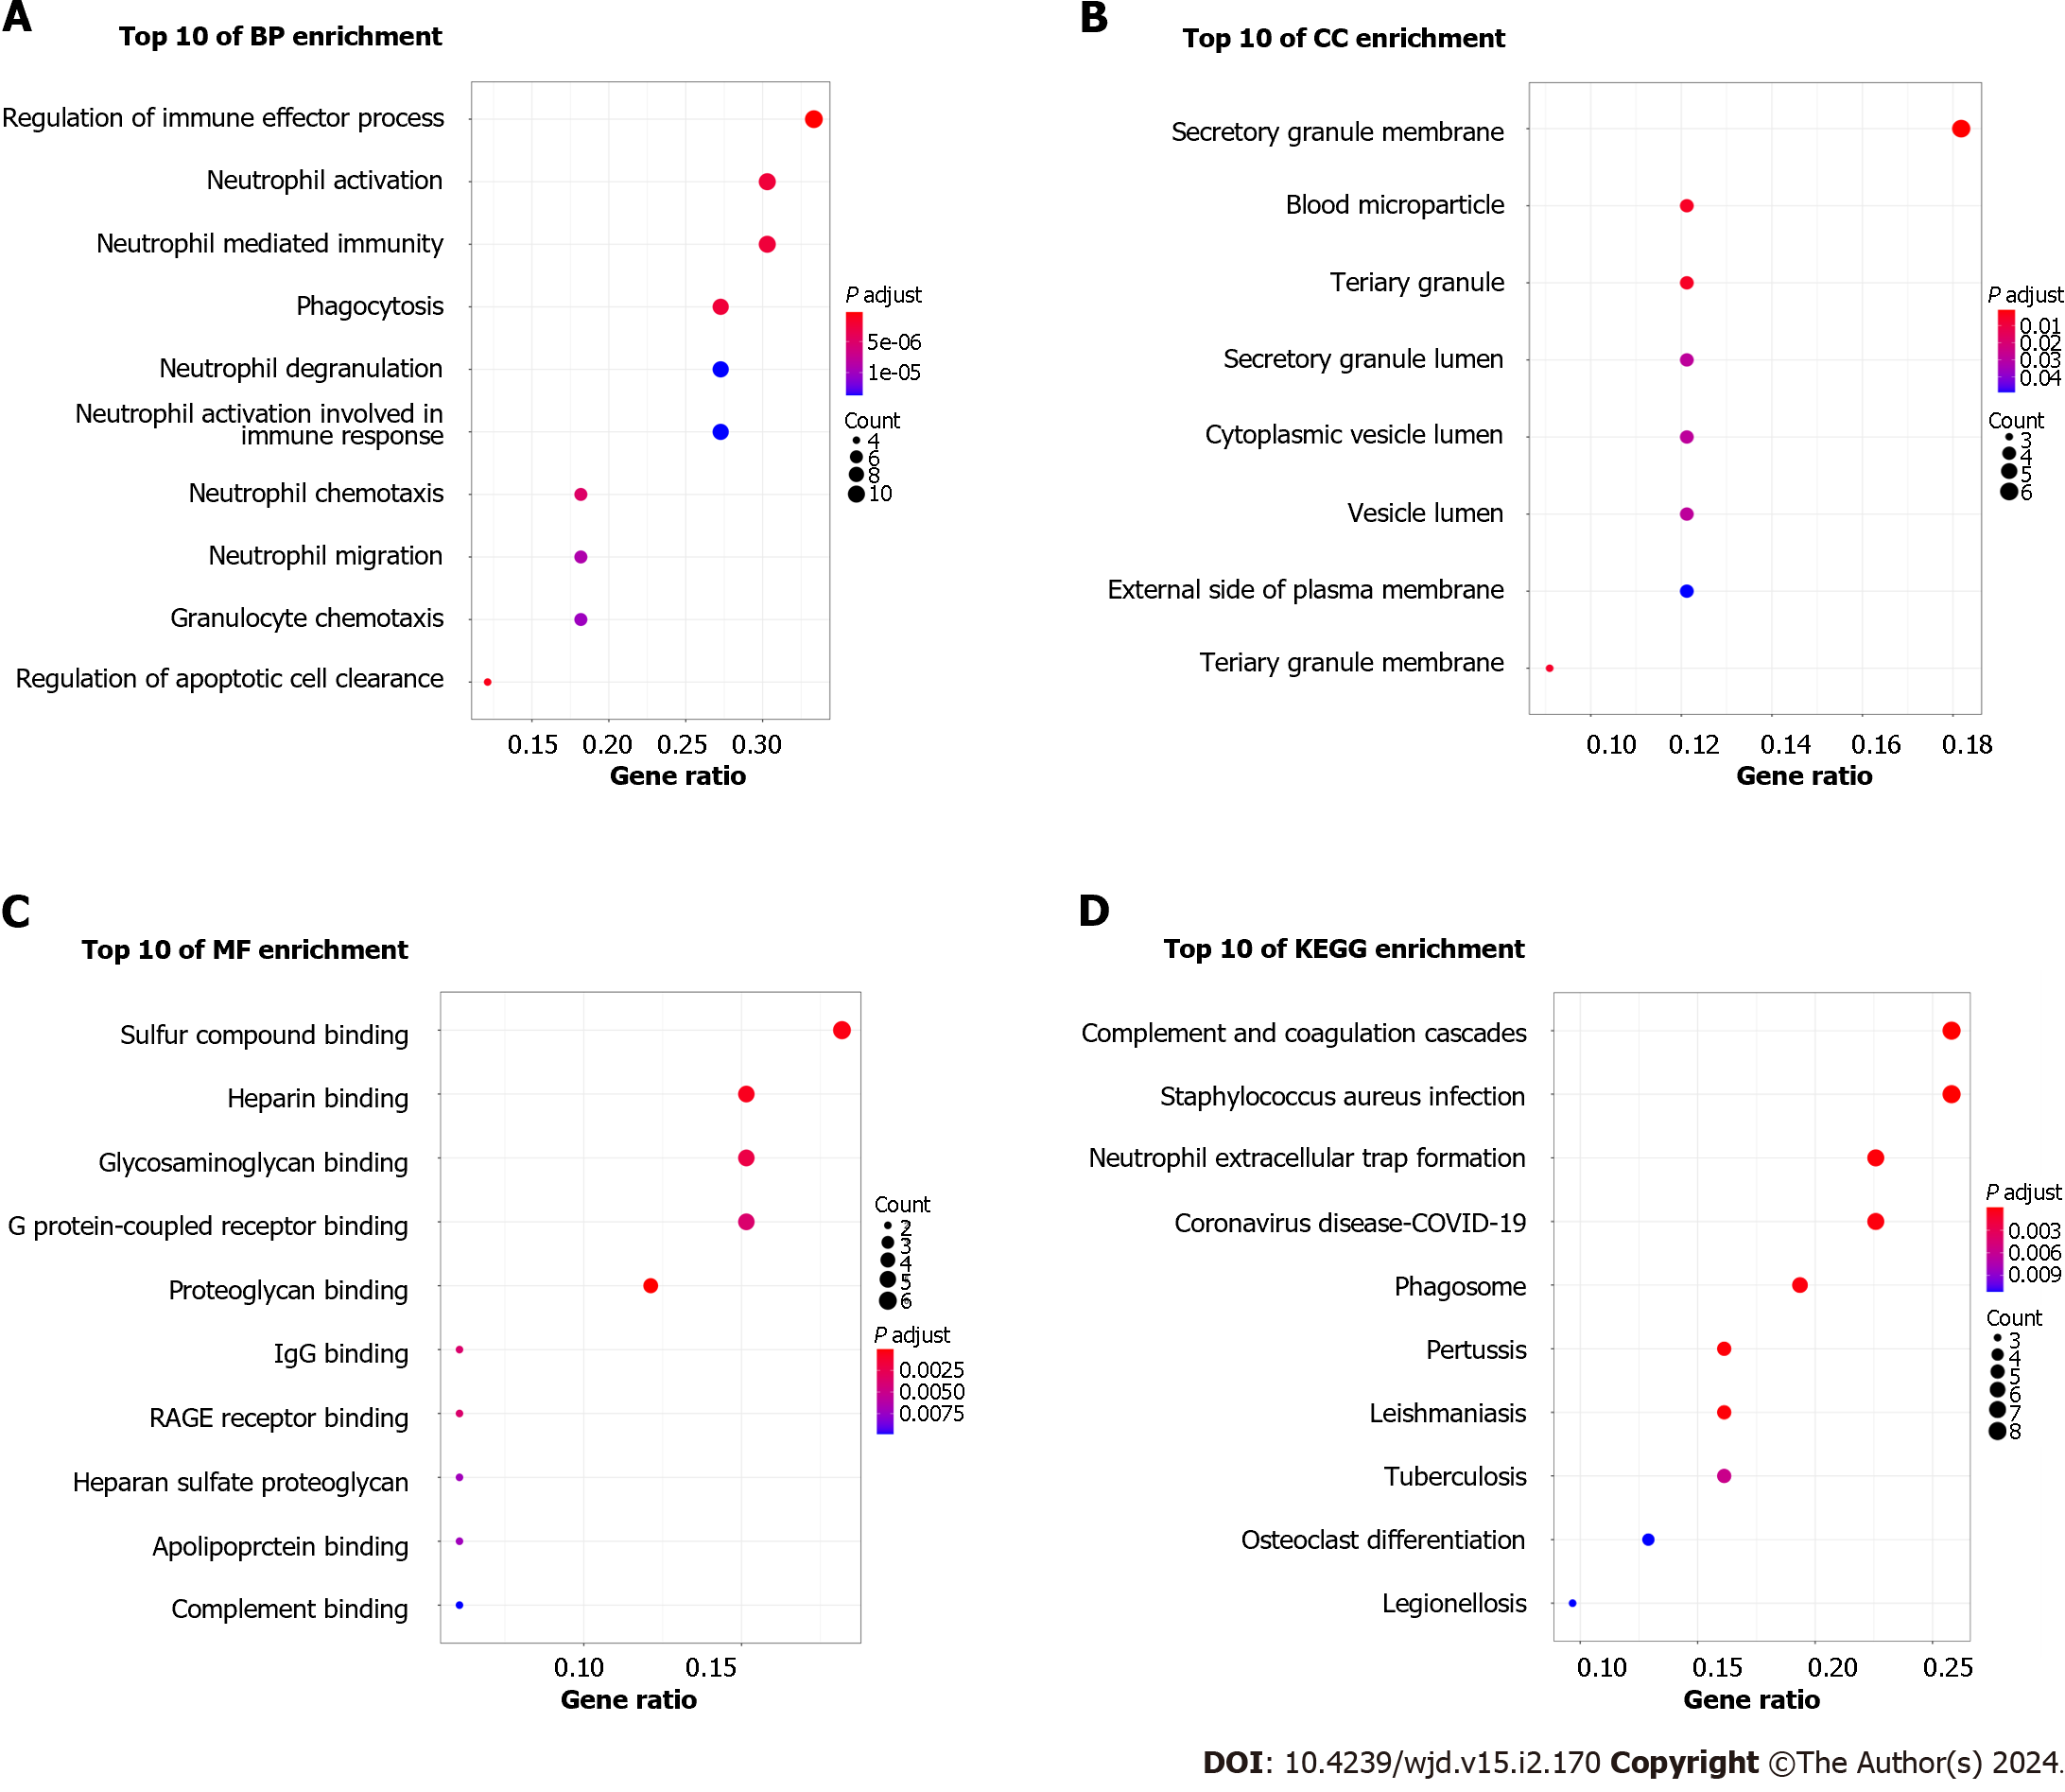
Figure 3 Functional enrichment analysis of common differentially expressed genes.
A: Biological process analysis of differentially expressed genes (DEGs); B: Cellular component analysis of DEGs; C: Molecular function analysis of DEGs; D: Kyoto Encyclopedia of Genes and Genomes pathway analysis of DEGs. BP: Biological process; CC: Cellular component; MF: Molecular function; KEGG: Kyoto Encyclopedia of Genes and Genomes.
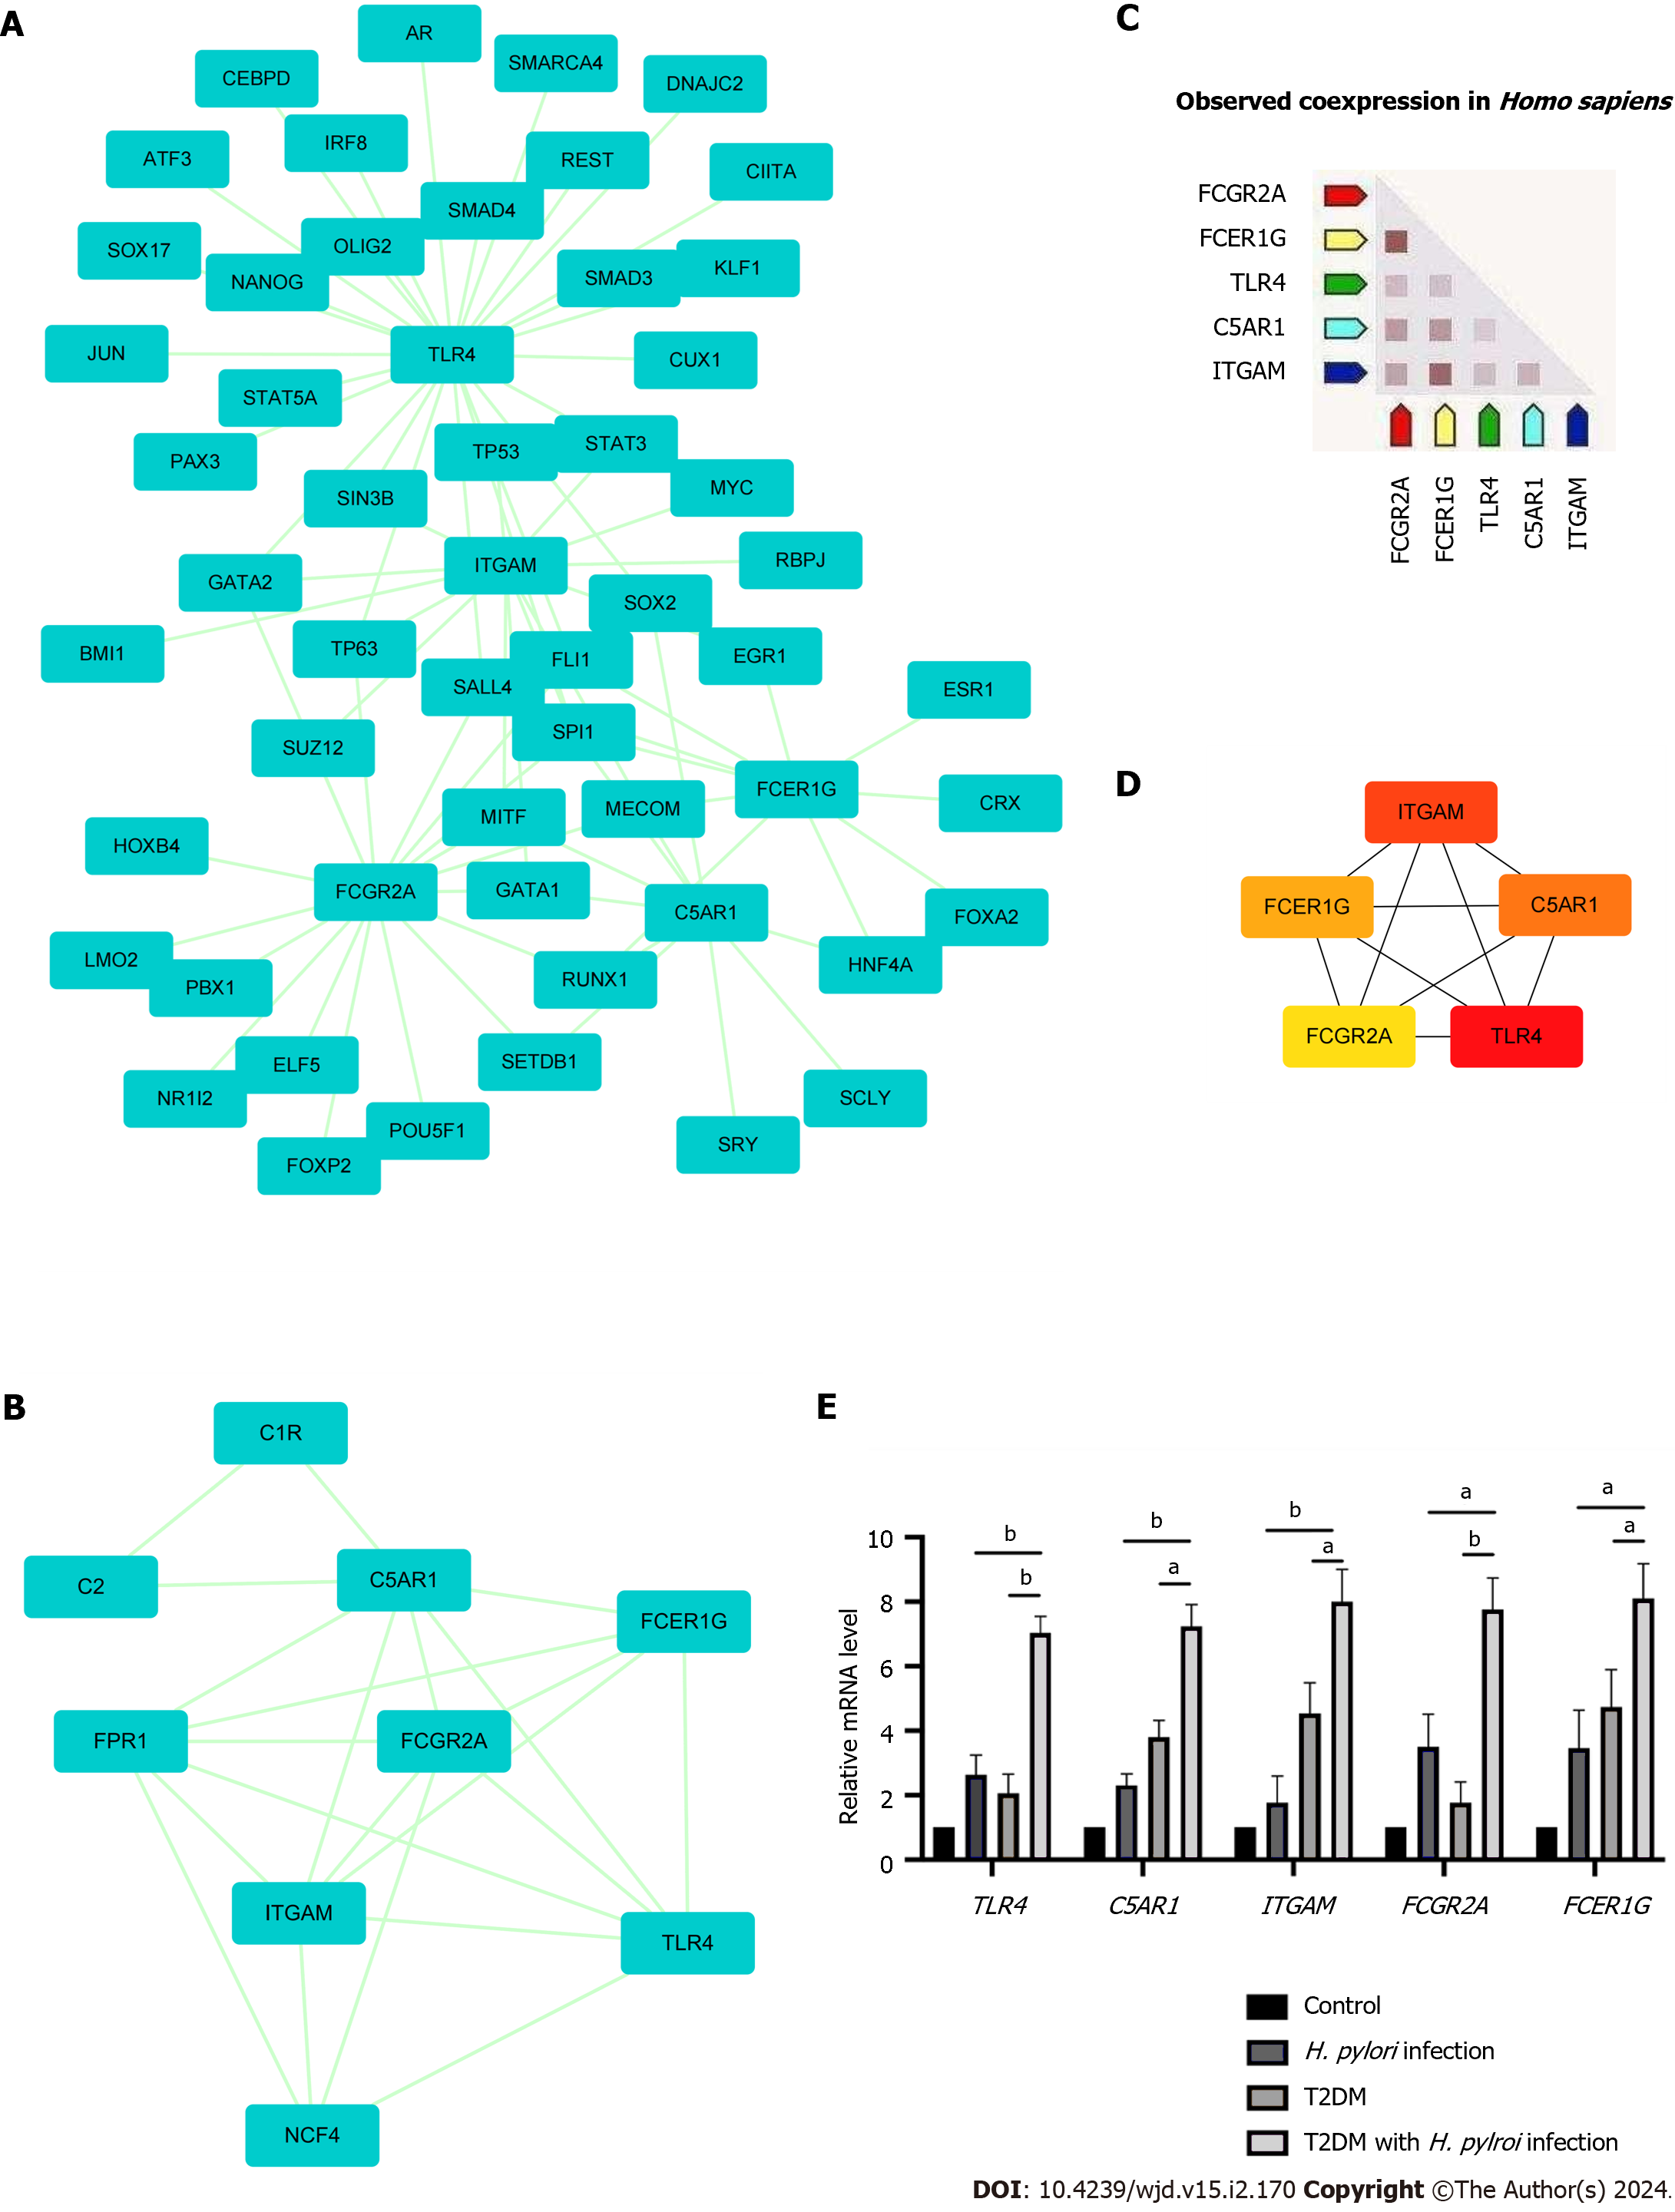
Figure 4 Protein-protein interaction network showing interactions between common genes and identification of differentially expressed genes from this network.
A: The protein-protein interaction (PPI) network of differentially expressed genes was constructed by Cytoscape software. The criteria of the PPI network were as follows: Confidence score ≥ 0.4 and a maximum number of interactions ≤ 5; B: The top module of the PPI network. MCODE score ≥ 3, 9 nodes and 21 edges; C: Construction of the PPI network among the 5 hub genes; D: Coexpression analysis of the 5 hub genes using STRING; E: The expression of 5 hub genes in clinical specimens by RT-qPCR analysis. aP < 0.05; bP < 0.01). T2DM: Type 2 diabetes mellitus; H. pylori: Helicobacter pylori.
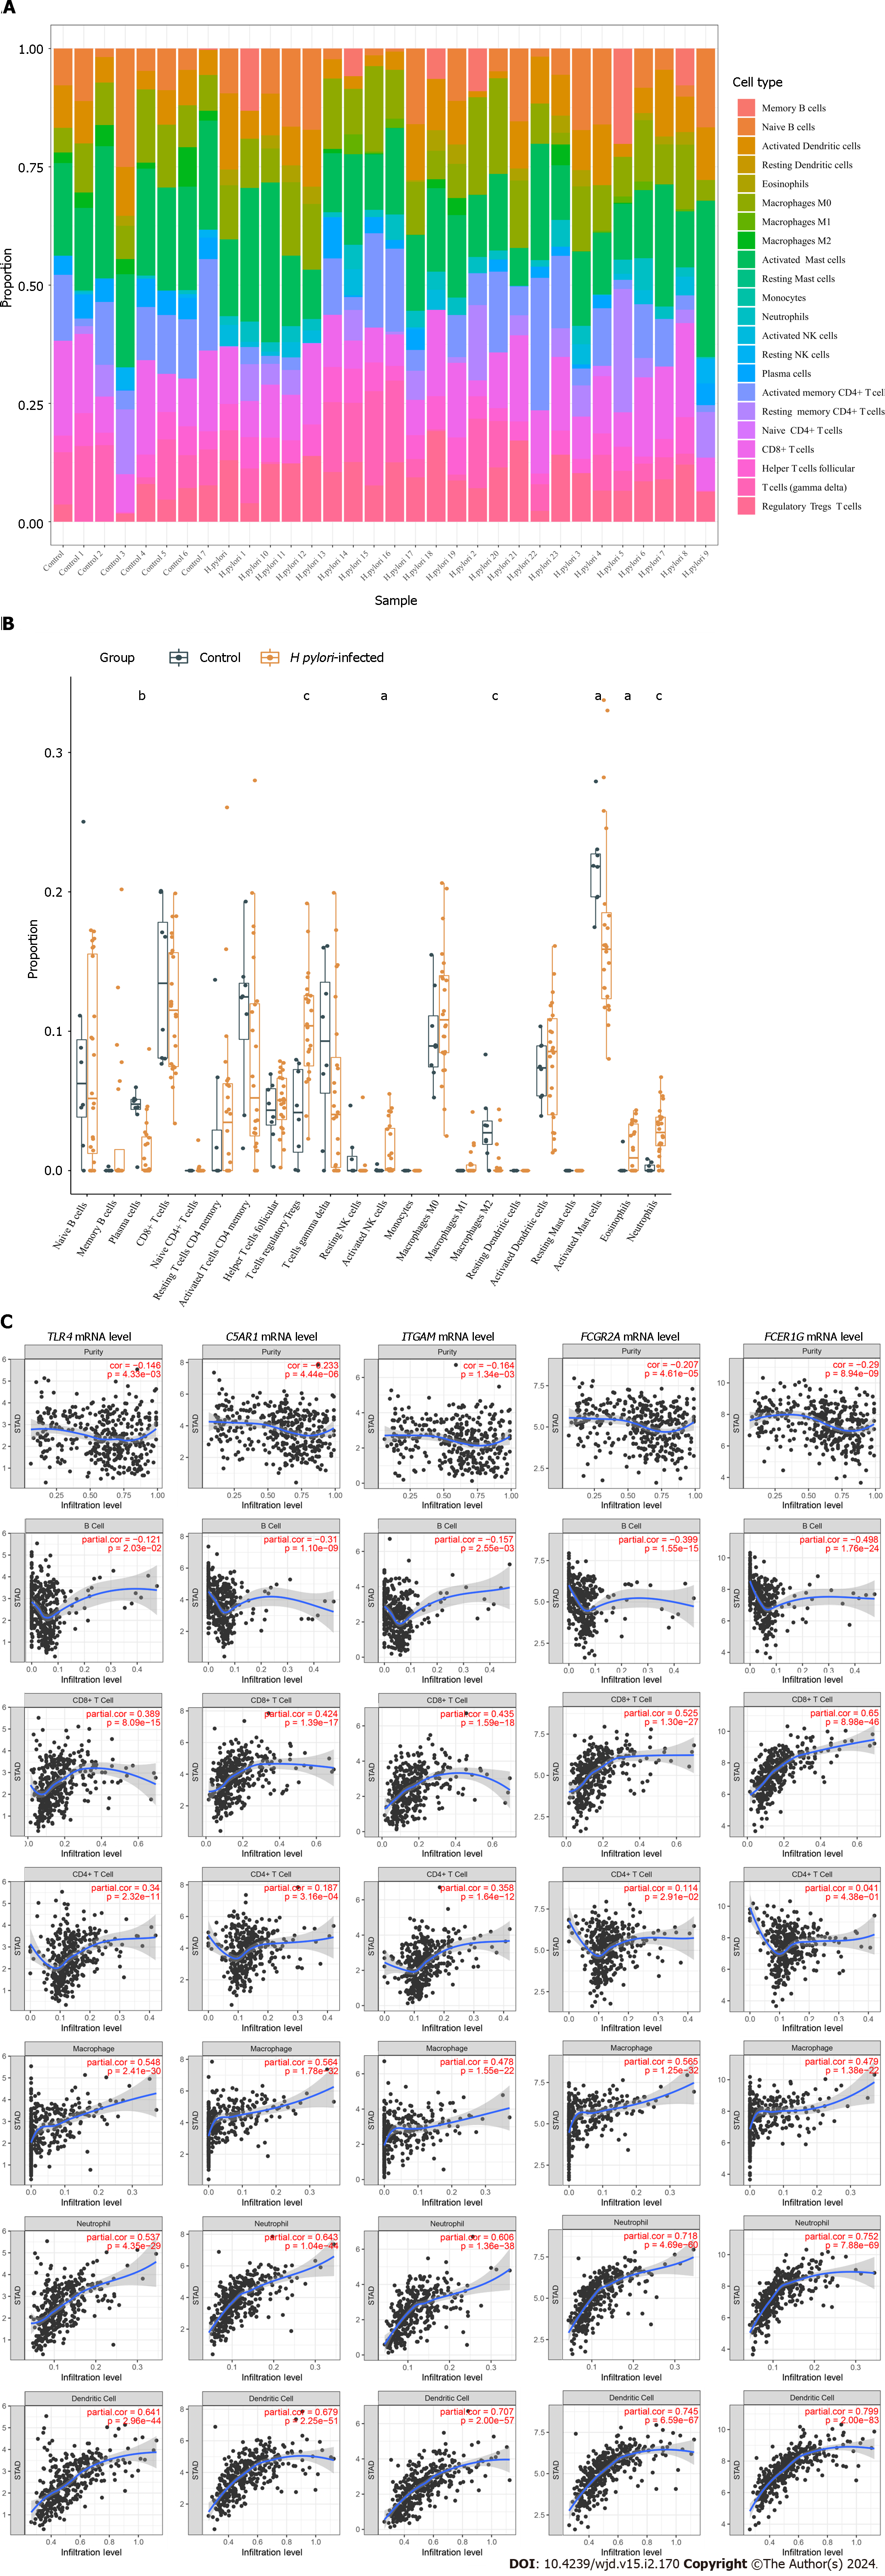
Figure 5 The relationship between hub genes and immune infiltration.
A and B The differences in immune infiltration between Helicobacter pylori (H. pylori)-infected gastric tissues and normal gastric tissues; C: Correlation analysis between hub gene expression and immune cell infiltration levels in H. pylori infection. H. pylori: Helicobacter pylori. aP < 0.05, bP < 0.01, cP < 0.001.
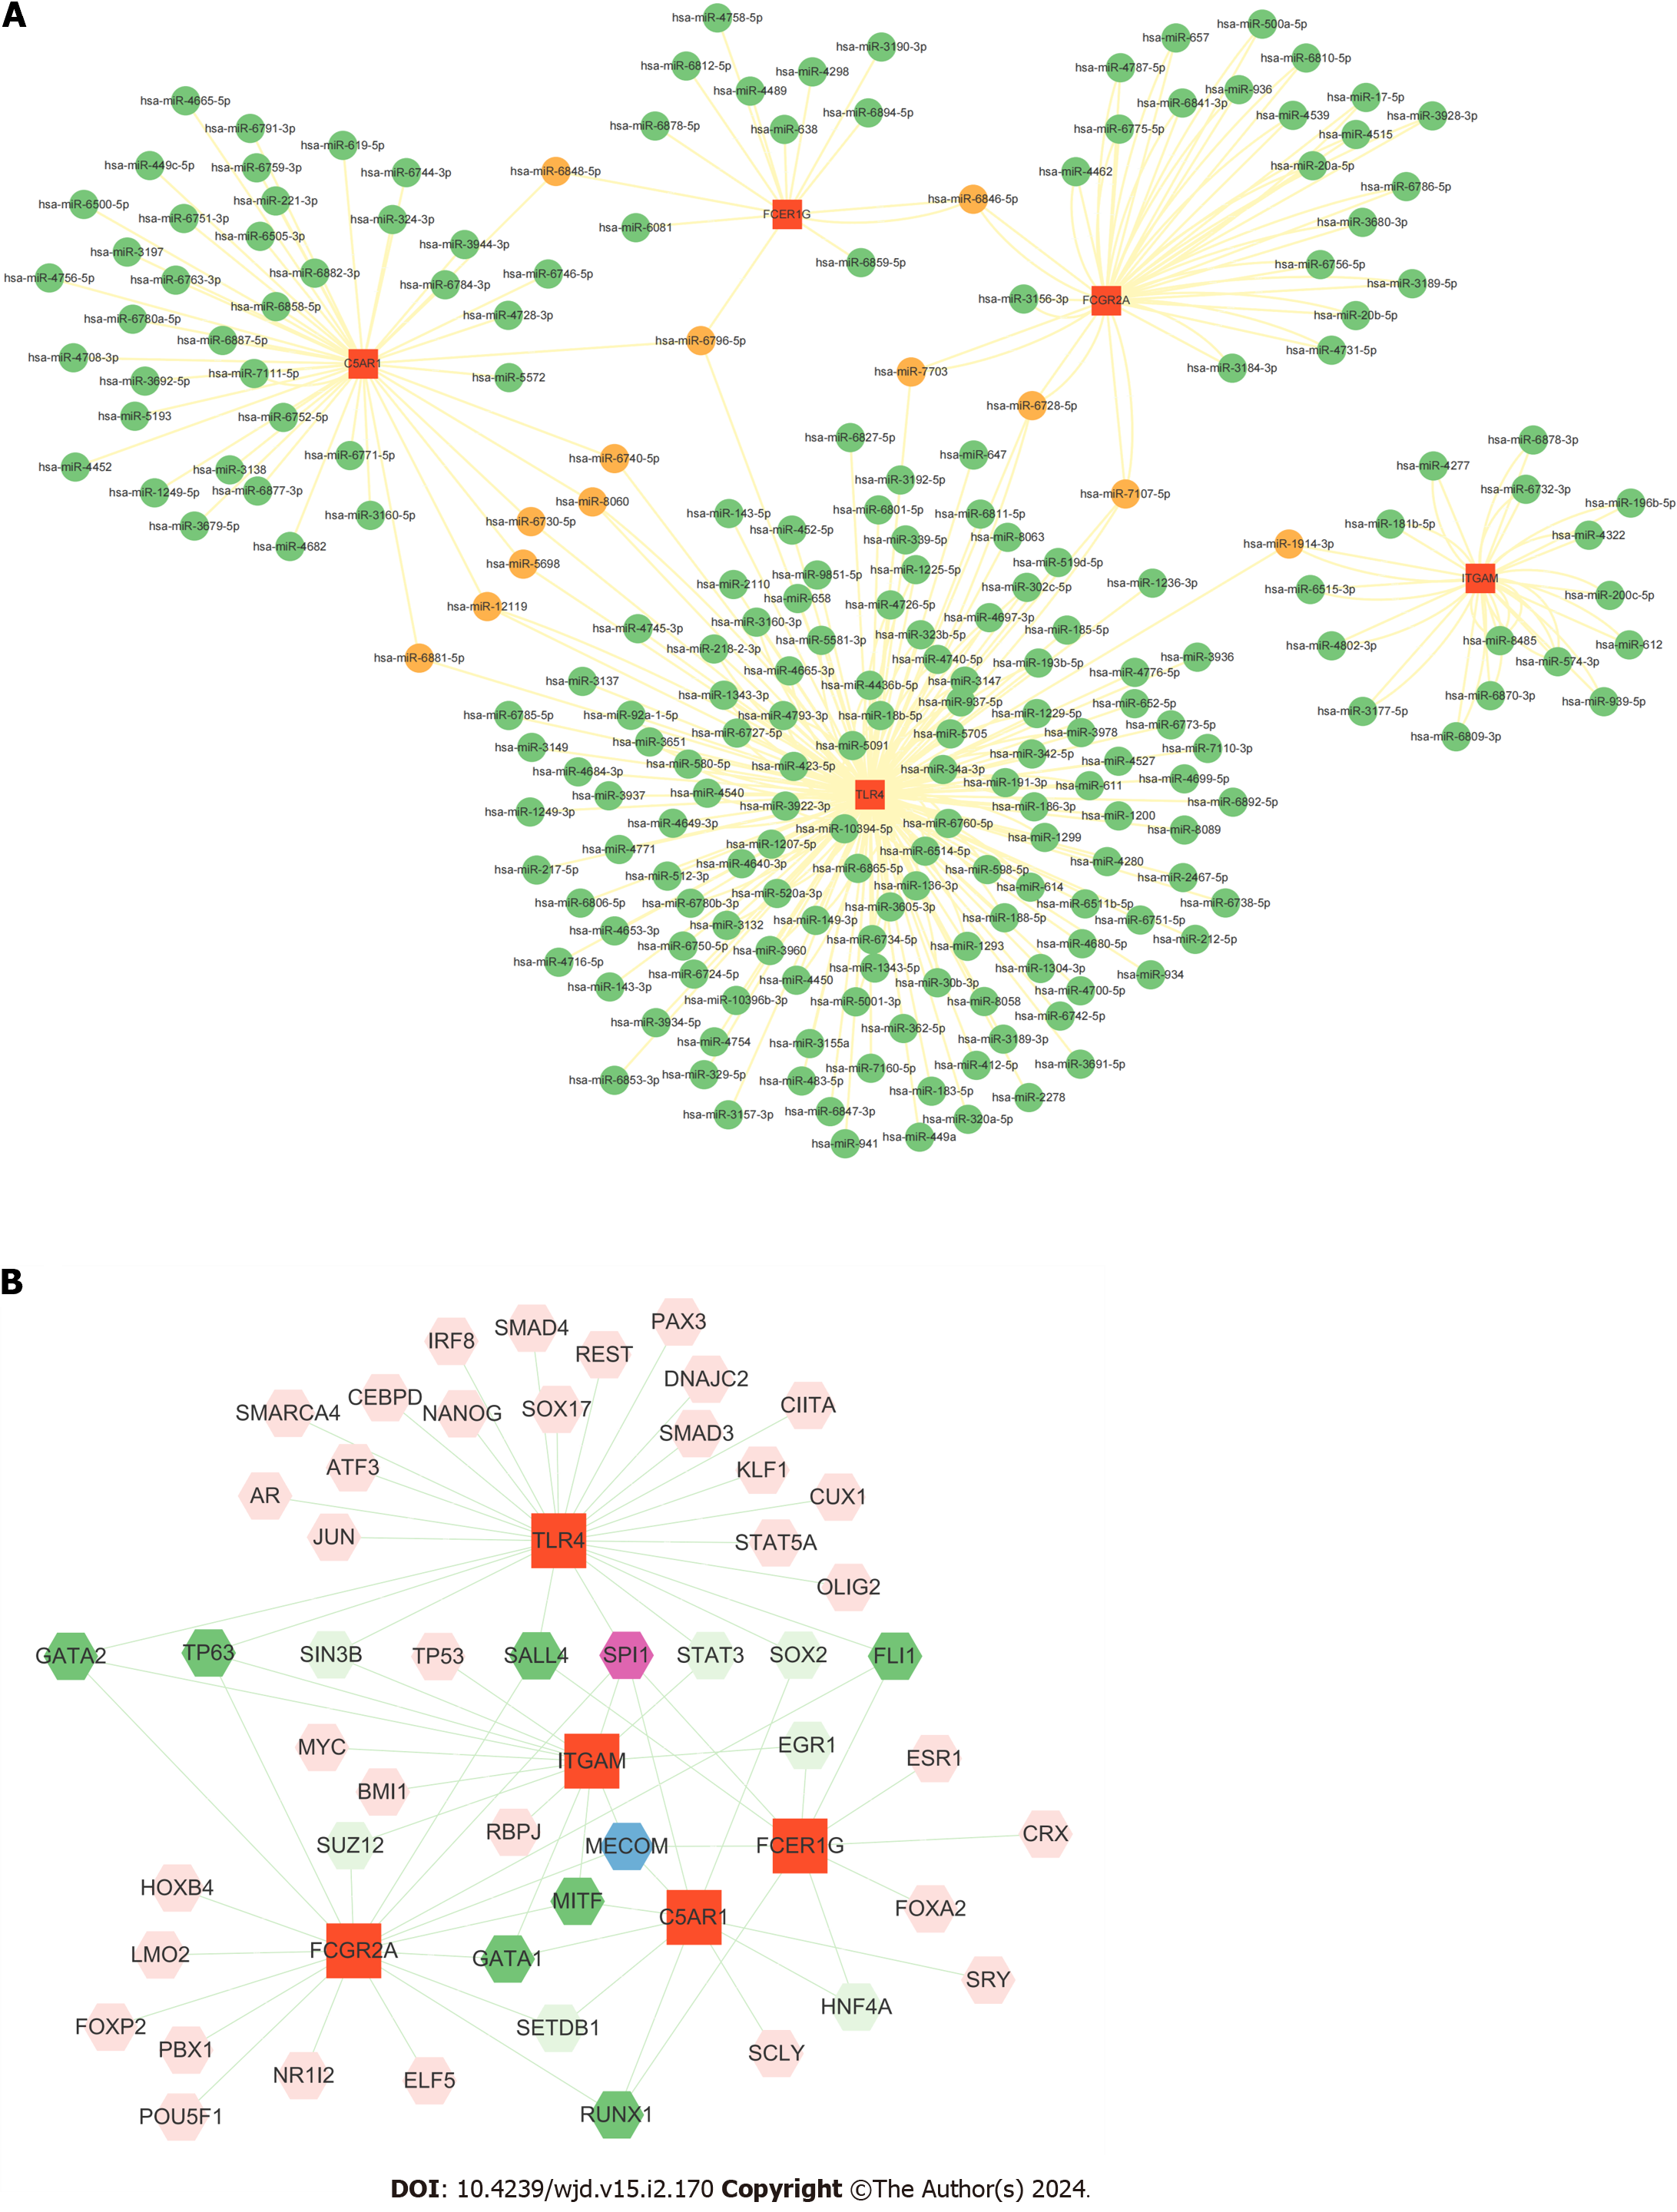
Figure 6 The interaction of hub genes with miRNA/transcriptional factors.
A: Interaction network between the hub genes and their targeted miRNAs. Hub genes are presented in red squares, whereas miRNAs are shown in green circles. Orange circles represent miRNAs targeting two or more genes simultaneously; B: Construction of the transcriptional factor-gene interaction network from Cytoscape.
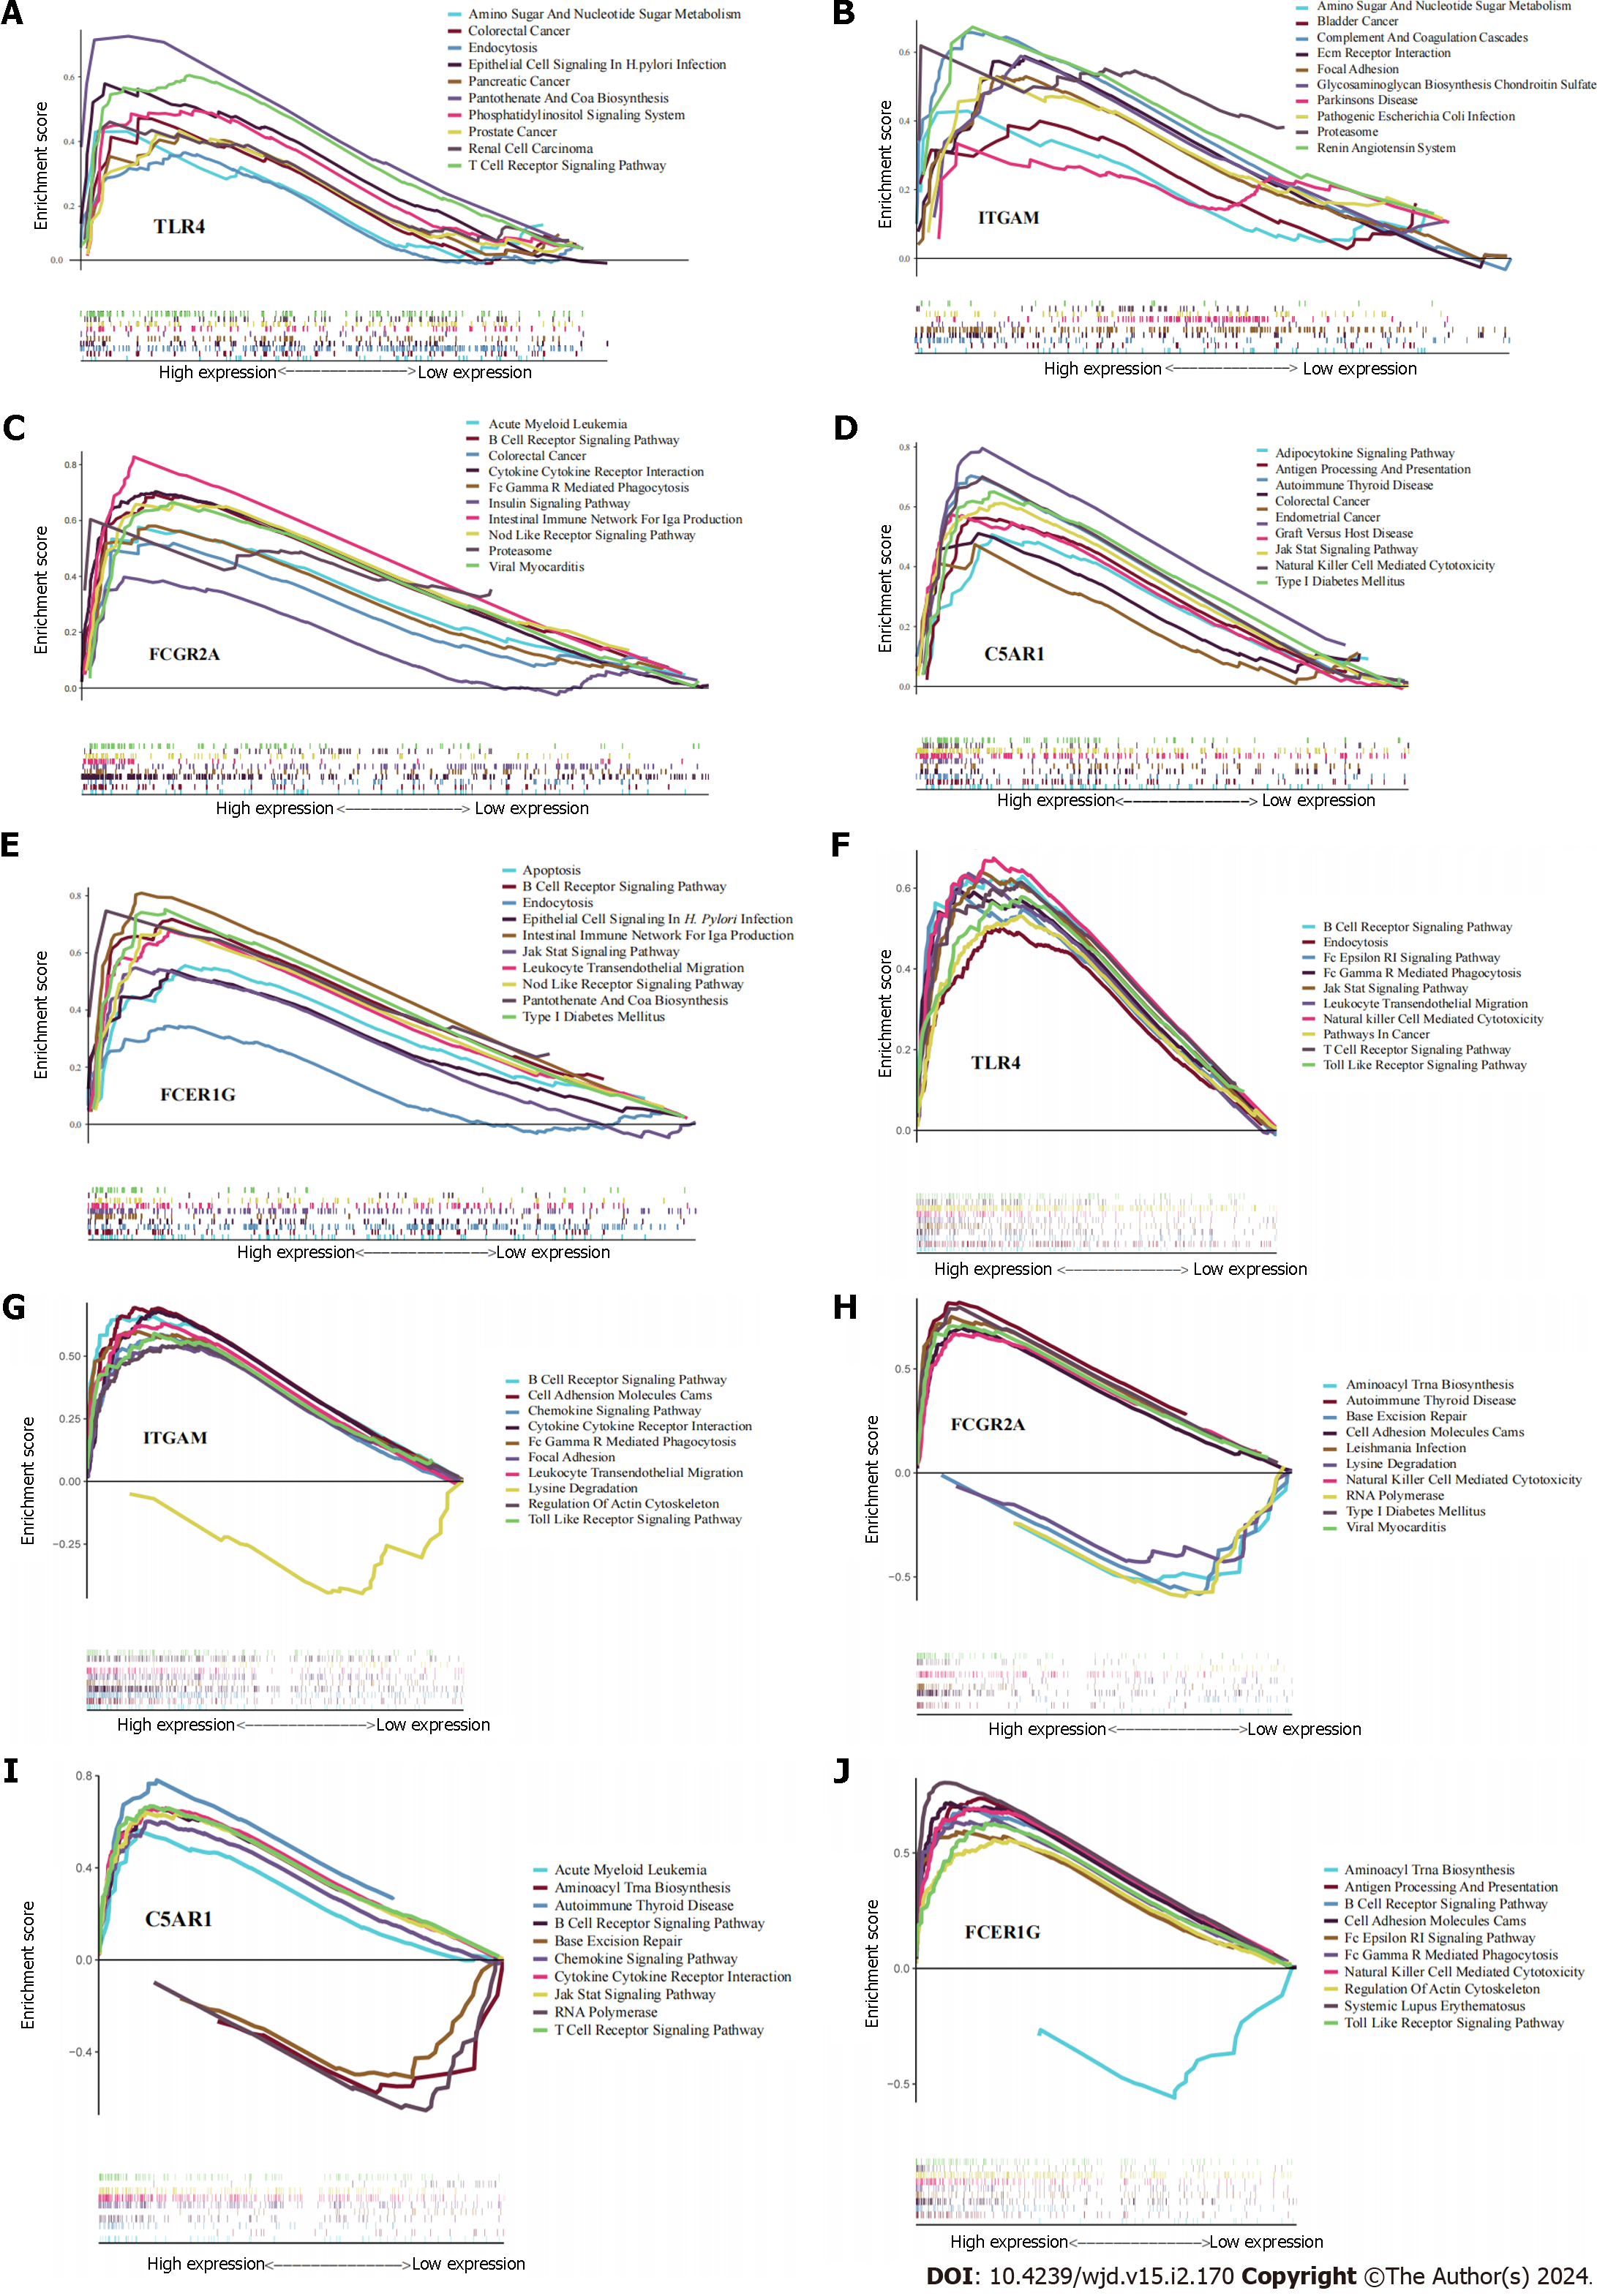
Figure 7 Results of single-gene gene set enrichment analysis.
A-E: Helicobacter pylori infection; F-J: Type 2 diabetes mellitus.
- Citation: Chen H, Zhang GX, Zhou XY. Identification of hub genes associated with Helicobacter pylori infection and type 2 diabetes mellitus: A pilot bioinformatics study. World J Diabetes 2024; 15(2): 170-185
- URL: https://www.wjgnet.com/1948-9358/full/v15/i2/170.htm
- DOI: https://dx.doi.org/10.4239/wjd.v15.i2.170


