Copyright
©The Author(s) 2024.
World J Diabetes. Oct 15, 2024; 15(10): 2147-2151
Published online Oct 15, 2024. doi: 10.4239/wjd.v15.i10.2147
Published online Oct 15, 2024. doi: 10.4239/wjd.v15.i10.2147
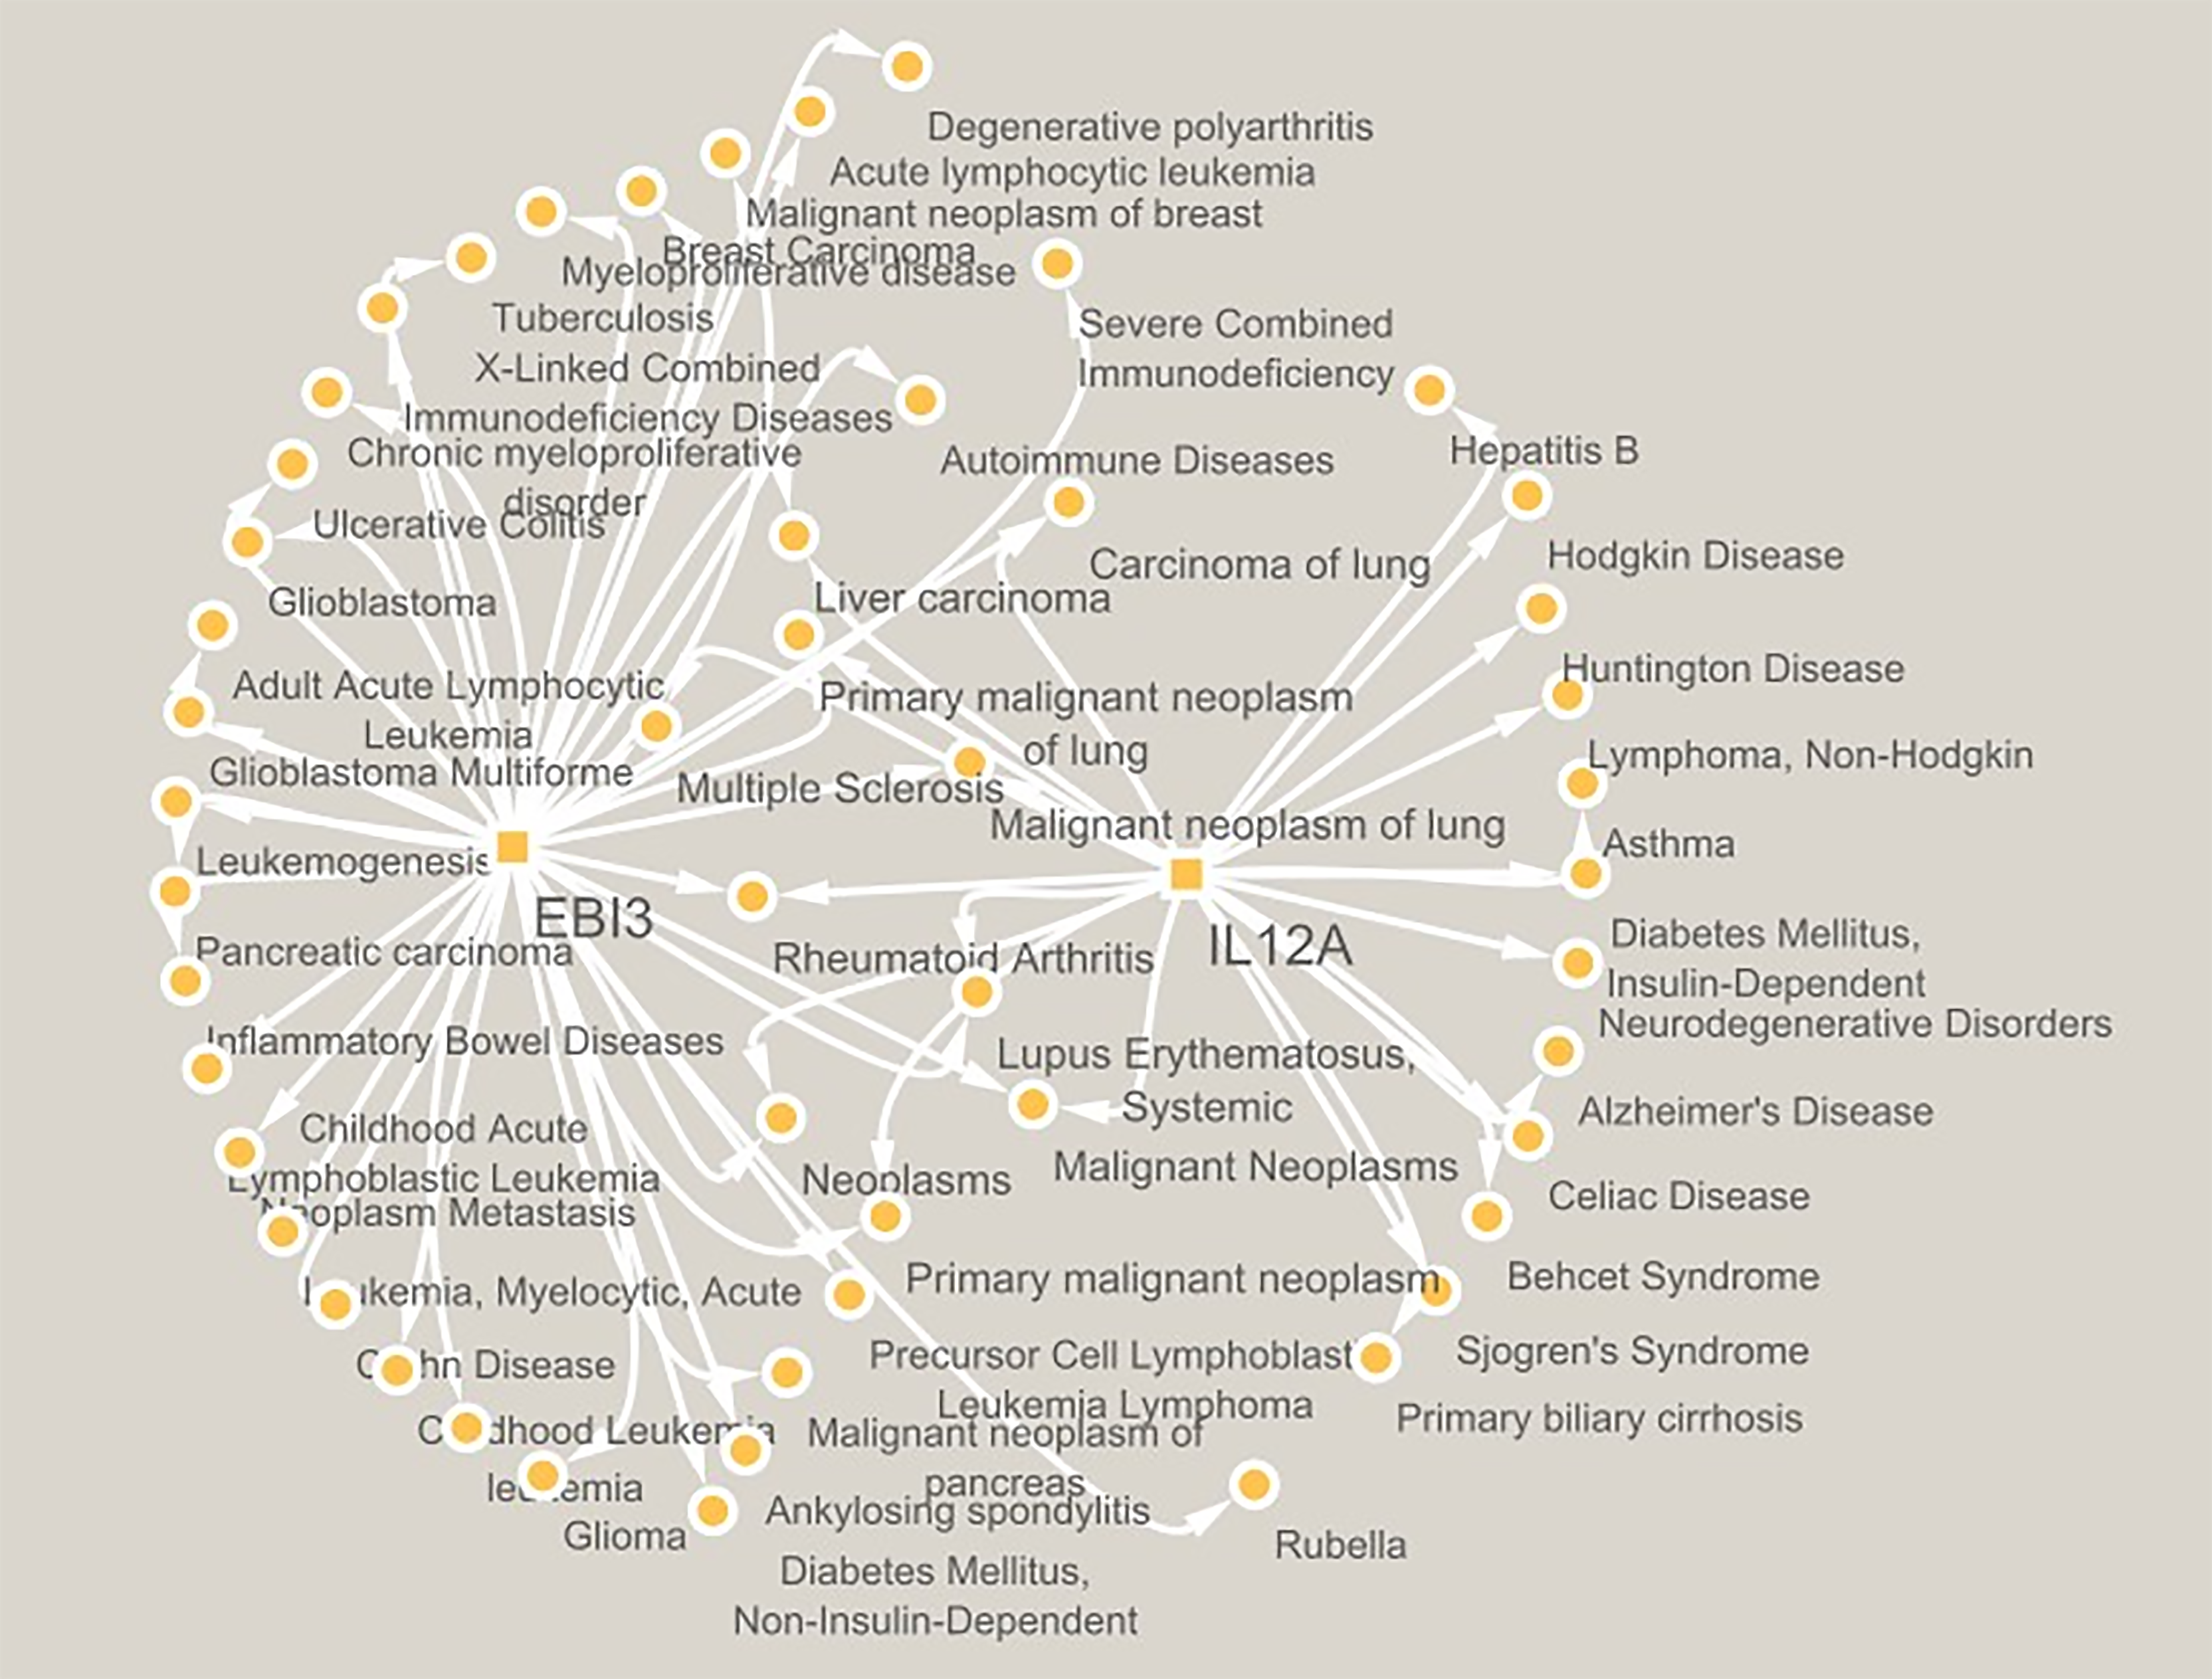
Figure 1 Schematic representation of interleukin-12A and Epstein–Barr virus-induced 3 individually and mutually networked with different diseases by white solid lines.
Data were collected from the PubMed database. The disease-gene association is searched in the DisGeNET database v 7.0 for gene-disease associations, whereas the "N_PMIDs (citation)" ≥ 3 were considered, and a gene-disease target network was created and analyzed using CYTOSCAPE version 3.10.0. Schematic representation of networking in Figure 1, in which interleukin-12A and Epstein–Barr virus-induced 3 are found to be individually and mutually networked by solid white lines.
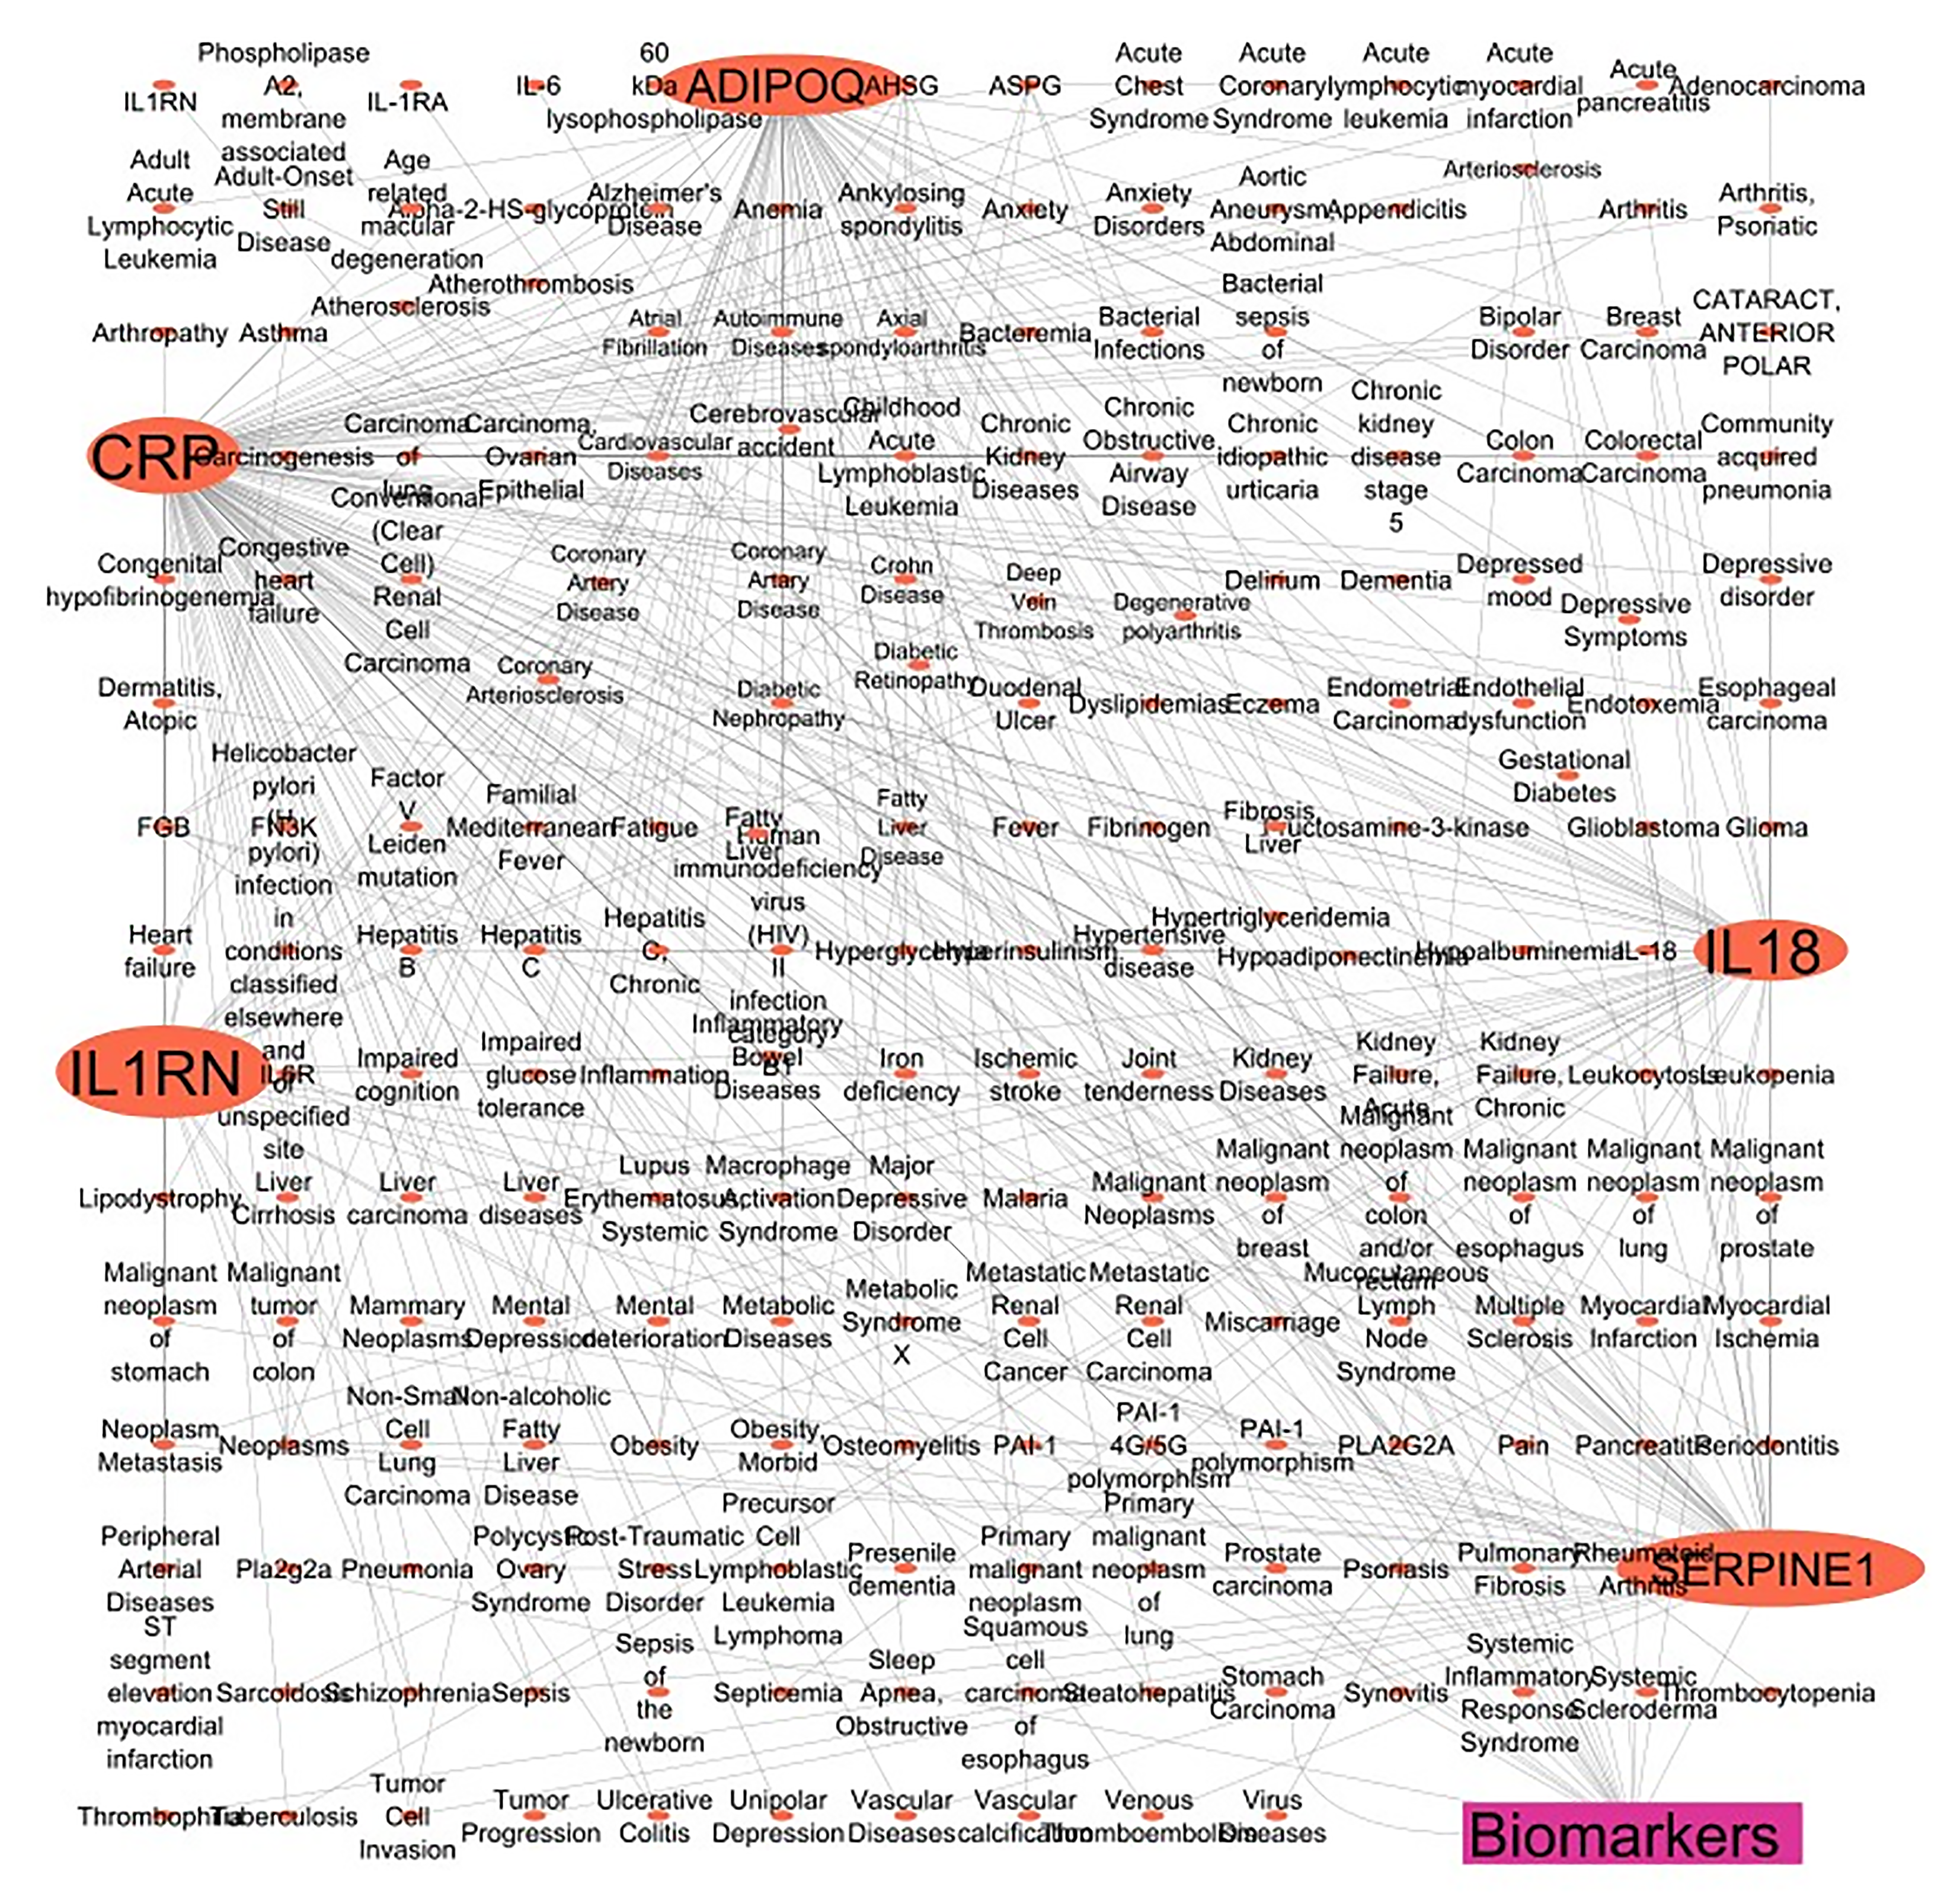
Figure 2 Schematic representation of networking of the 5 genes encodes 5 unique protein/enzymatic markers.
A total of 5 clinically identified protein/enzyme markers were identified from the PubMed database. Next, their UniProt ID and human gene names were searched in the UniProt databases, and their disease associations were found in the DisGeNET database v7.0. A note on gene-disease associations with N_PMIDs (citation) greater than or equal to 10 was taken. Lastly, the gene-disease target network was constructed and analyzed using CYTOSCAPE version 3.10.0.
- Citation: Chakraborty R, Mukherjee AK, Bala A. Interleukin-35: A key player managing pre-diabetes and chronic inflammatory type 1 autoimmune diabetes. World J Diabetes 2024; 15(10): 2147-2151
- URL: https://www.wjgnet.com/1948-9358/full/v15/i10/2147.htm
- DOI: https://dx.doi.org/10.4239/wjd.v15.i10.2147


