Copyright
©The Author(s) 2024.
World J Diabetes. Oct 15, 2024; 15(10): 2135-2146
Published online Oct 15, 2024. doi: 10.4239/wjd.v15.i10.2135
Published online Oct 15, 2024. doi: 10.4239/wjd.v15.i10.2135
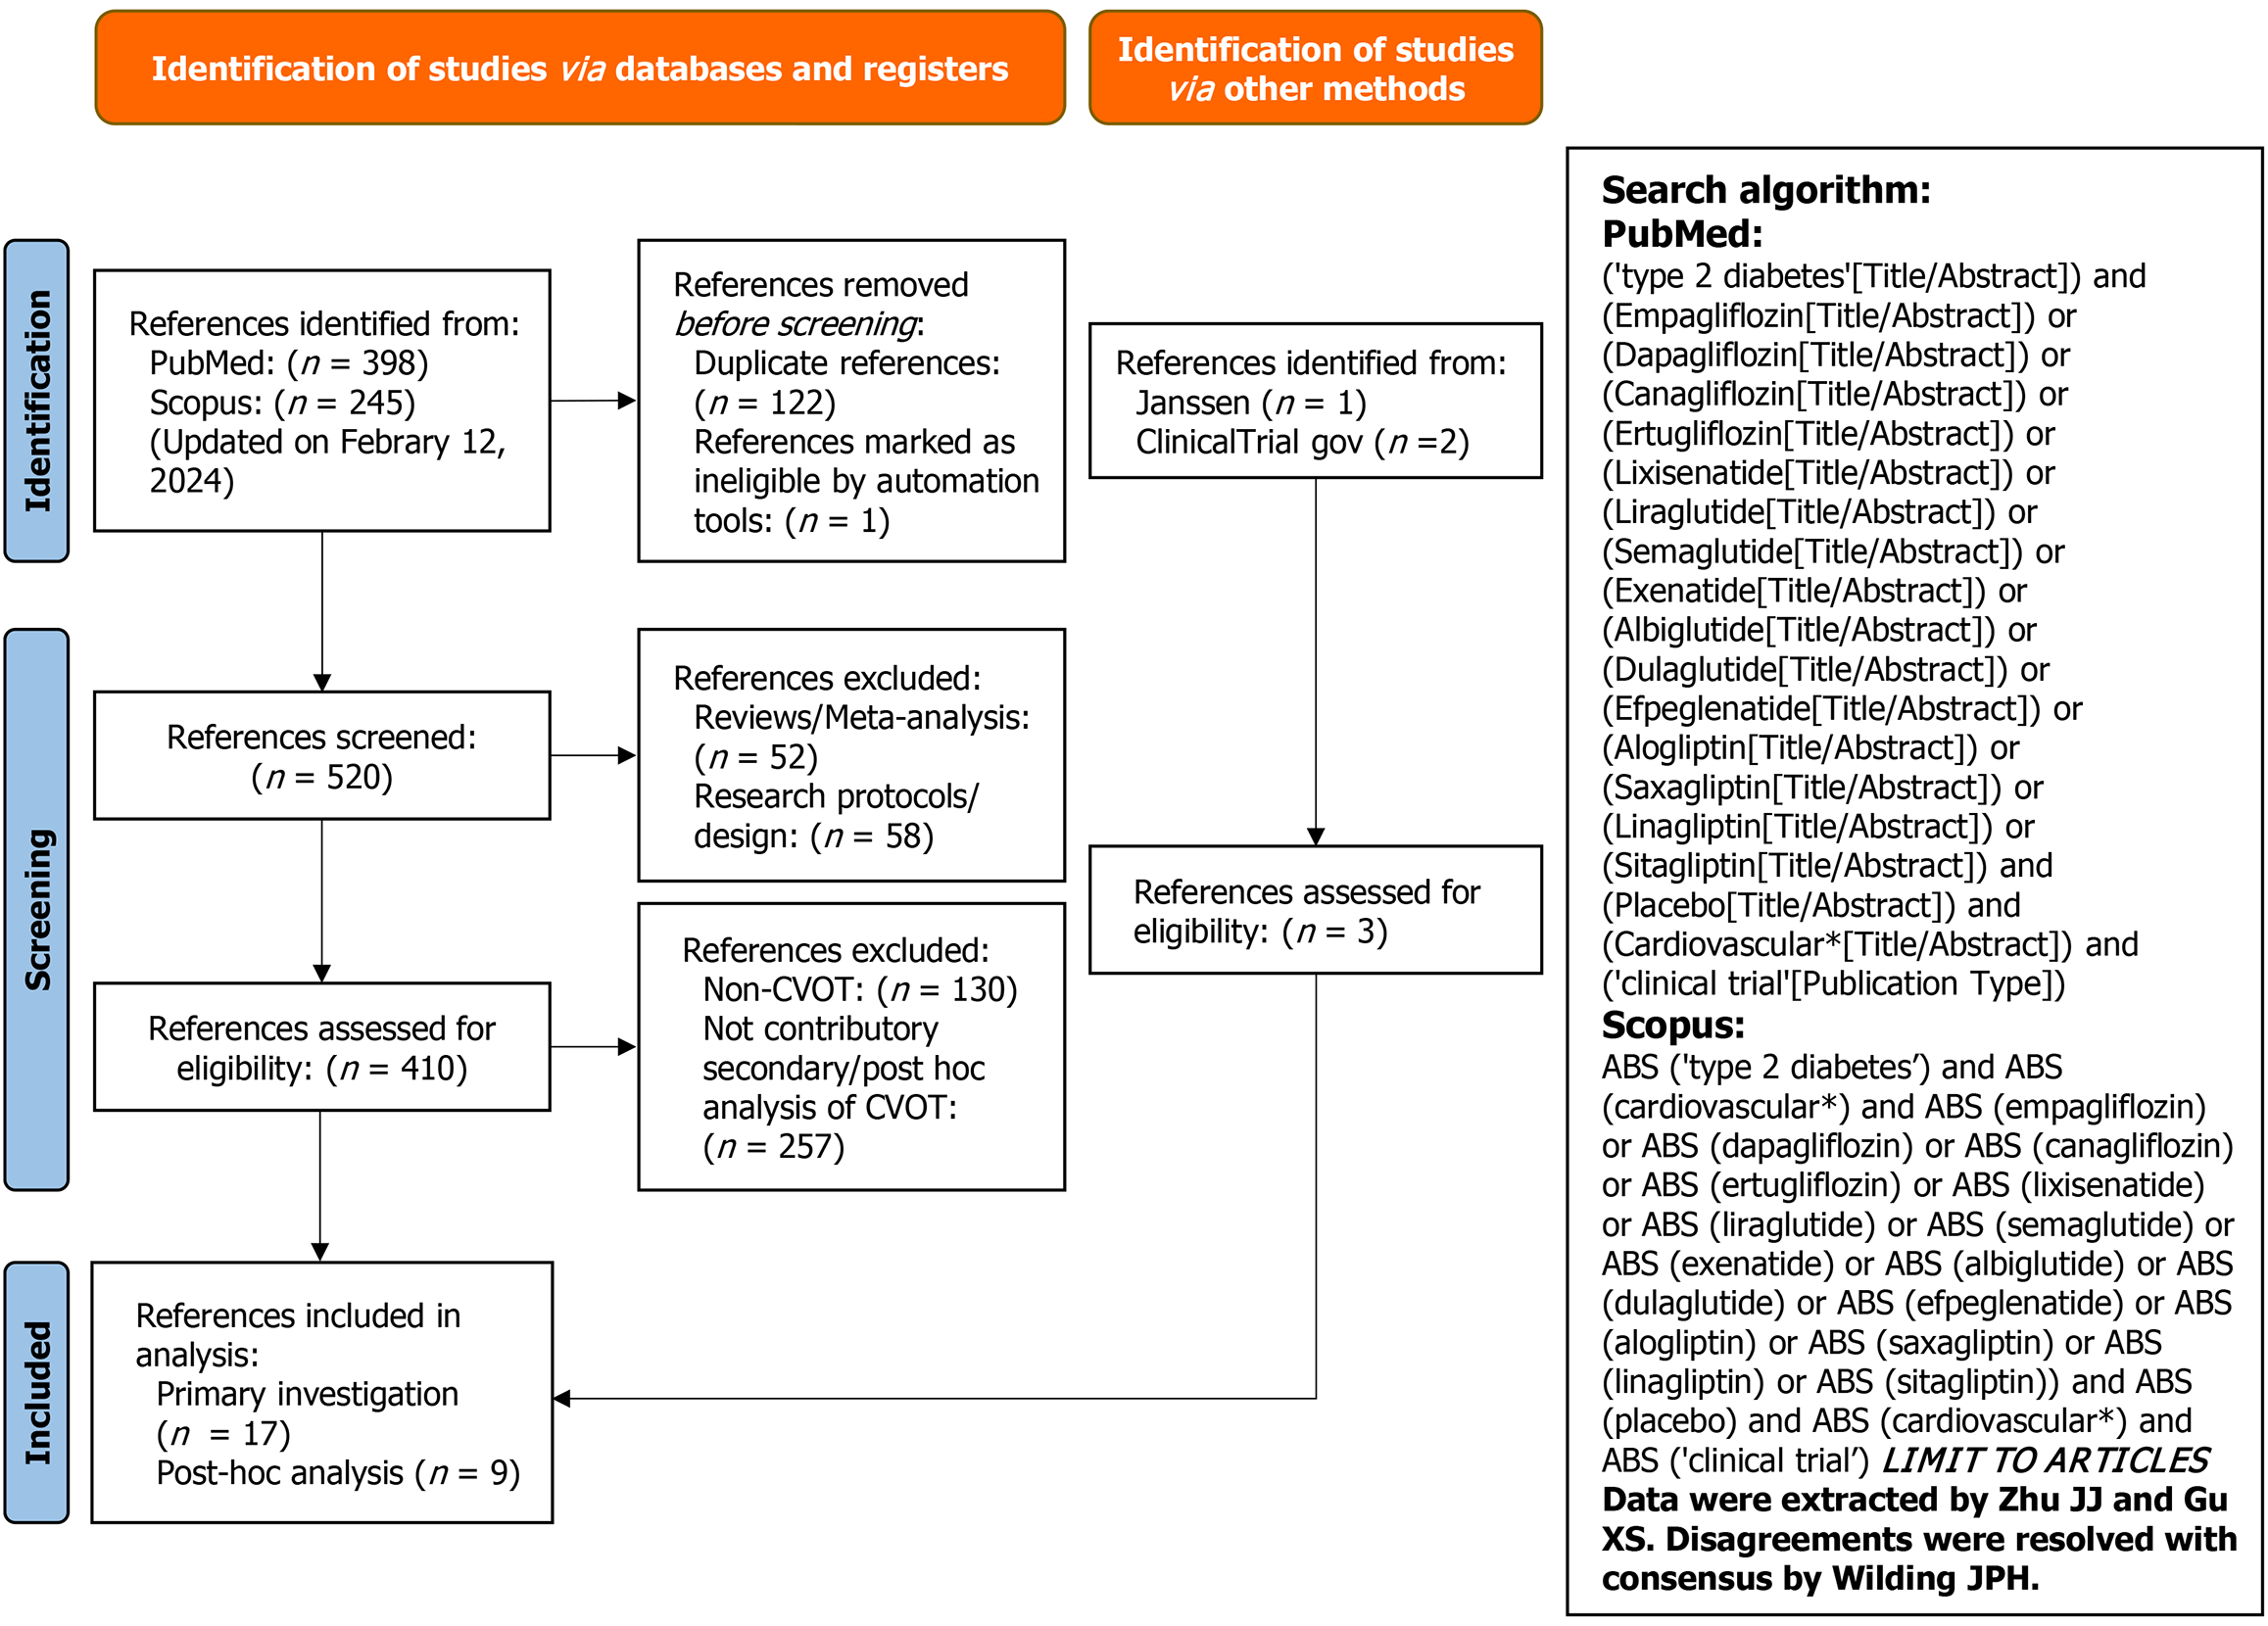
Figure 1 PRISMA flow diagram with search algorithm.
CVOT: Cardiovascular outcome trials.
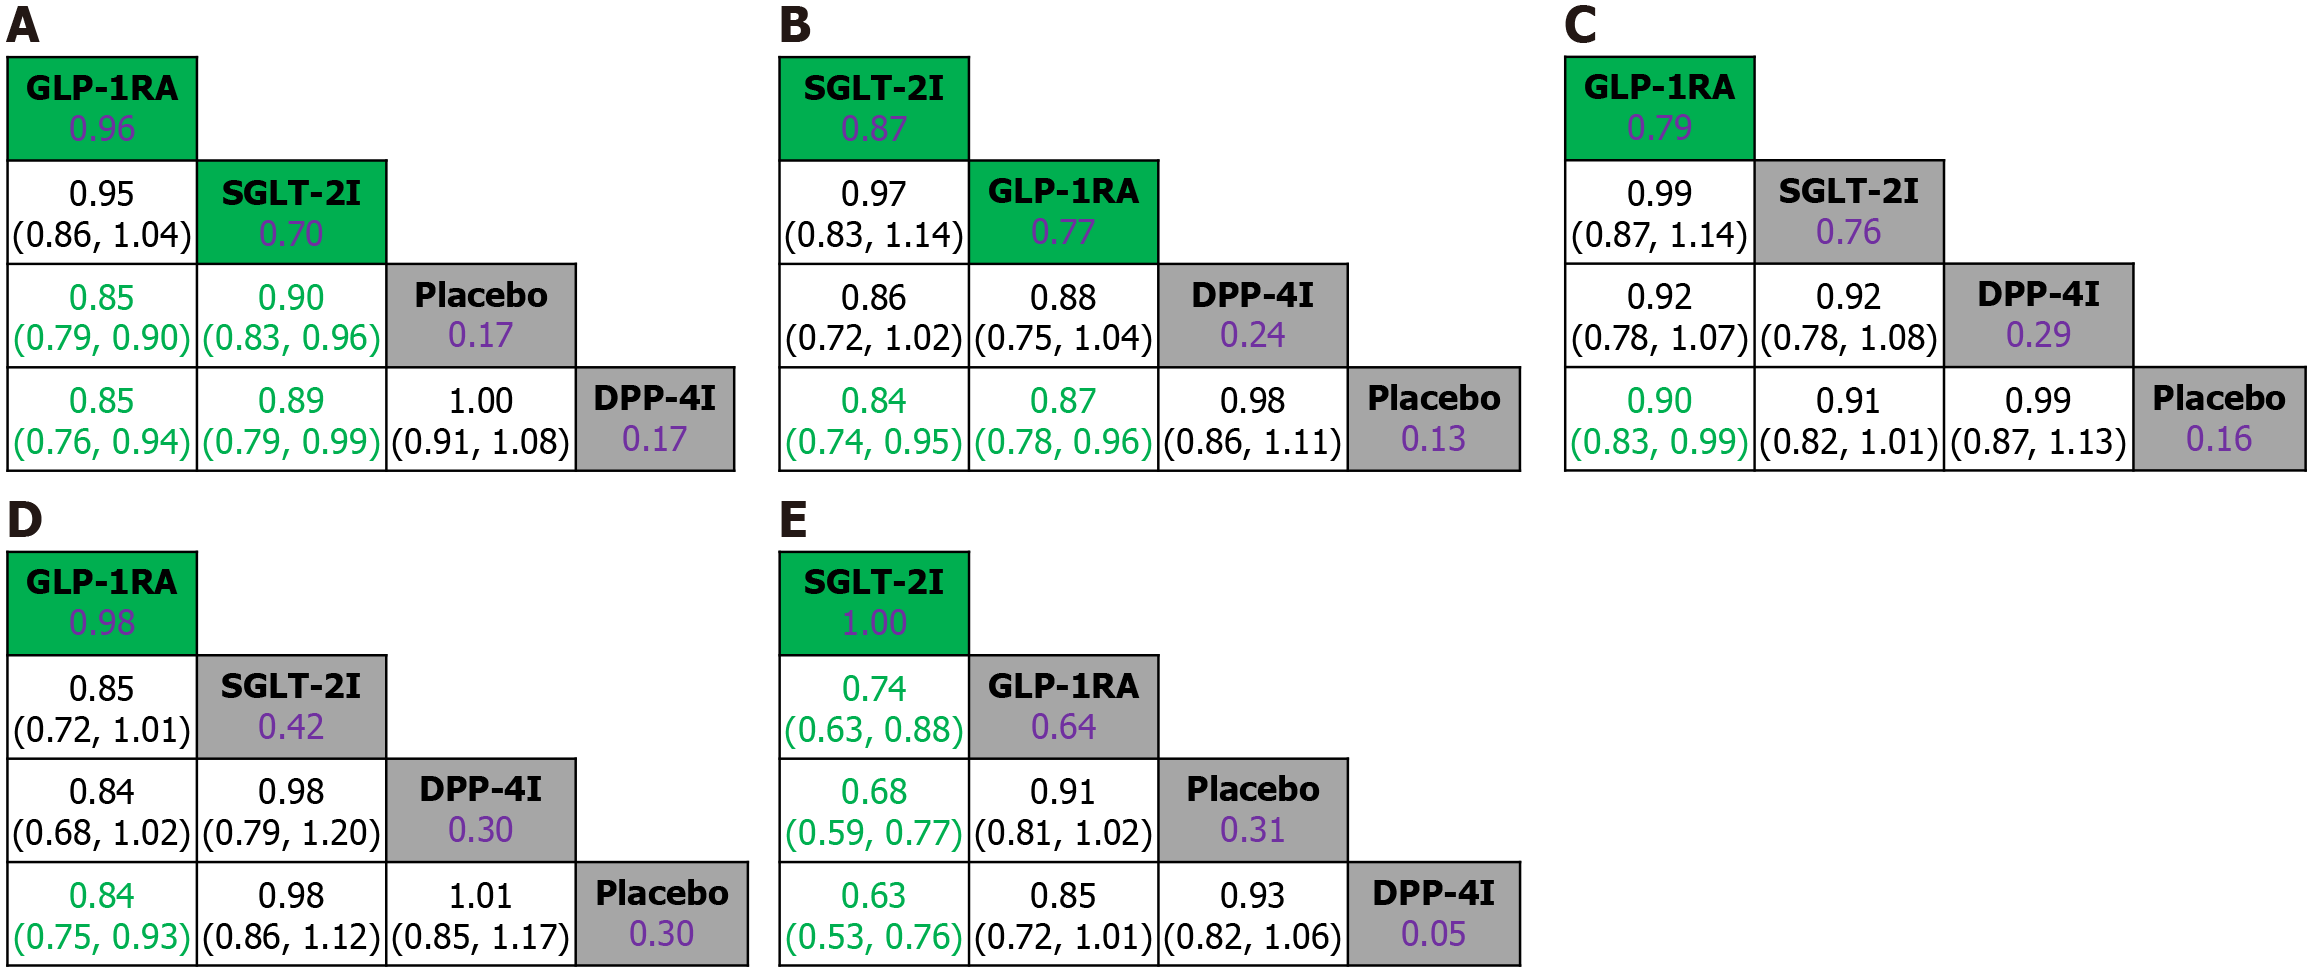
Figure 2 Comparisons of primary and secondary cardiovascular outcomes among newer glucose-lowering medications in type 2 diabetes.
A: Major adverse cardiovascular events; B: Cardiovascular death; C: Fatal and non-fatal myocardial infarction; D: Fatal and non-fatal stroke; E: Hospitalization for heart failure. The treatments are reported in order of cardiovascular outcome ranking according to surface under the cumulative ranking curve (indicated in purple). Comparisons in the network meta-analyses should be read from left to right. The results, i.e., hazard ratios (HR) with 95%CI, are located at the intersection of the column-defining treatment and the row-defining treatment (indicated in green and black). For the observed primary and secondary outcomes of the cardiovascular outcome trials, HR (< 1) favors the column-defining treatment. Significant results and treatments of significant cardiovascular benefit are indicated in green.
- Citation: Zhu JJ, Wilding JPH, Gu XS. Combining GLP-1 receptor agonists and SGLT-2 inhibitors for cardiovascular disease prevention in type 2 diabetes: A systematic review with multiple network meta-regressions. World J Diabetes 2024; 15(10): 2135-2146
- URL: https://www.wjgnet.com/1948-9358/full/v15/i10/2135.htm
- DOI: https://dx.doi.org/10.4239/wjd.v15.i10.2135


