Copyright
©The Author(s) 2024.
World J Diabetes. Oct 15, 2024; 15(10): 2093-2110
Published online Oct 15, 2024. doi: 10.4239/wjd.v15.i10.2093
Published online Oct 15, 2024. doi: 10.4239/wjd.v15.i10.2093
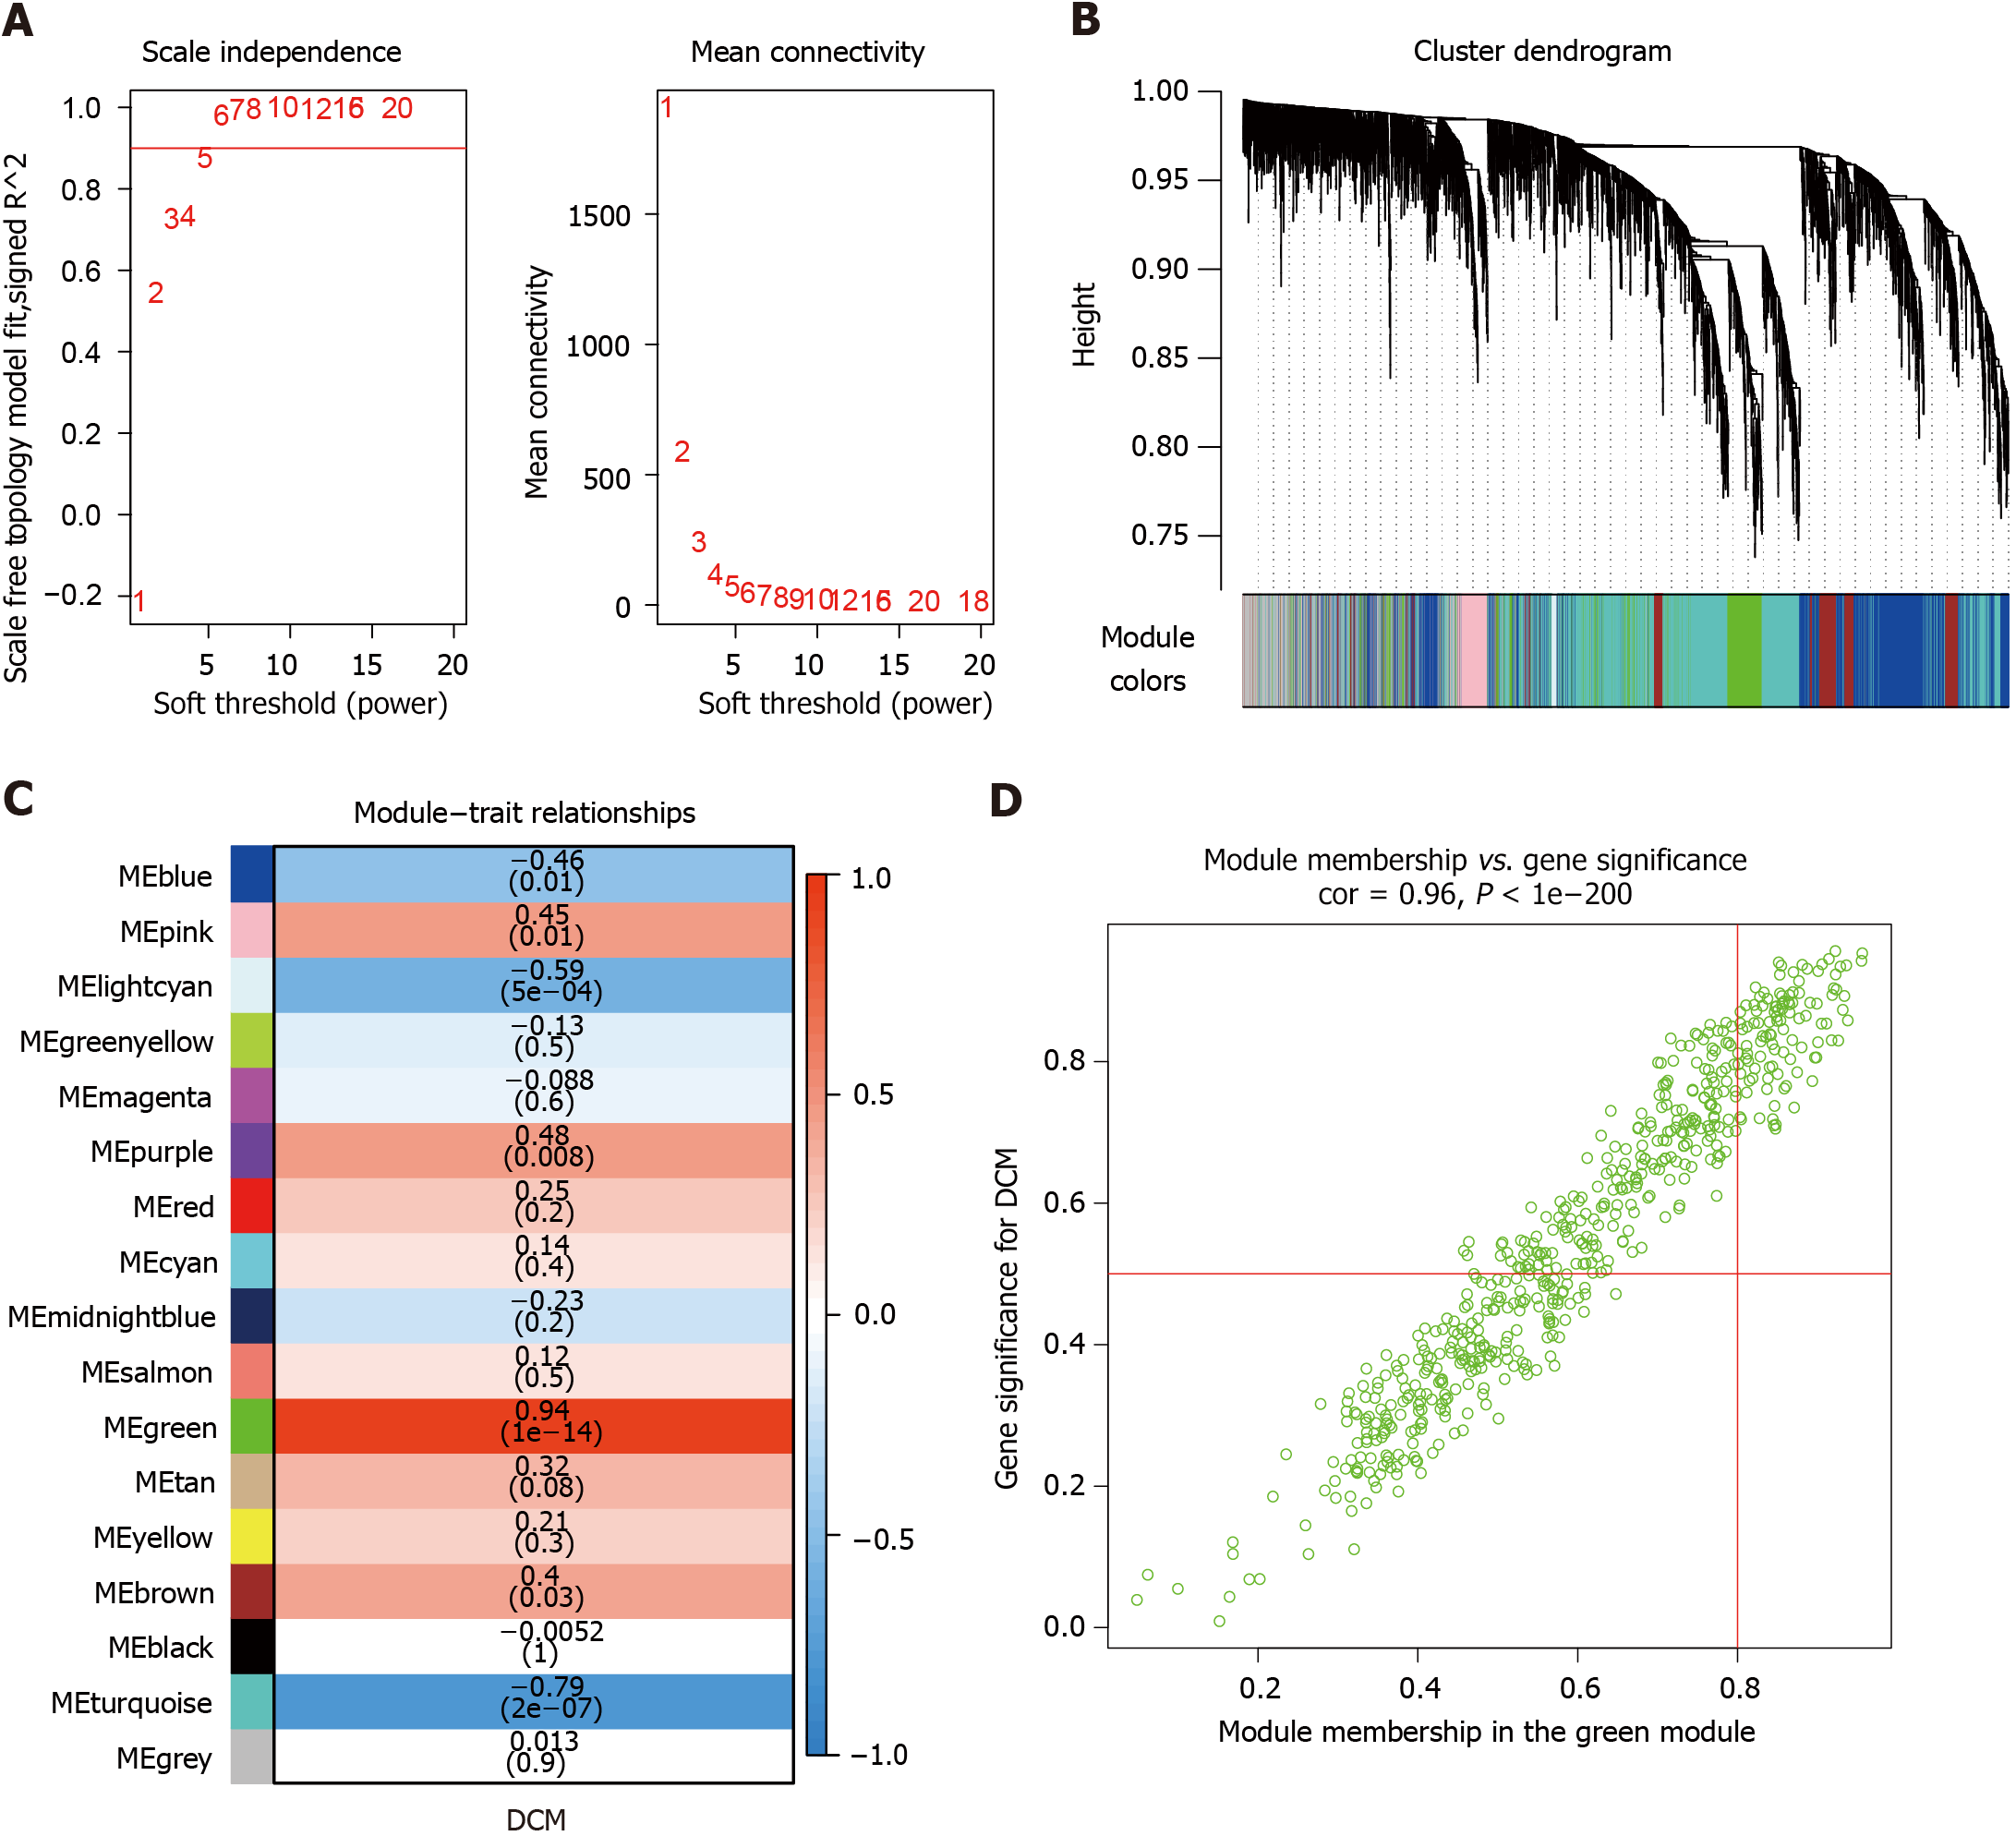
Figure 1 Weighted gene co-expression network analysis identified diabetic cardiomyopathy-related modules in the discovery cohort.
A: Soft thresholding power analysis enabled the determination of the scale-free fit index for network topology; B: Cluster dendrogram and module assignment for modules from weighted gene co-expression network analysis in diabetic cardiomyopathy (DCM); C: Correlations of module eigengenes and DCM; D: Correlations between gene significance and green module membership. DCM: Diabetic cardiomyopathy.
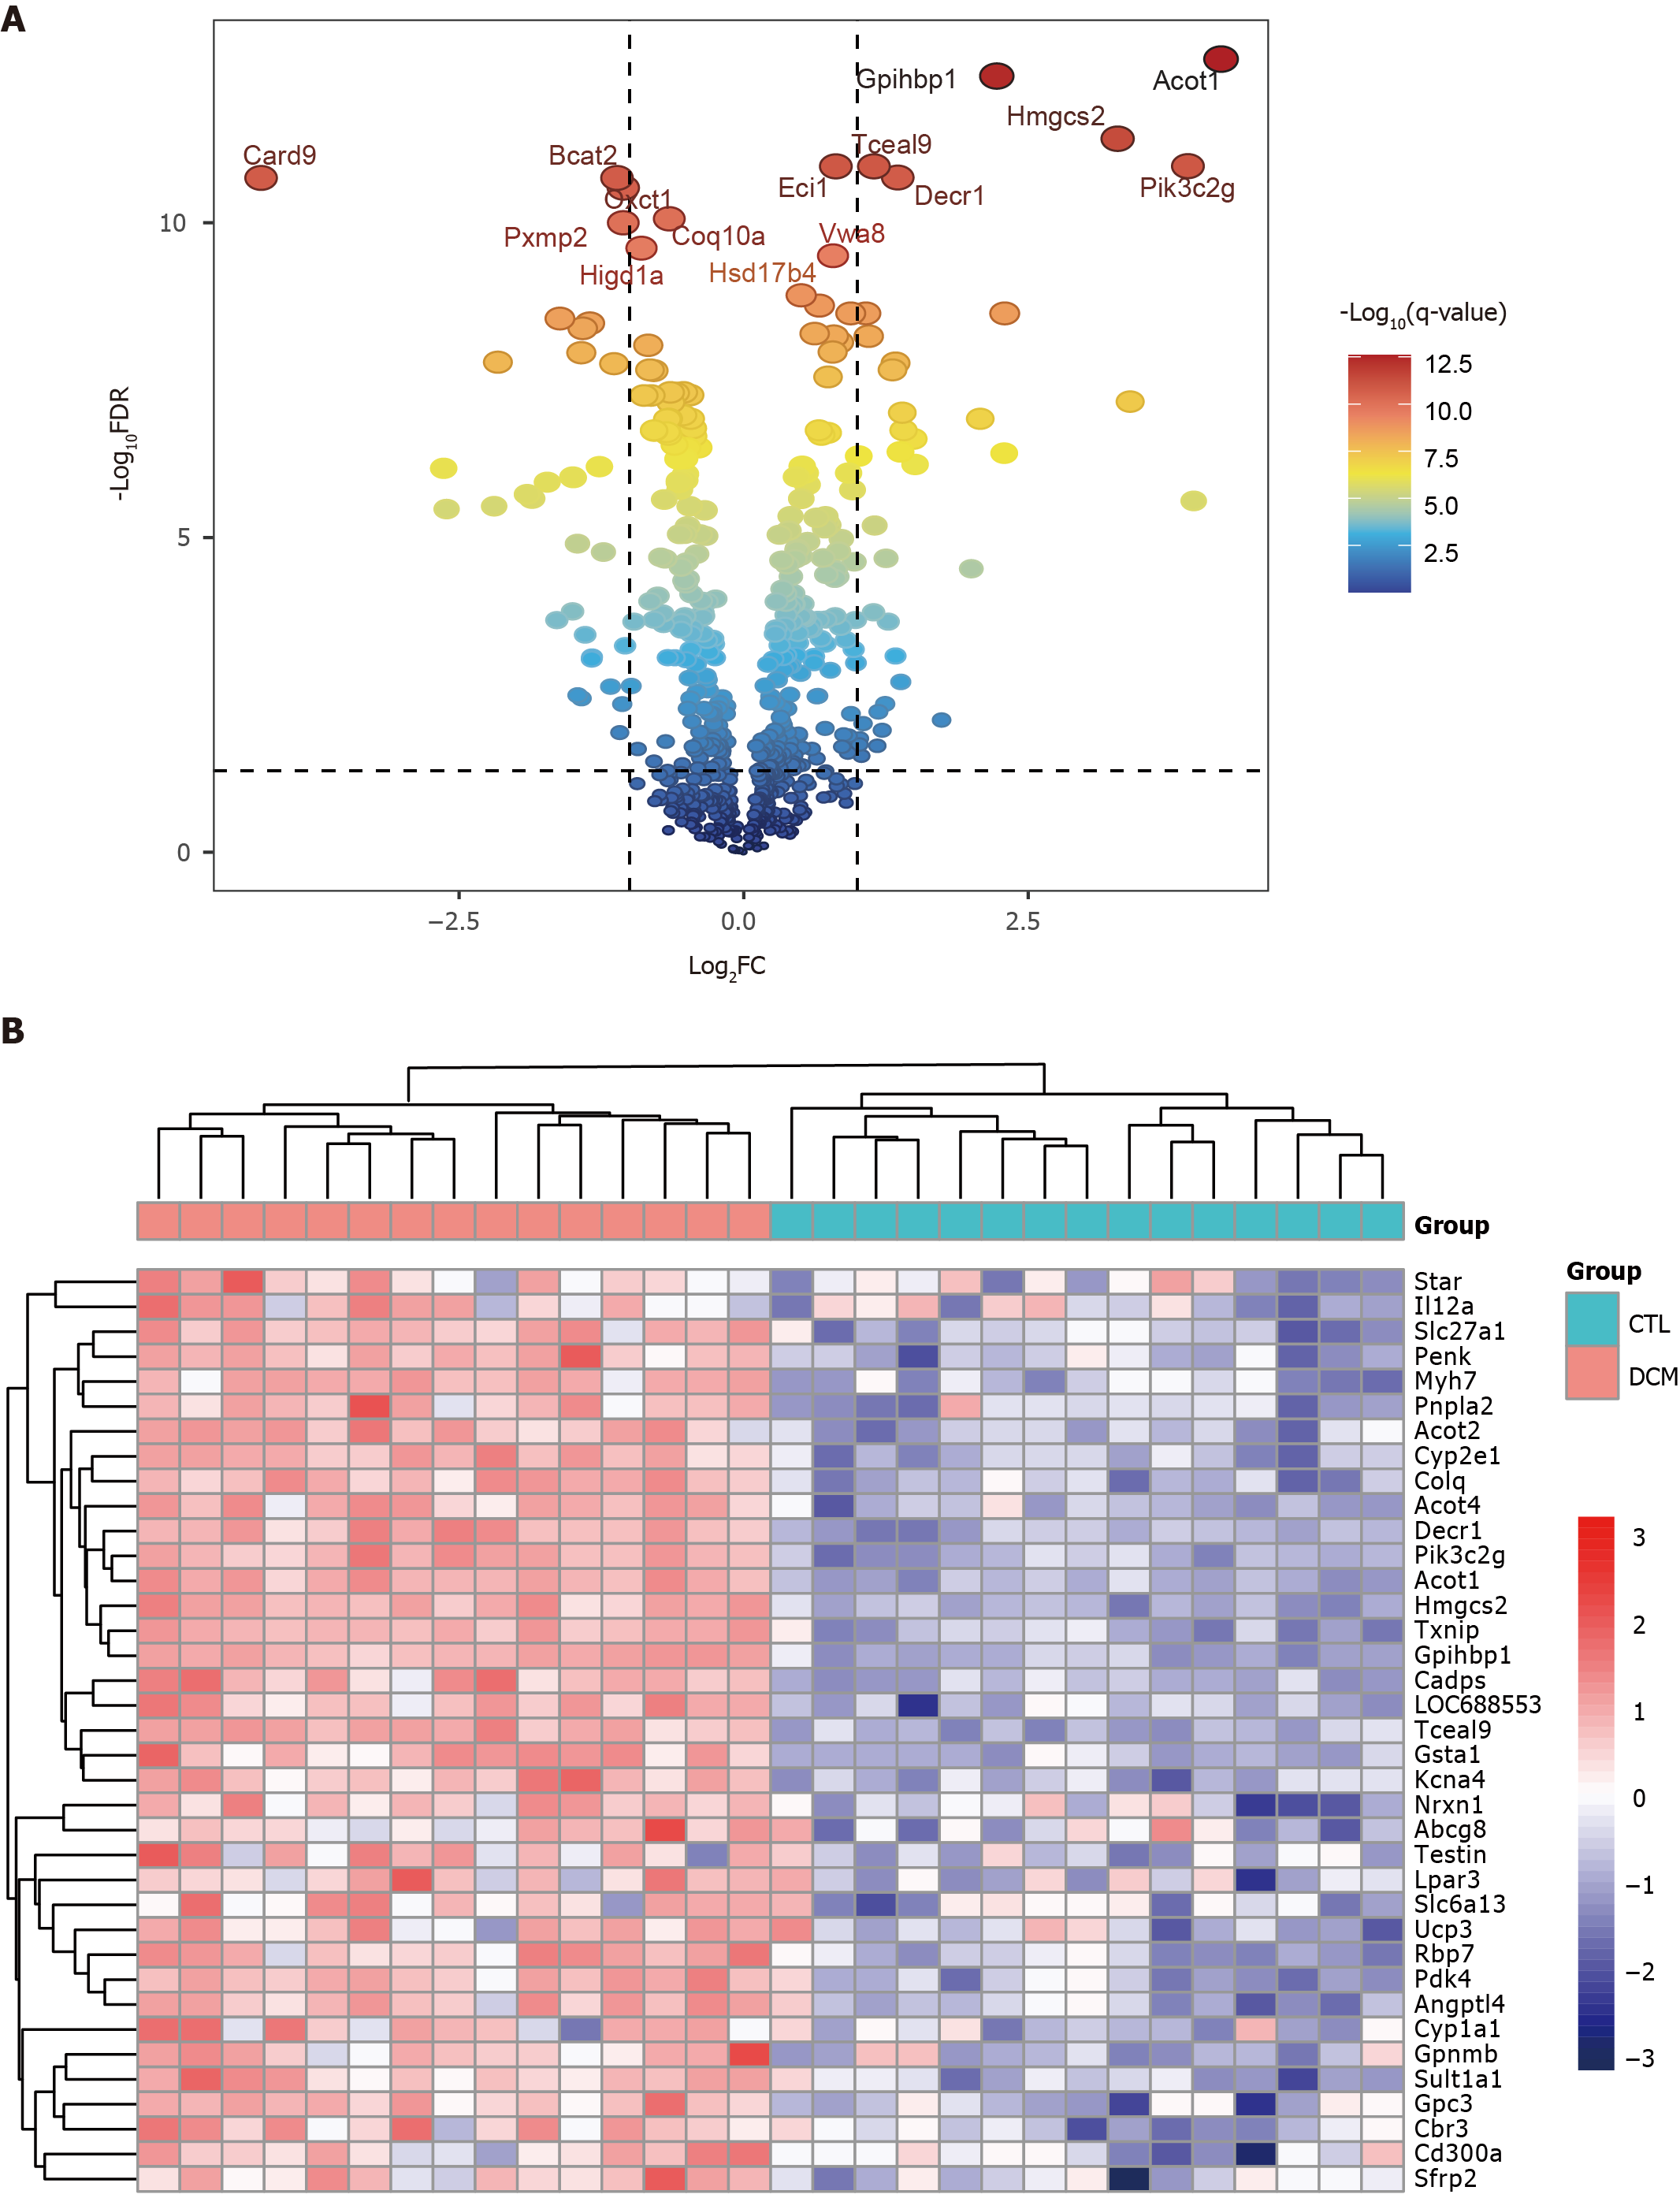
Figure 2 Identification of differentially expressed genes in the green module.
A: Volcano plot of differentially expressed genes (DEGs) in the green module; B: Heatmap of the 37 upregulated DEGs in the green module.
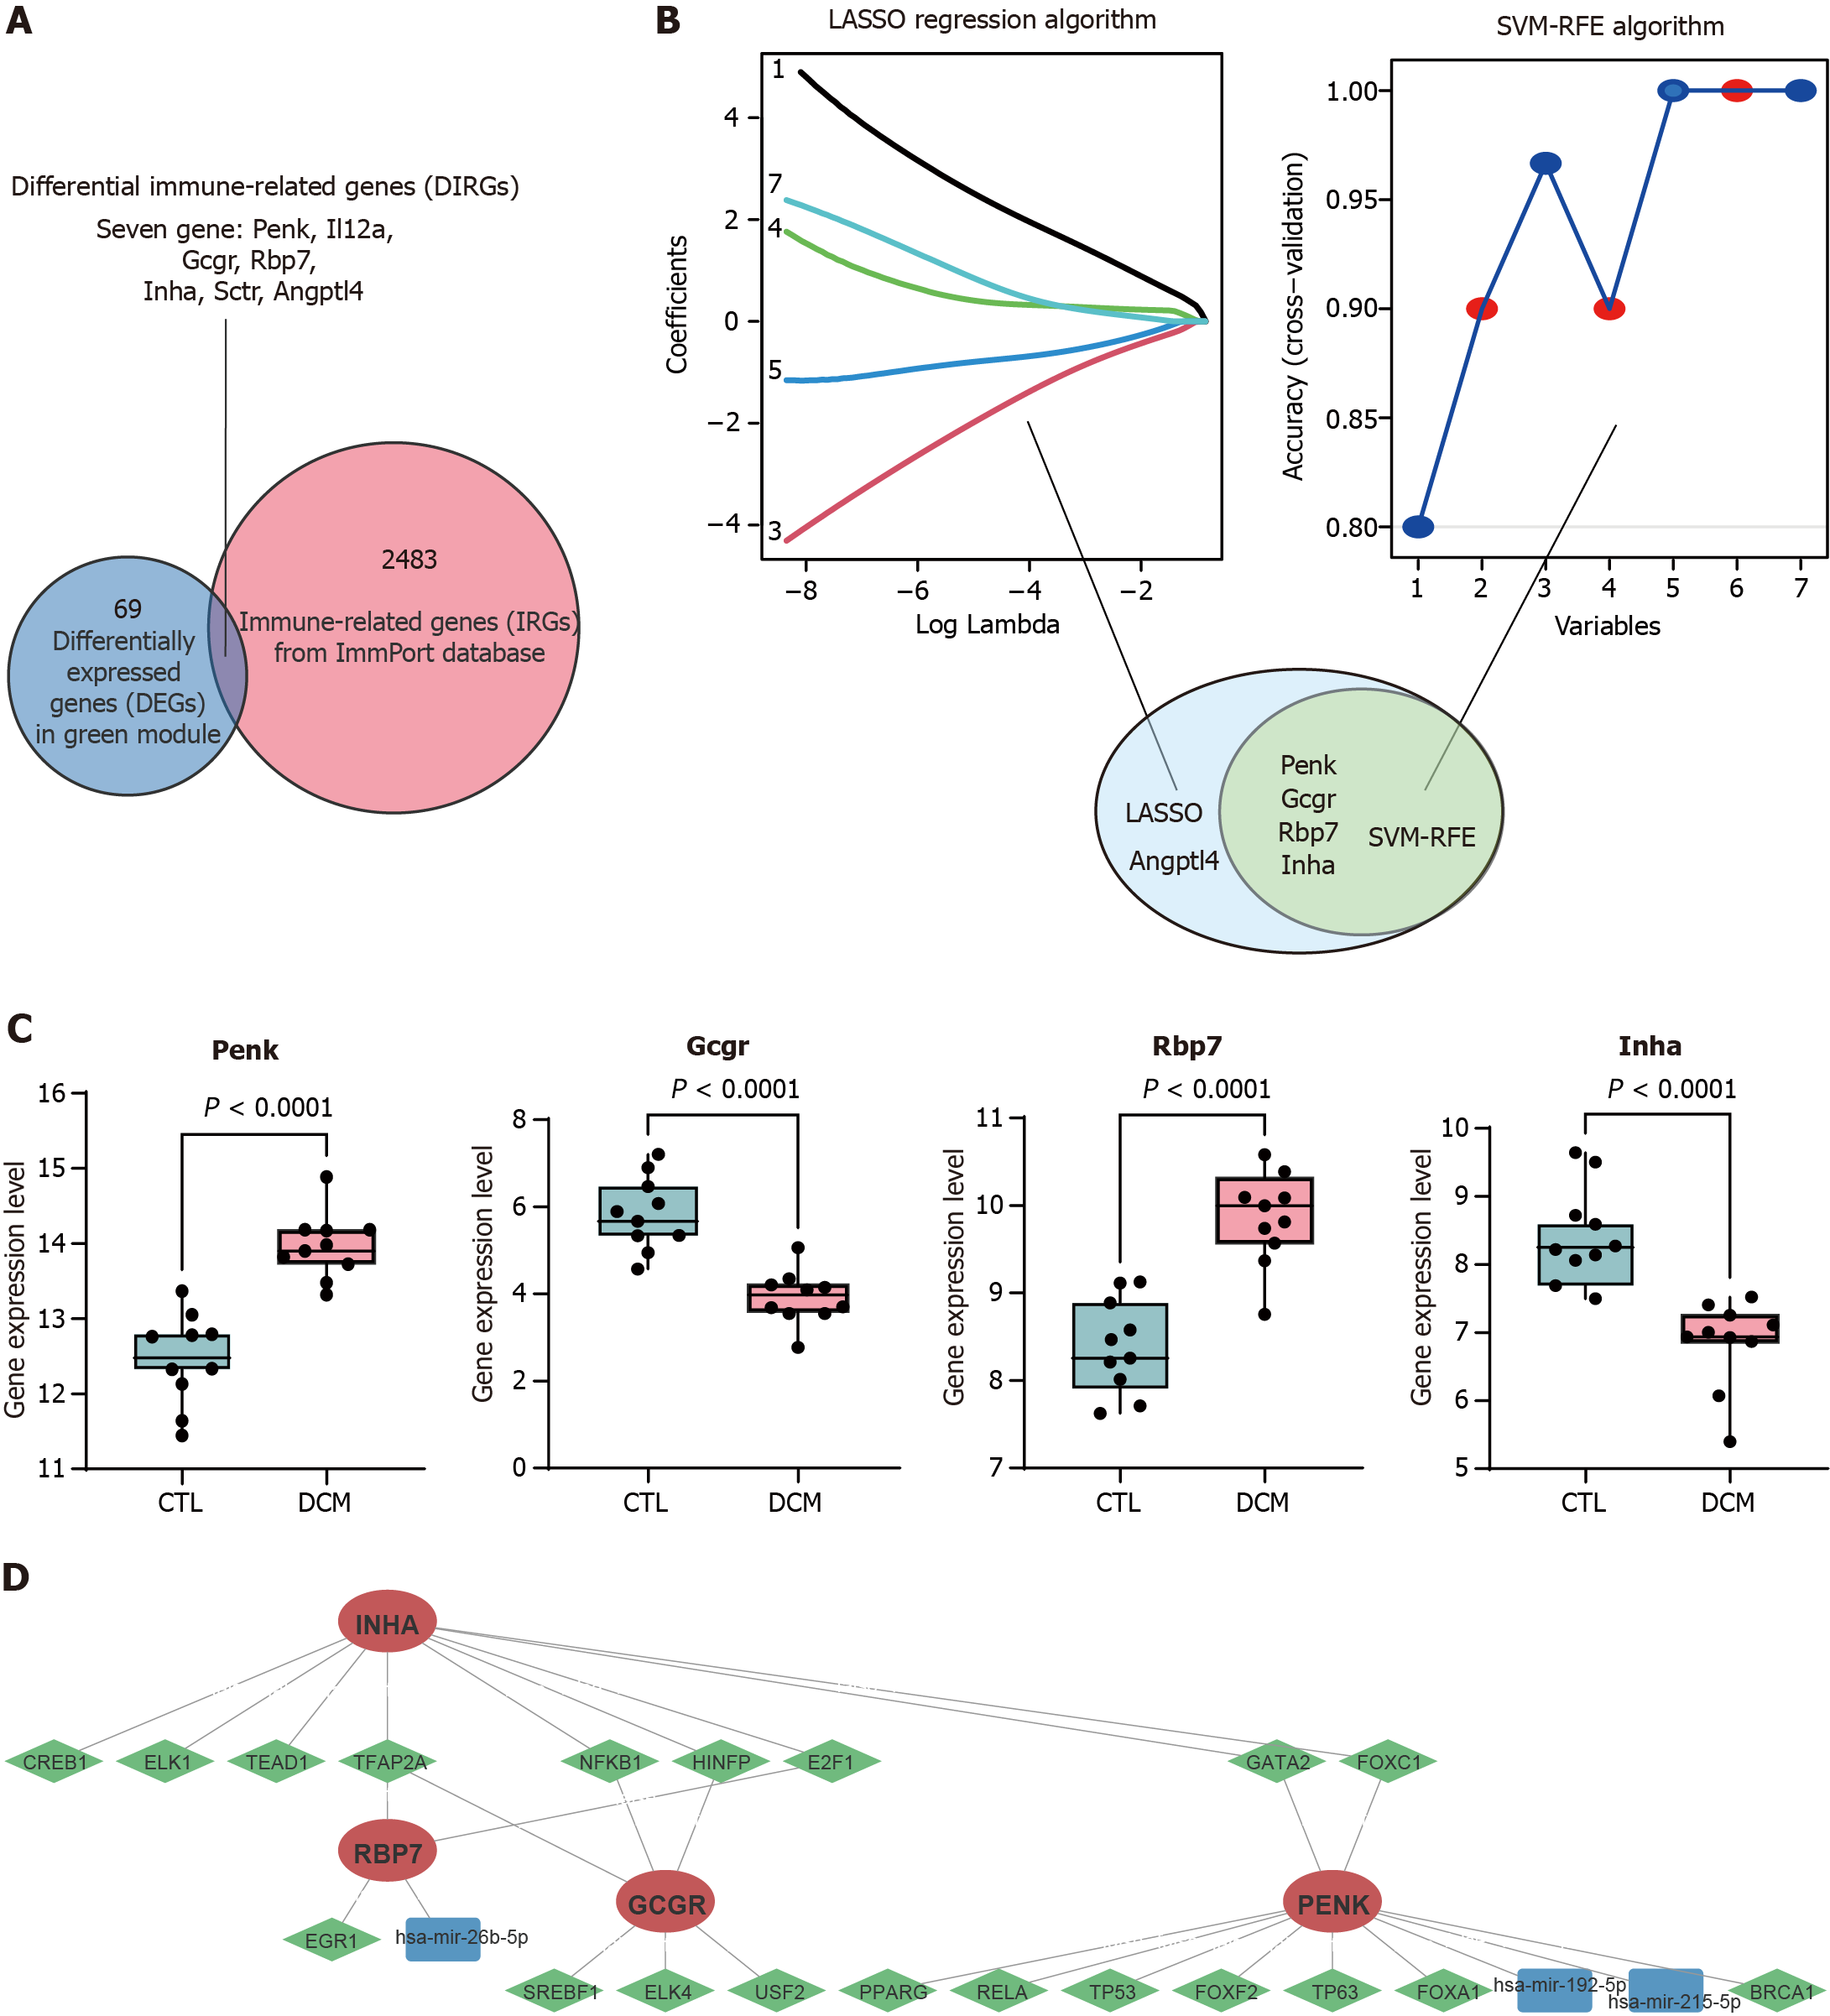
Figure 3 Identification of immune feature genes.
A: The differentially expressed genes in the green module were intersected with the list of immune-related genes from the ImmPort database to obtain 7 differential immune-related genes; B: Machine learning algorithm based on least absolute shrinkage and selection operator (LASSO) and support vector machine recursive feature elimination (SVM-RFE) to select immune feature genes (IFGs) of diabetic cardiomyopathy (DCM). LASSO identified and selected 5 genes, whereas SVM-RFE identified and selected 4 genes; C: Box plot comparing the expression levels of the four common IFGs identified by LASSO and SVM-RFE between DCM patients and control patients; D: Gene expression regulatory networks. Red indicates target genes, green indicates transcription factors, and blue indicates miRNAs. LASSO: Least absolute shrinkage and selection operator; SVM-RFE: Support vector machine recursive feature elimination; DCM: Diabetic cardiomyopathy; CTL: Control; Penk: Proenkephalin; Gcgr: Glucagon receptor; Rbp7: Retinol binding protein 7; Inha: Inhibin subunit alpha.
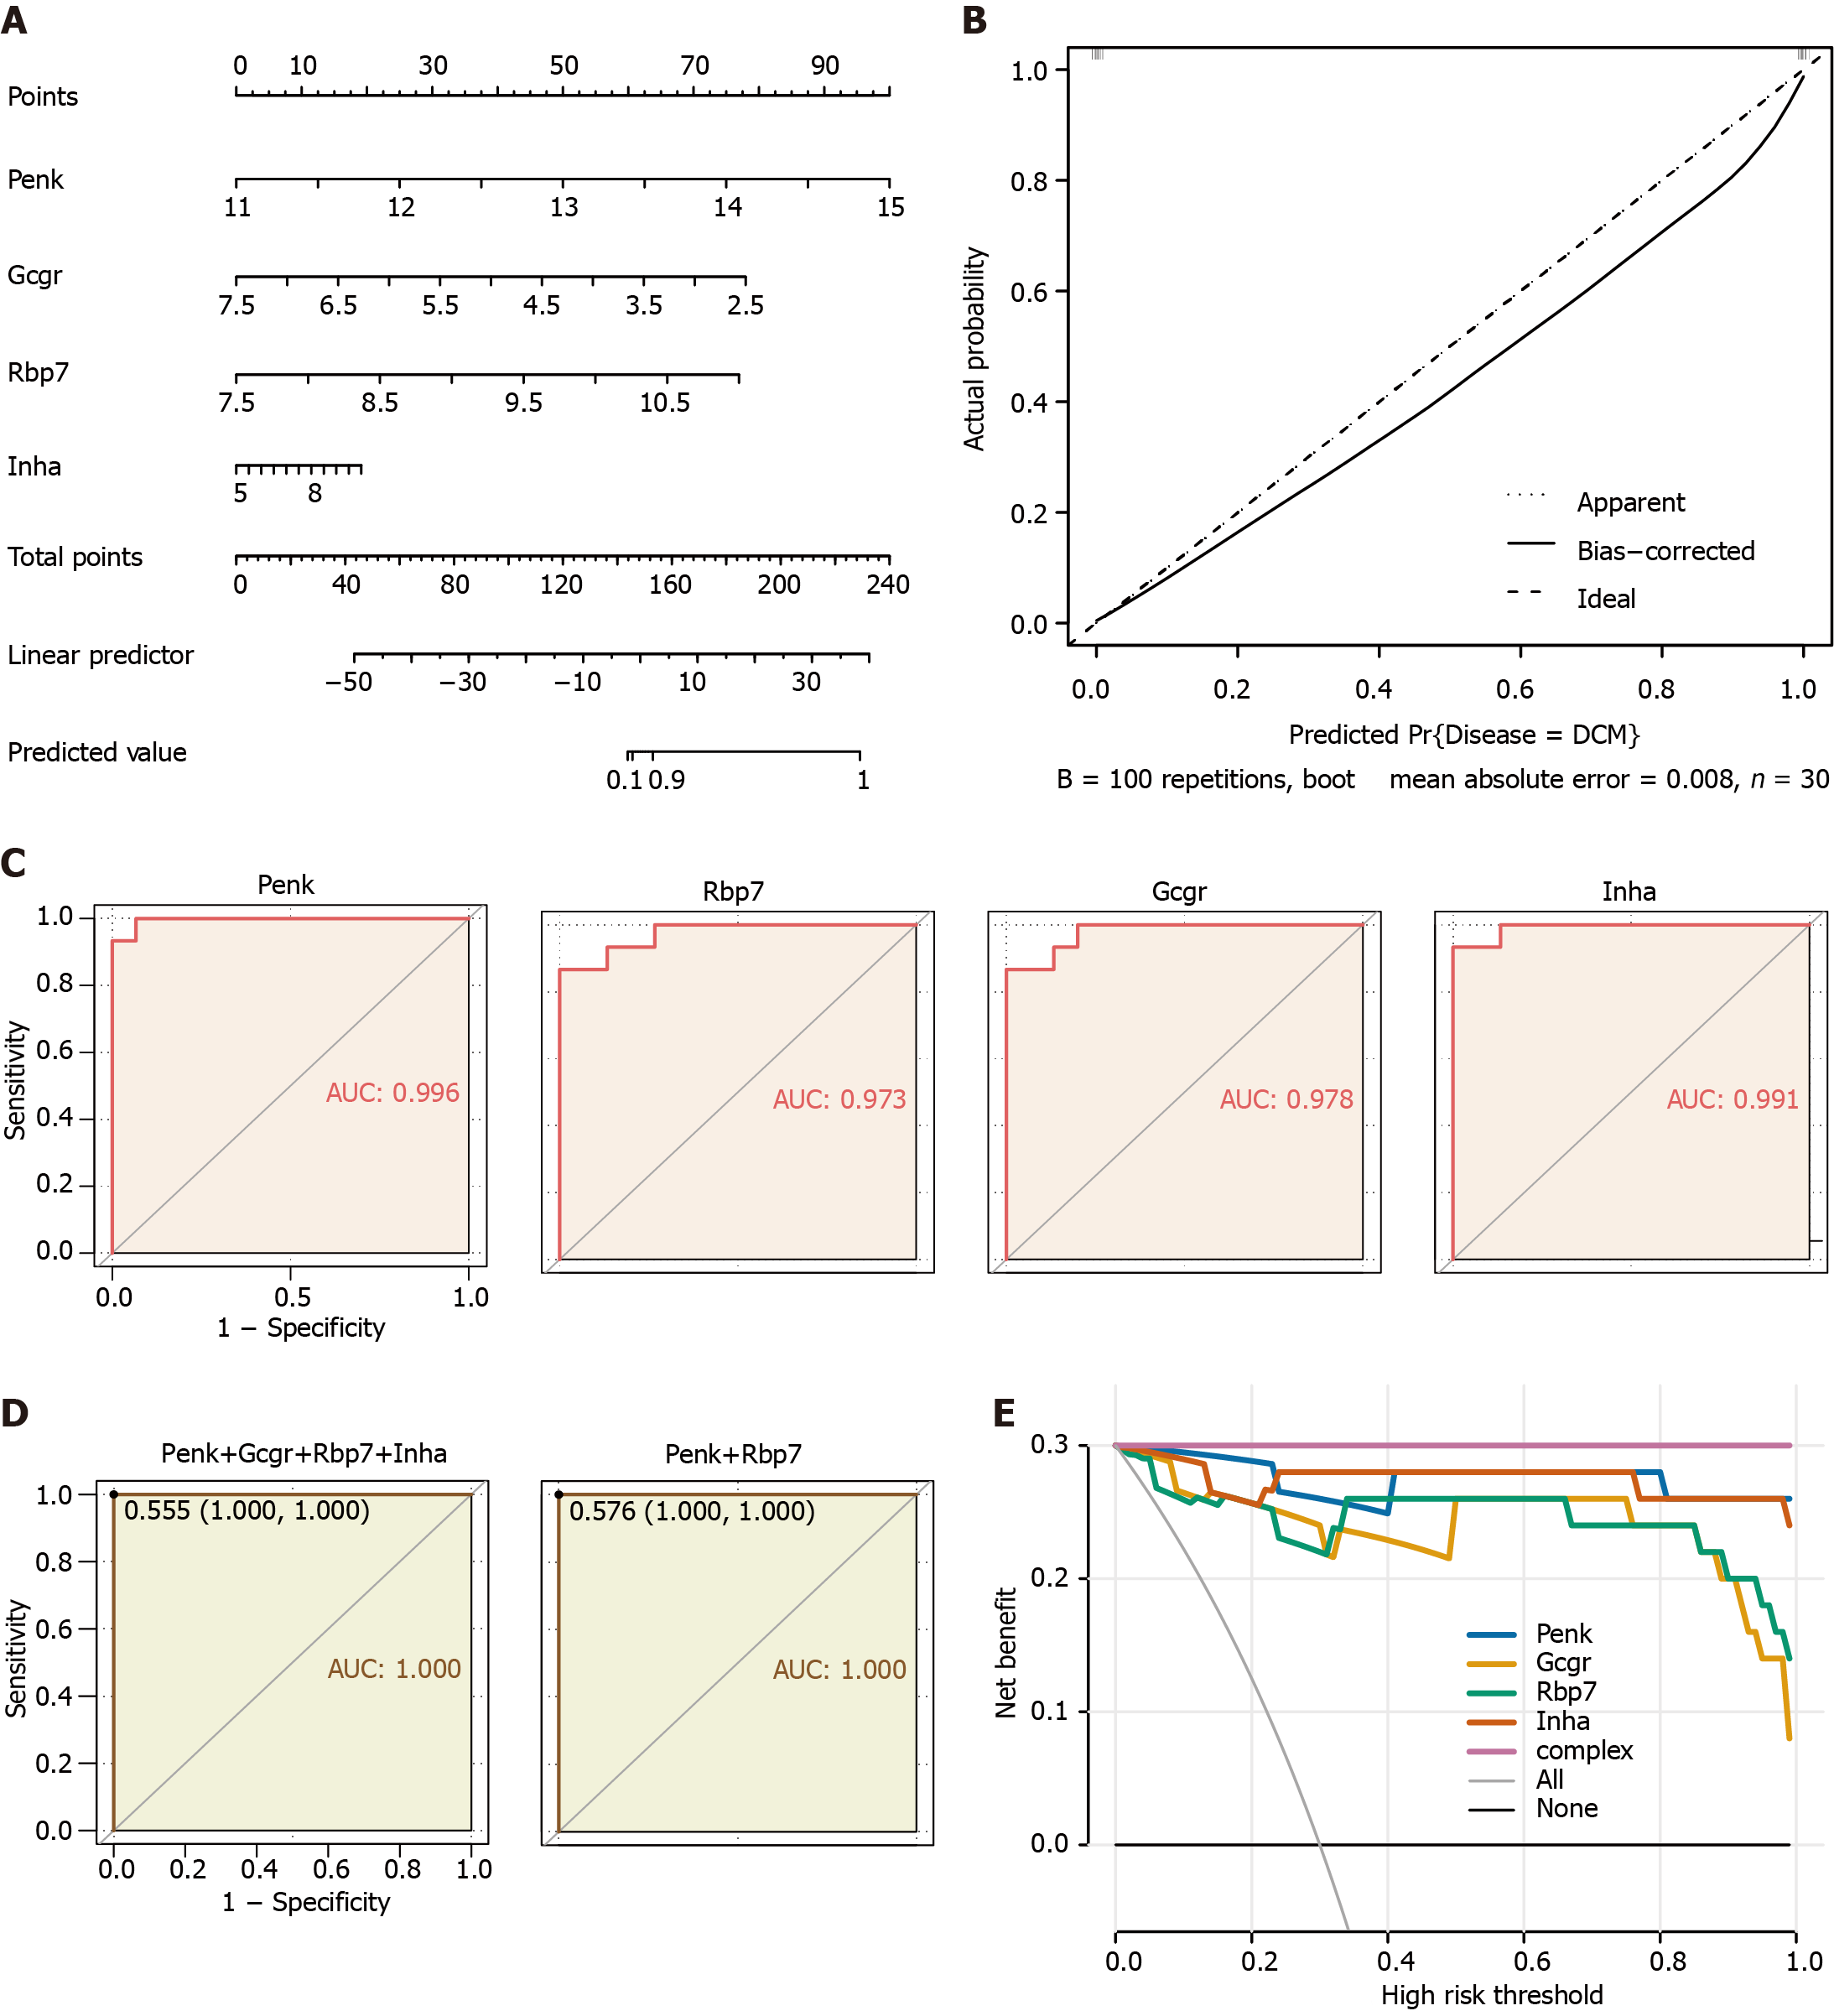
Figure 4 Clinical prediction models and diagnostic value for immune feature genes in the validation cohort.
A: Nomogram predicting disease risk by proenkephalin (Penk), glucagon receptor (Gcgr), retinol binding protein 7(Rbp7), and inhibin subunit alpha (Inha); B: Calibration curves visually assessing the risk nomogram model calibration, a key aspect of model validity; C: Receiver operating characteristic (ROC) analysis of immune feature genes in diabetic cardiomyopathy (DCM) patients; D: ROC analysis of the diagnostic value of multivariable (four feature genes, unregulated Penk and Rbp7) in DCM patients; E: Decision curve analysis model construction was performed using a simple logistic regression model with Penk, Gcgr, Rbp7, and Inha as independent predictors and DCM as the outcome; a complex model (complex) was constructed by combining the four genes as predictors. Penk: Proenkephalin; Gcgr: Glucagon receptor; Rbp7: Retinol binding protein 7; Inha: Inhibin subunit alpha.
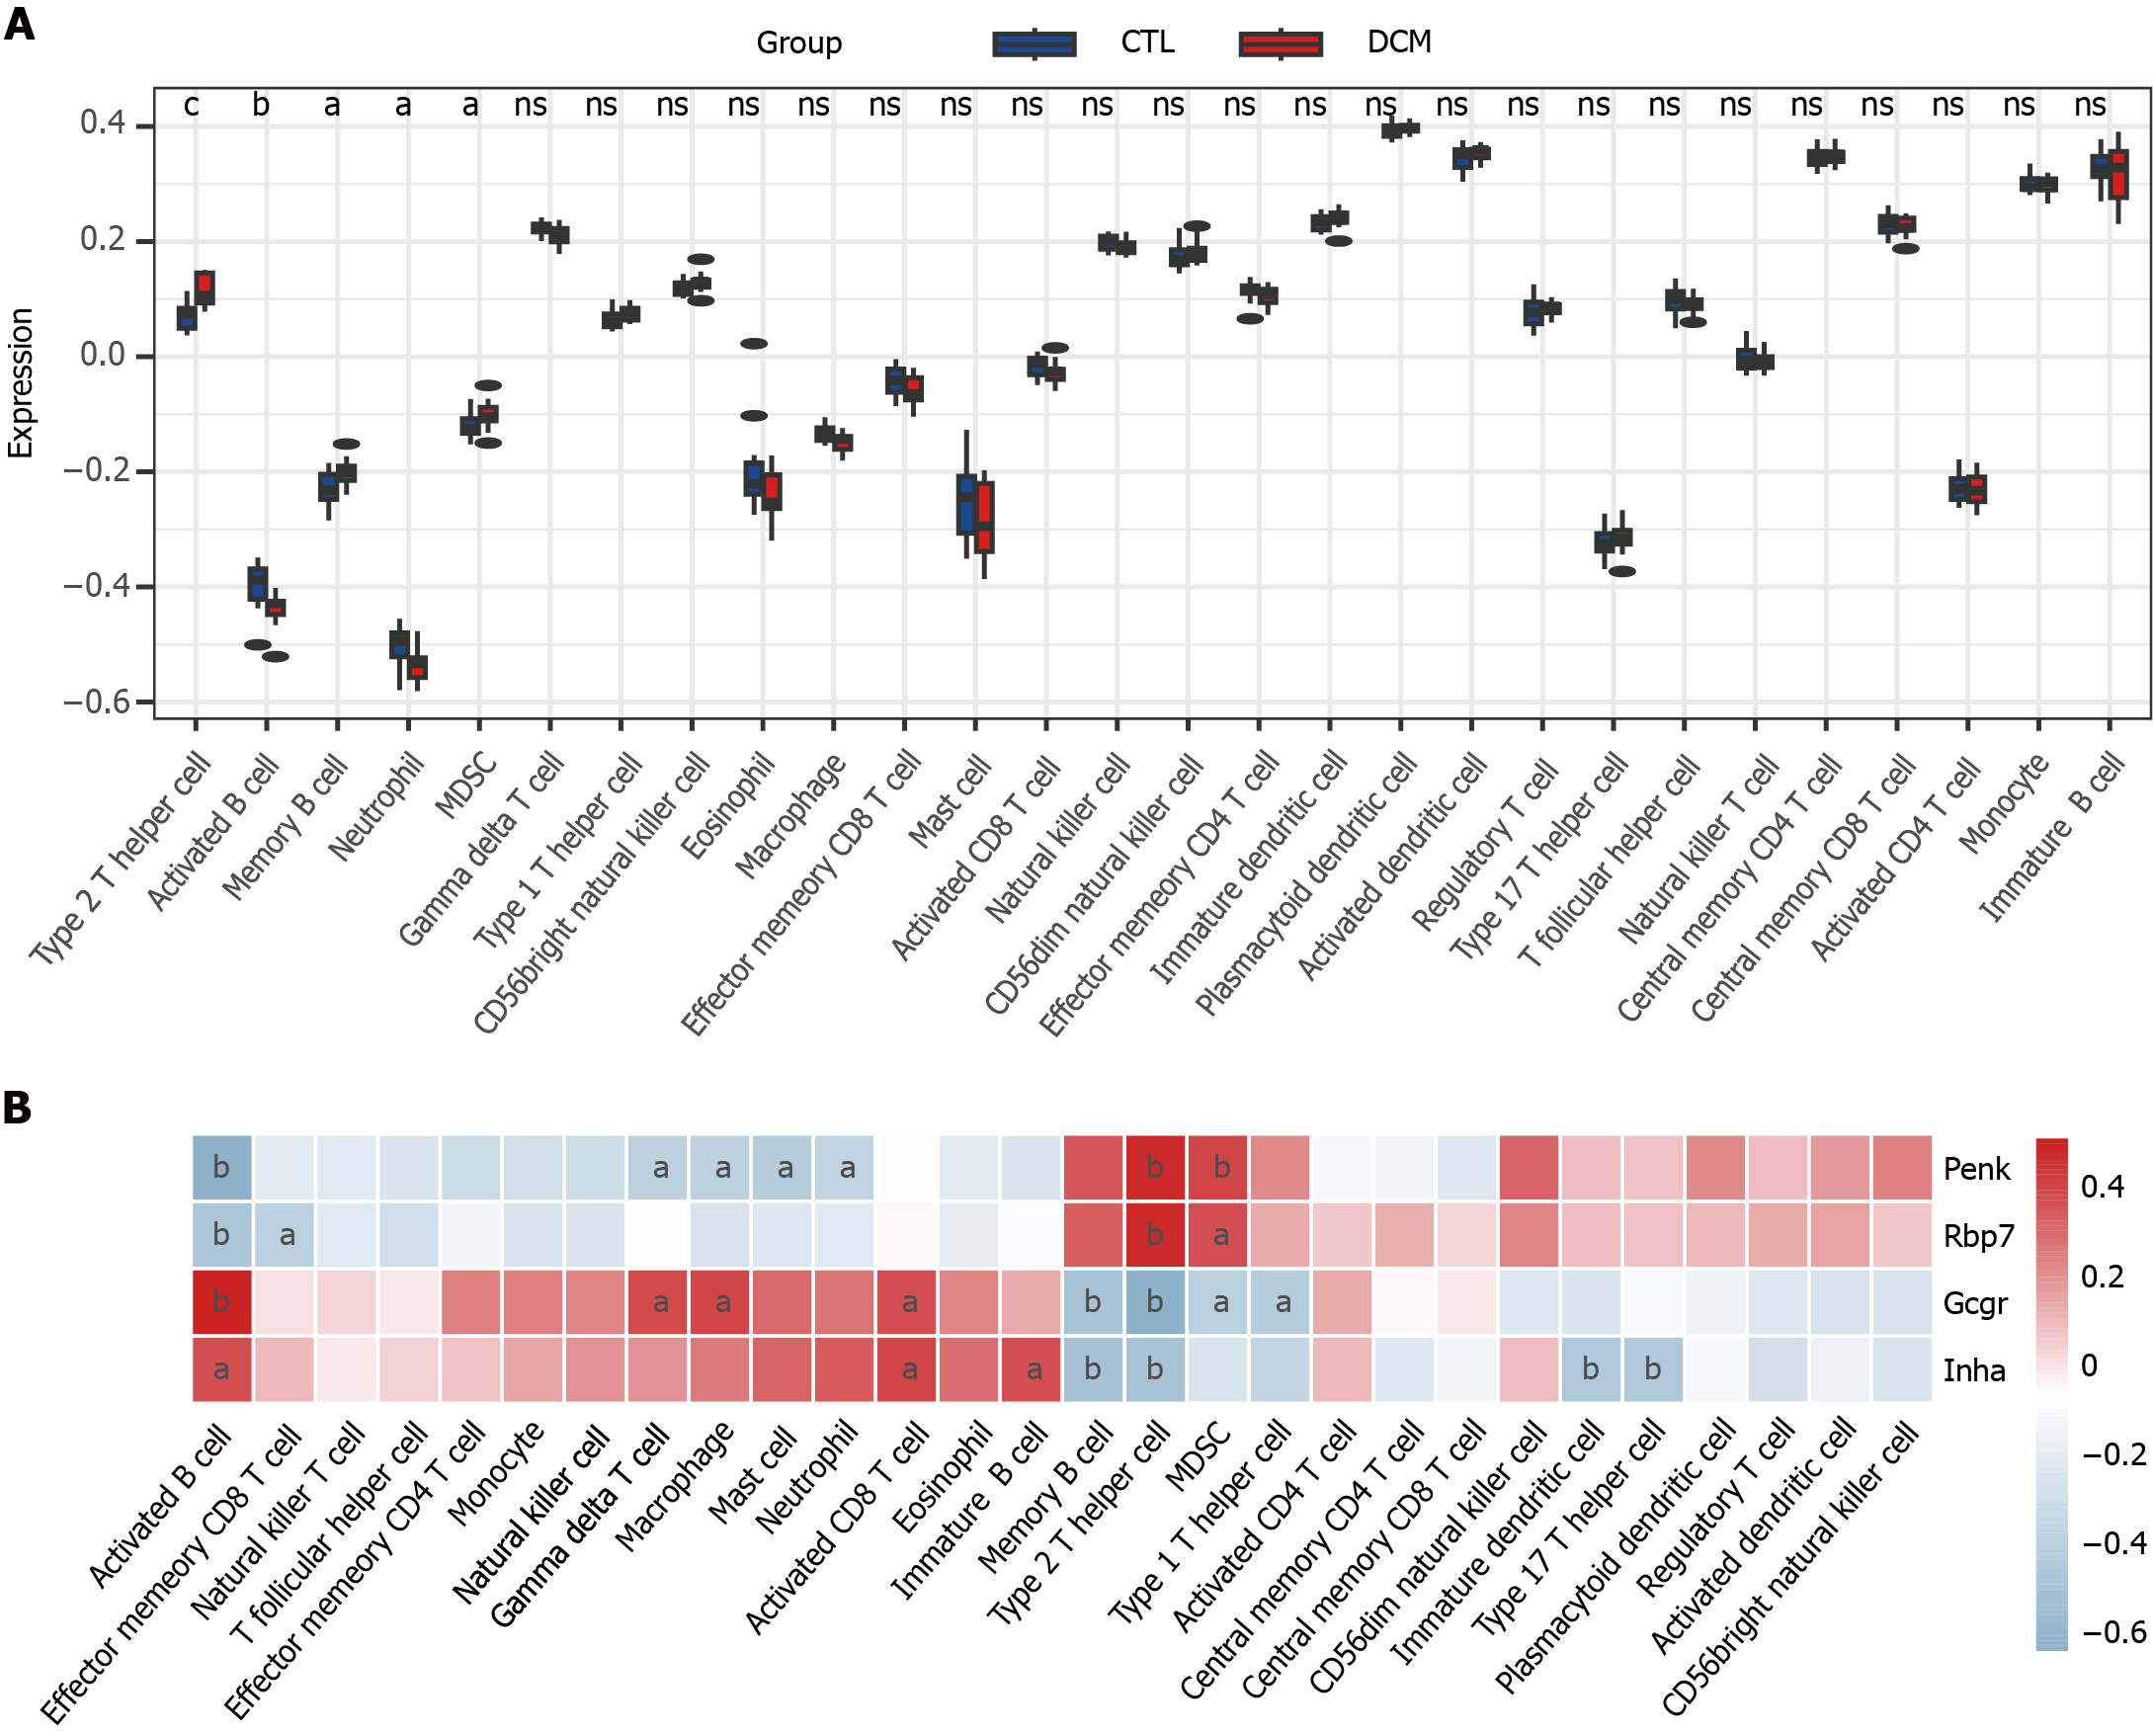
Figure 5 Single-sample gene set enrichment analysis was used to analyze immune cell infiltration in diabetic cardiomyopathy patients and its correlation with feature genes.
A: Box plot of immune scores for diabetic cardiomyopathy patients and control; B: Heatmap of the correlation between feature genes and immune cell infiltration. aP < 0.05, bP < 0.01 cP < 0.001. DCM: Diabetic cardiomyopathy; CTL: Control; Penk: Proenkephalin; Gcgr: Glucagon receptor; Rbp7: Retinol binding protein 7; Inha: Inhibin subunit alpha.
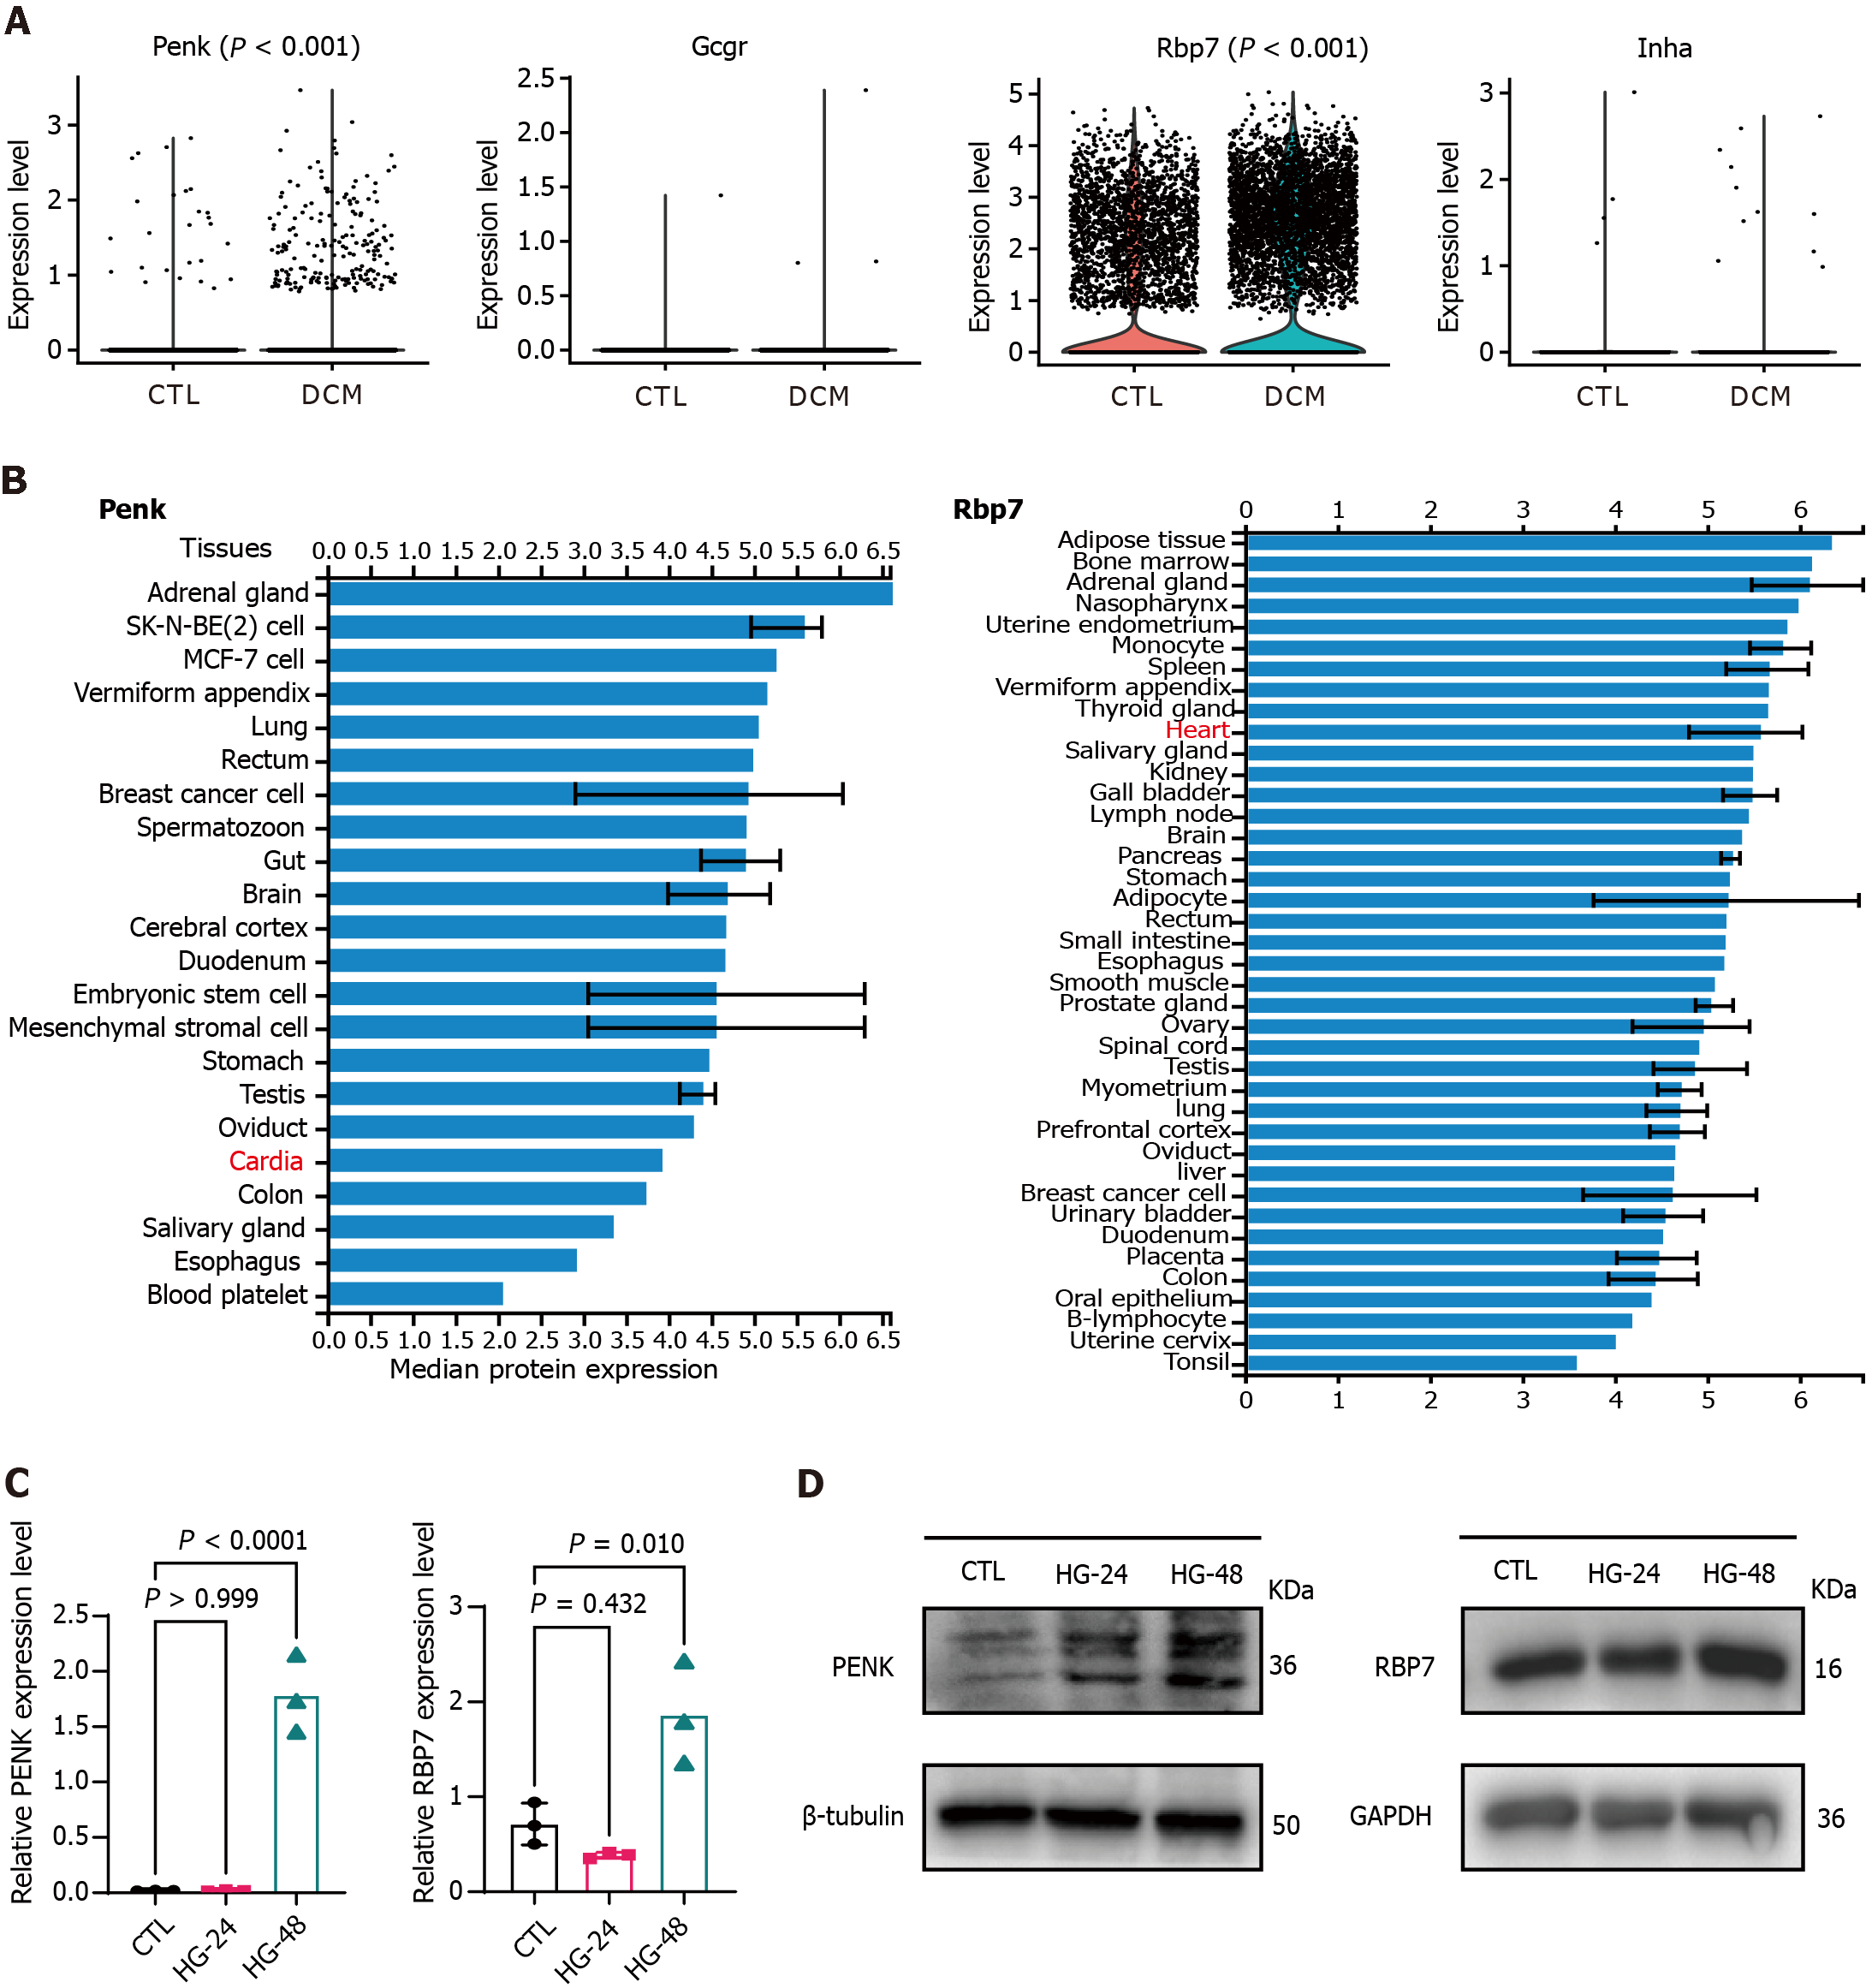
Figure 6 Expression levels of immune feature genes according to single-cell RNA sequencing data.
A: Violin plots comparing the expression levels of immune feature genes in control (CTL) (5833 cells) and diabetic cardiomyopathy (6760 cells) samples, with each point representing one cell; B: Tissue-specific expression of proenkephalin and retinol binding protein 7 in the ProteomicsDB repository; C: Relative gene expression levels in AC16 cells were examined using real time-quantitative polymerase chain reaction. Each point represents one independent biological experiment. HG-24 and HG-48, AC16 cells exposed to high glucose for 24 hours and 48 hours, respectively; D: Western blot showing the protein expression levels of the two genes. β-Tubulin and GAPDH were used as endogenous CTLs. DCM: Diabetic cardiomyopathy; CTL: Control; Penk: Proenkephalin; Gcgr: Glucagon receptor; Rbp7: Retinol binding protein 7; Inha: Inhibin subunit alpha.
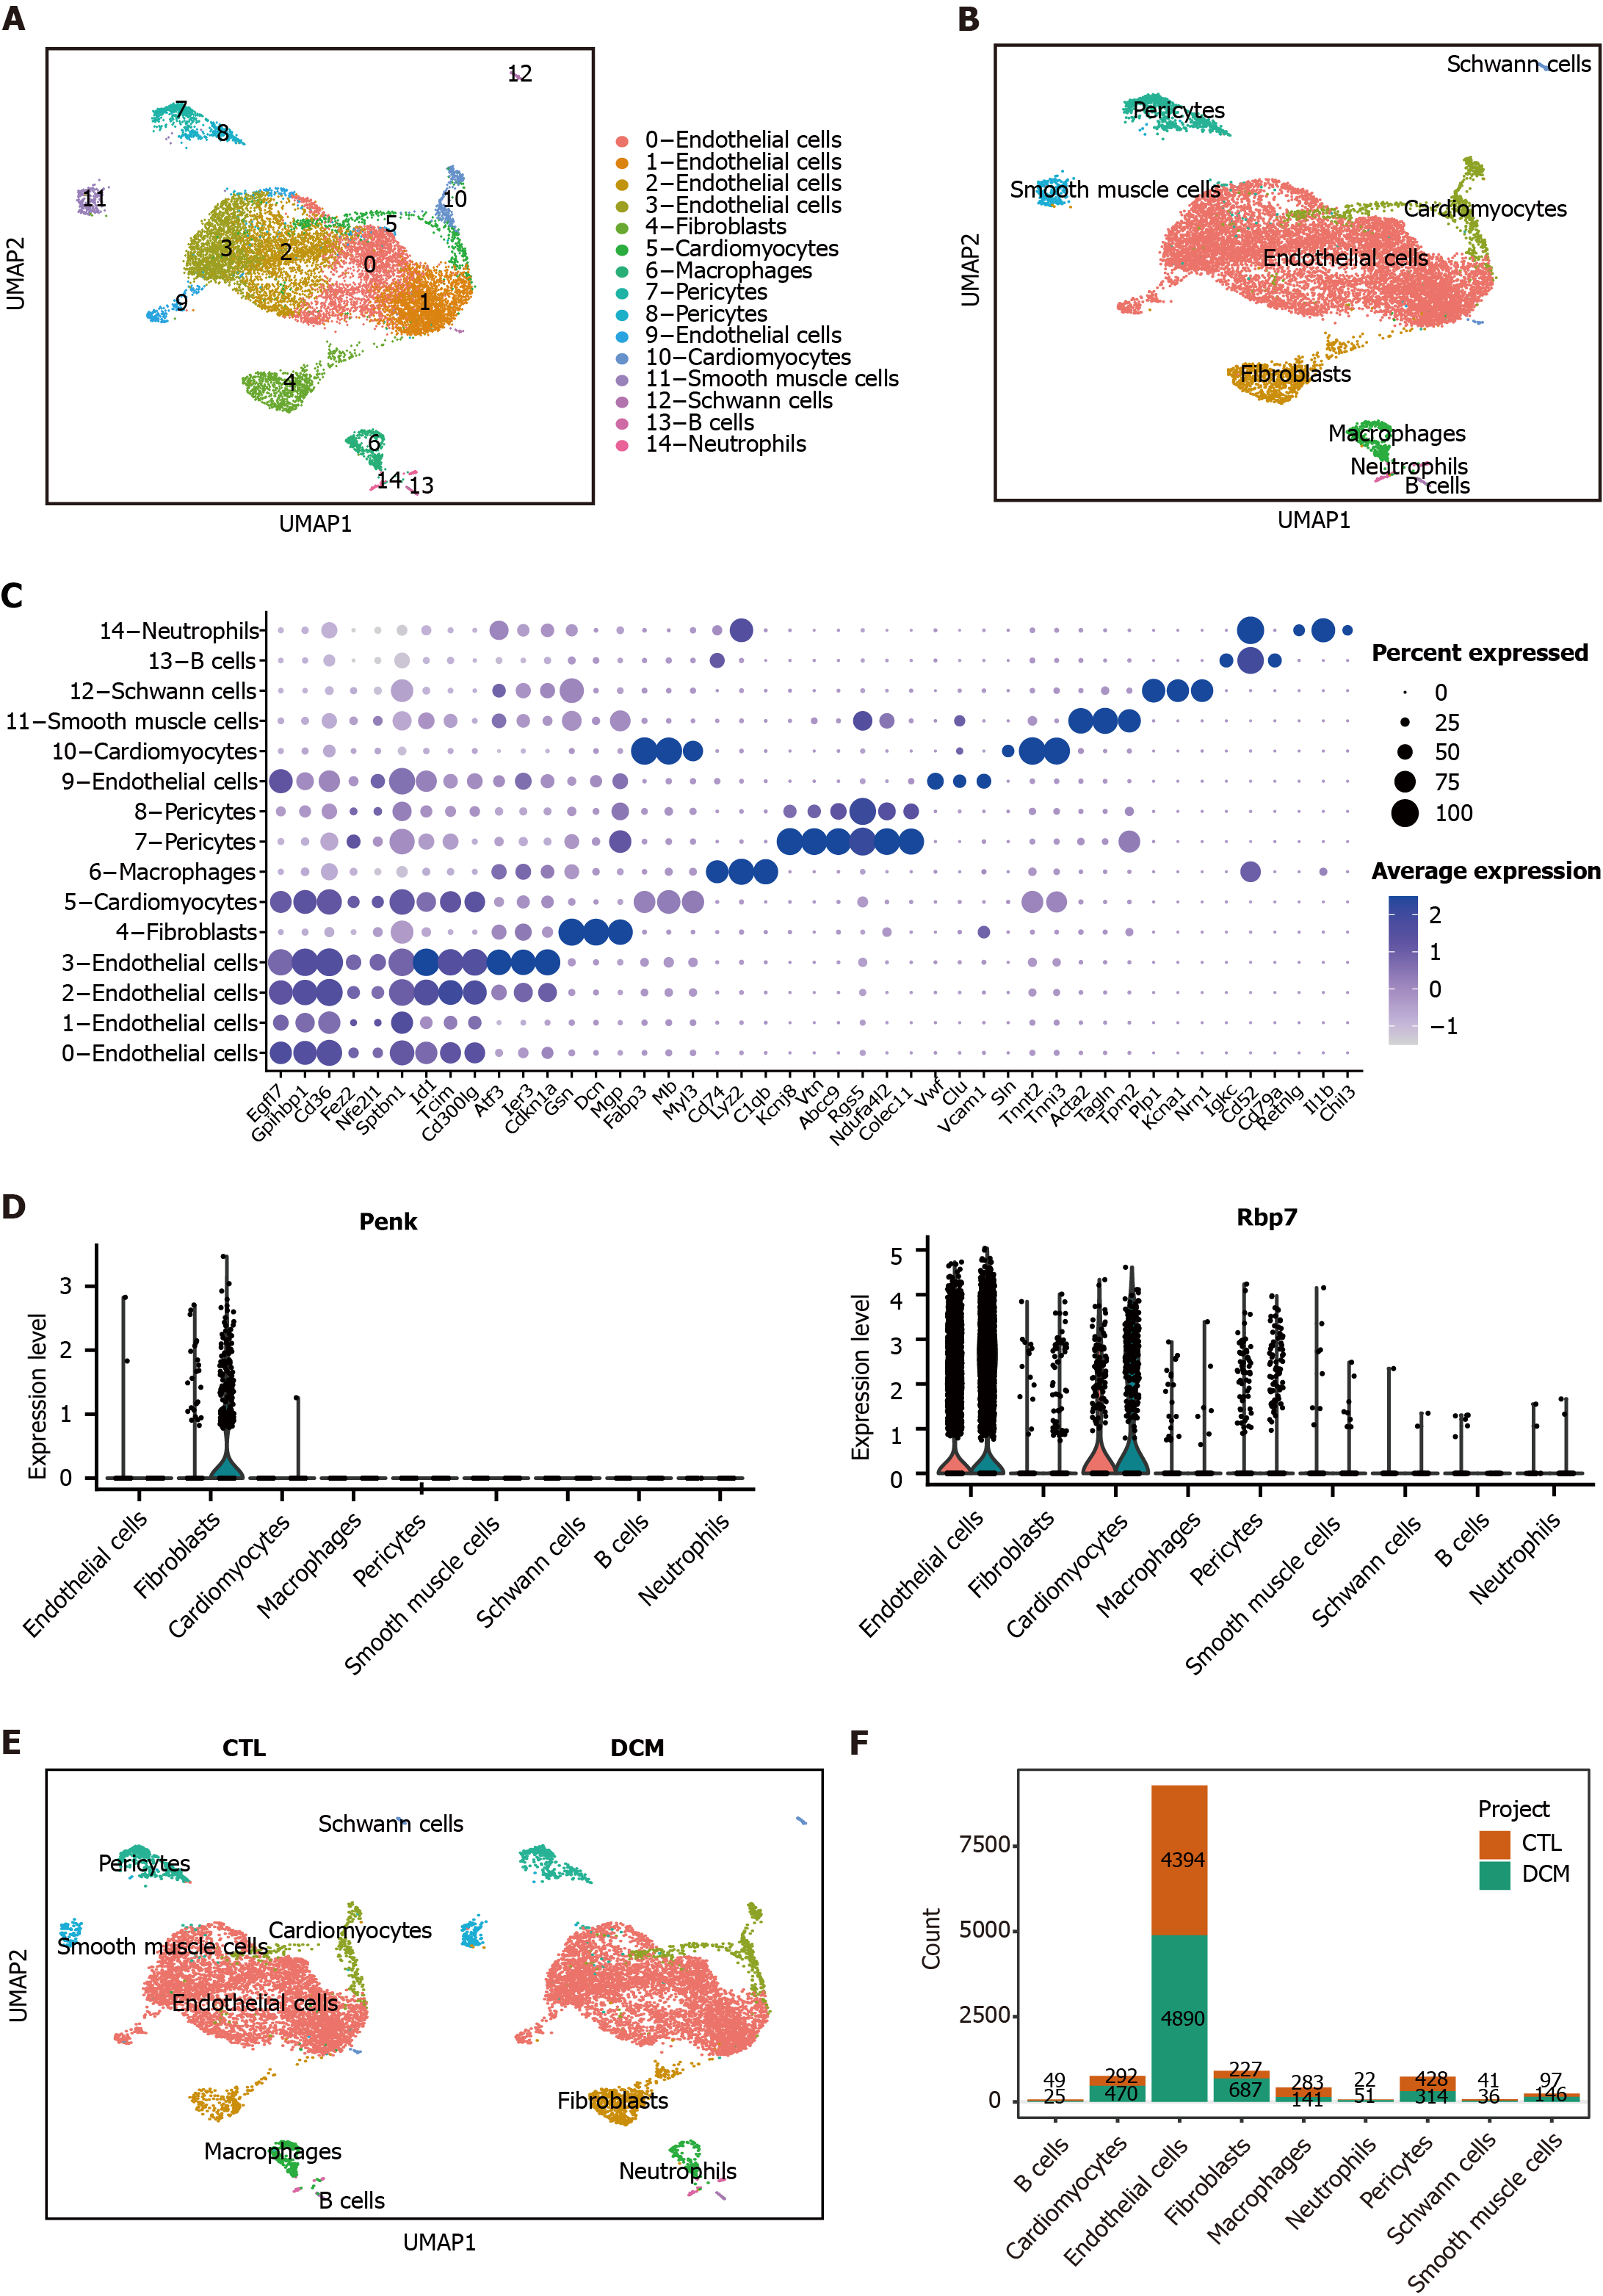
Figure 7 Analysis of the expression patterns of immune feature genes and cell-cell communication.
A: UMAP dimensionality reduction embedding was performed on the integrated dataset of single-cell RNA sequencing data from all profiled samples (n = 12593 cells). The embedding is color-coded by inferred cluster identity and annotated with manual cell type labels; B: Clusters with similar marker gene expression modules were merged and clustered into the same cell type; C: Dot plot showing cell-specific markers; D: Violin plots showing statistically significant feature gene (proenkephalin and retinol binding protein 7) expression values for each cell type, grouped by the donor of origin [control (CTL) and diabetic cardiomyopathy (DCM)]; E: UMAP for cell clusters grouped by the donor of origin (CTL or DCM); F: Bar chart representing the cell counts of different cell types in the two groups. DCM: Diabetic cardiomyopathy; CTL: Control; Penk: Proenkephalin; Gcgr: Glucagon receptor; Rbp7: Retinol binding protein 7; Inha: Inhibin subunit alpha.
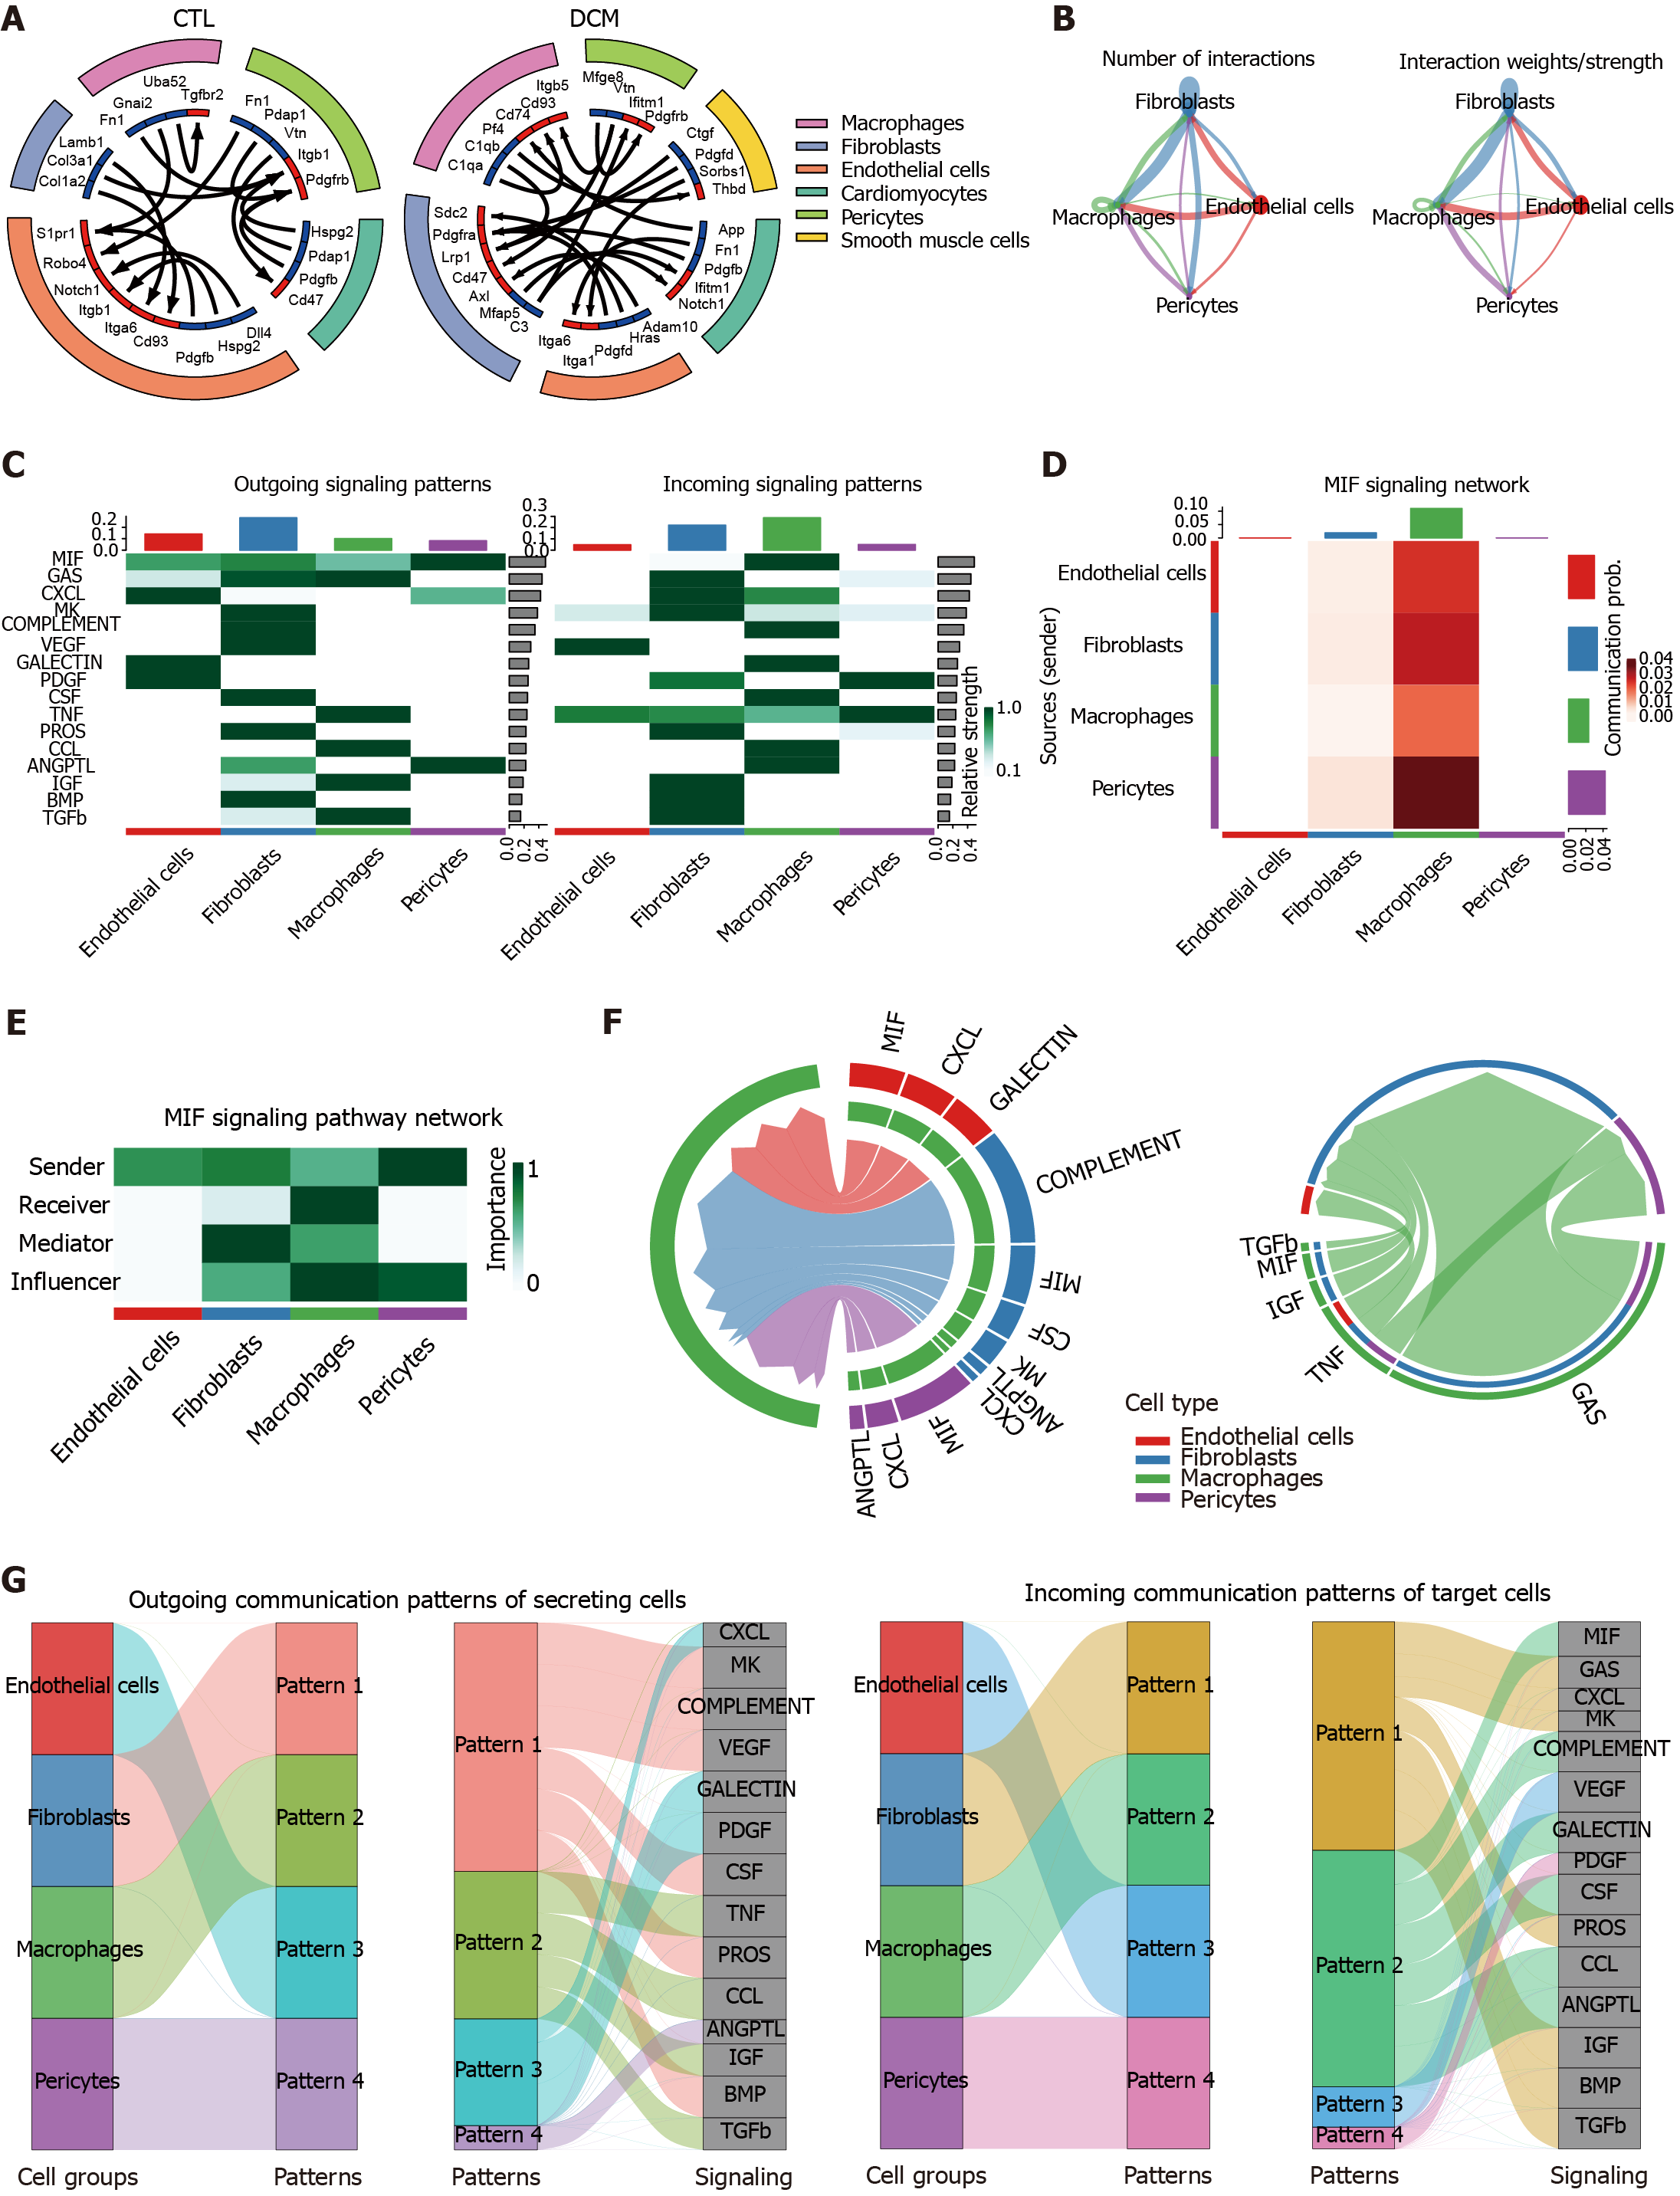
Figure 8 Analysis of cell-cell signaling pathway networks and communication patterns in diabetic cardiomyopathy.
A: The circle plot shows the cell-cell communication analysis of the control (CTL) and diabetic cardiomyopathy (DCM) groups, with the ligand color in blue and the receptor color in red; B: The circle plot depicting the aggregated cell-cell communication network in DCM illustrates either the number of interactions or the total interaction strength (weights) between any two cell groups; C: A signaling role analysis was conducted on the aggregated cell-cell communication network across all signaling pathways to identify the signals contributing the most to outgoing or incoming signaling in specific cell groups. This was visualized using a combined heatmap, where each row corresponds to a signaling pathway; D: Heatmap visualizing the cell-cell communication network specifically based on the migration inhibitory factor (MIF) signaling pathways. The intensity of the color in each cell reflects the strength of the interaction between the corresponding cell groups. Each row corresponds to a sender cell group, and each column represents a receiver cell group; E: Heatmap displaying the computed centrality scores (importance) of cell groups in the intercellular communication network (dominant senders, receivers, mediators, and influencers) inferred from the MIF signaling pathway; F: Chord diagram illustrating the significant signaling pathways between selected source cell groups and target cell groups (source: Endothelial cells, fibroblasts, and pericytes, target: Macrophages) (left panel) in the intercellular communication network. The chords connecting the source and target arcs represent the significant signaling pathways between the corresponding cell groups; G: River plot to visualize associations of latent patterns (outgoing and incoming) with cell groups and signaling pathways. The specific communication patterns are defined by different colors in the network. MIF: Migration inhibitory factor; DCM: Diabetic cardiomyopathy; CTL: Control.
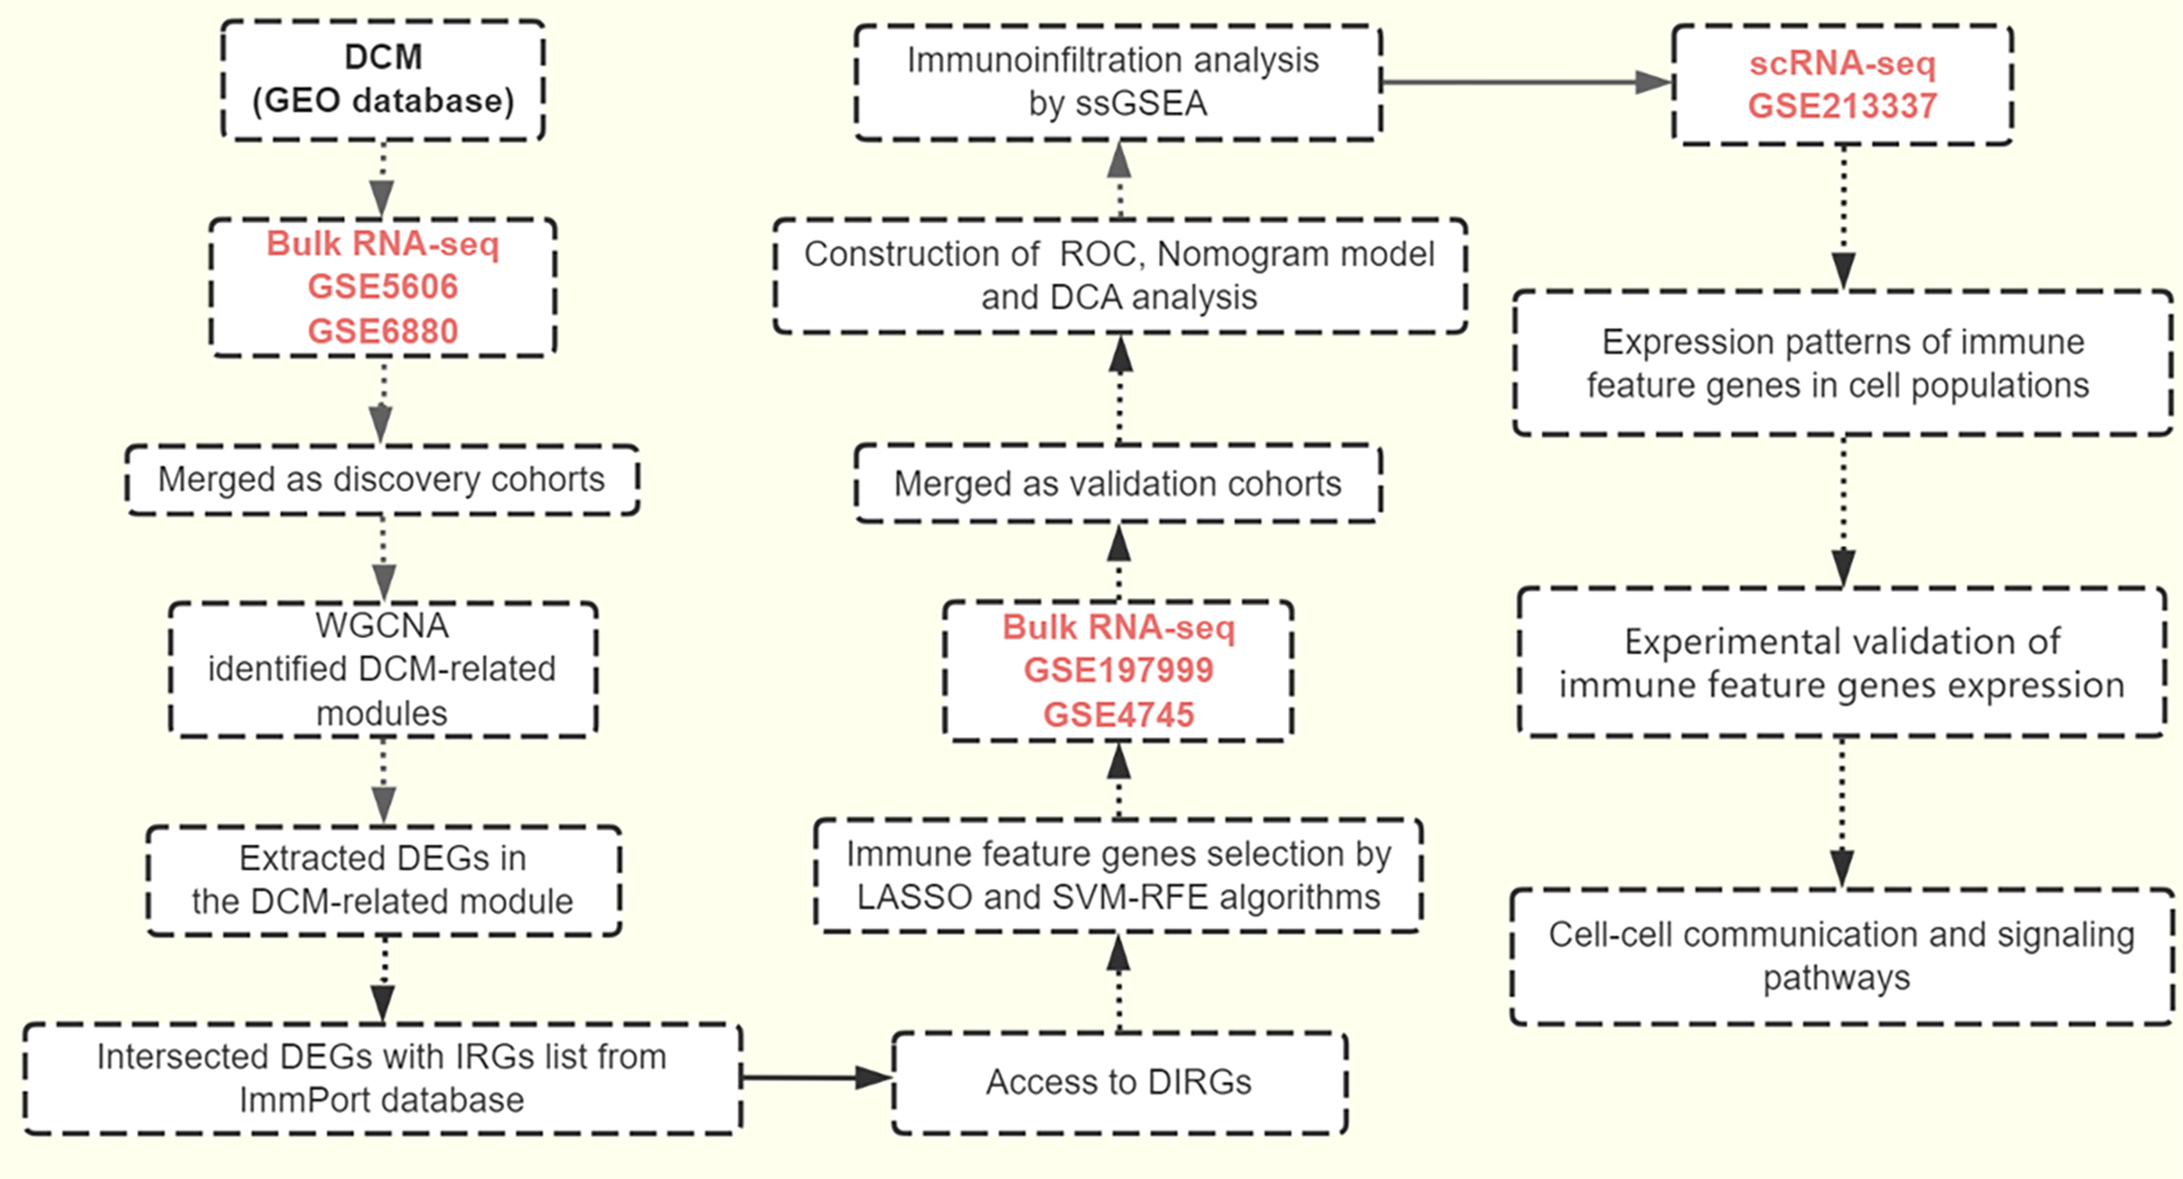
Figure 9 The workflow of this study.
DCM: Diabetic cardiomyopathy; RNA-seq: RNA sequencing; WGCNA: Weighted gene co-expression network analysis; DEGs: differentially expressed genes; IRGs: Immune-related genes; DIRGs: Differential immune-related genes; LASSO: Least absolute shrinkage and selection operator; SVM-RFE: Support vector machine recursive feature elimination; ROC: Receiver operating characteristic; DCA: Decision curve analysis; ssGSEA: Single-sample gene set enrichment analysis.
- Citation: Zheng ZQ, Cai DH, Song YF. Identification of immune feature genes and intercellular profiles in diabetic cardiomyopathy. World J Diabetes 2024; 15(10): 2093-2110
- URL: https://www.wjgnet.com/1948-9358/full/v15/i10/2093.htm
- DOI: https://dx.doi.org/10.4239/wjd.v15.i10.2093


