Copyright
©The Author(s) 2024.
World J Diabetes. Oct 15, 2024; 15(10): 2058-2069
Published online Oct 15, 2024. doi: 10.4239/wjd.v15.i10.2058
Published online Oct 15, 2024. doi: 10.4239/wjd.v15.i10.2058
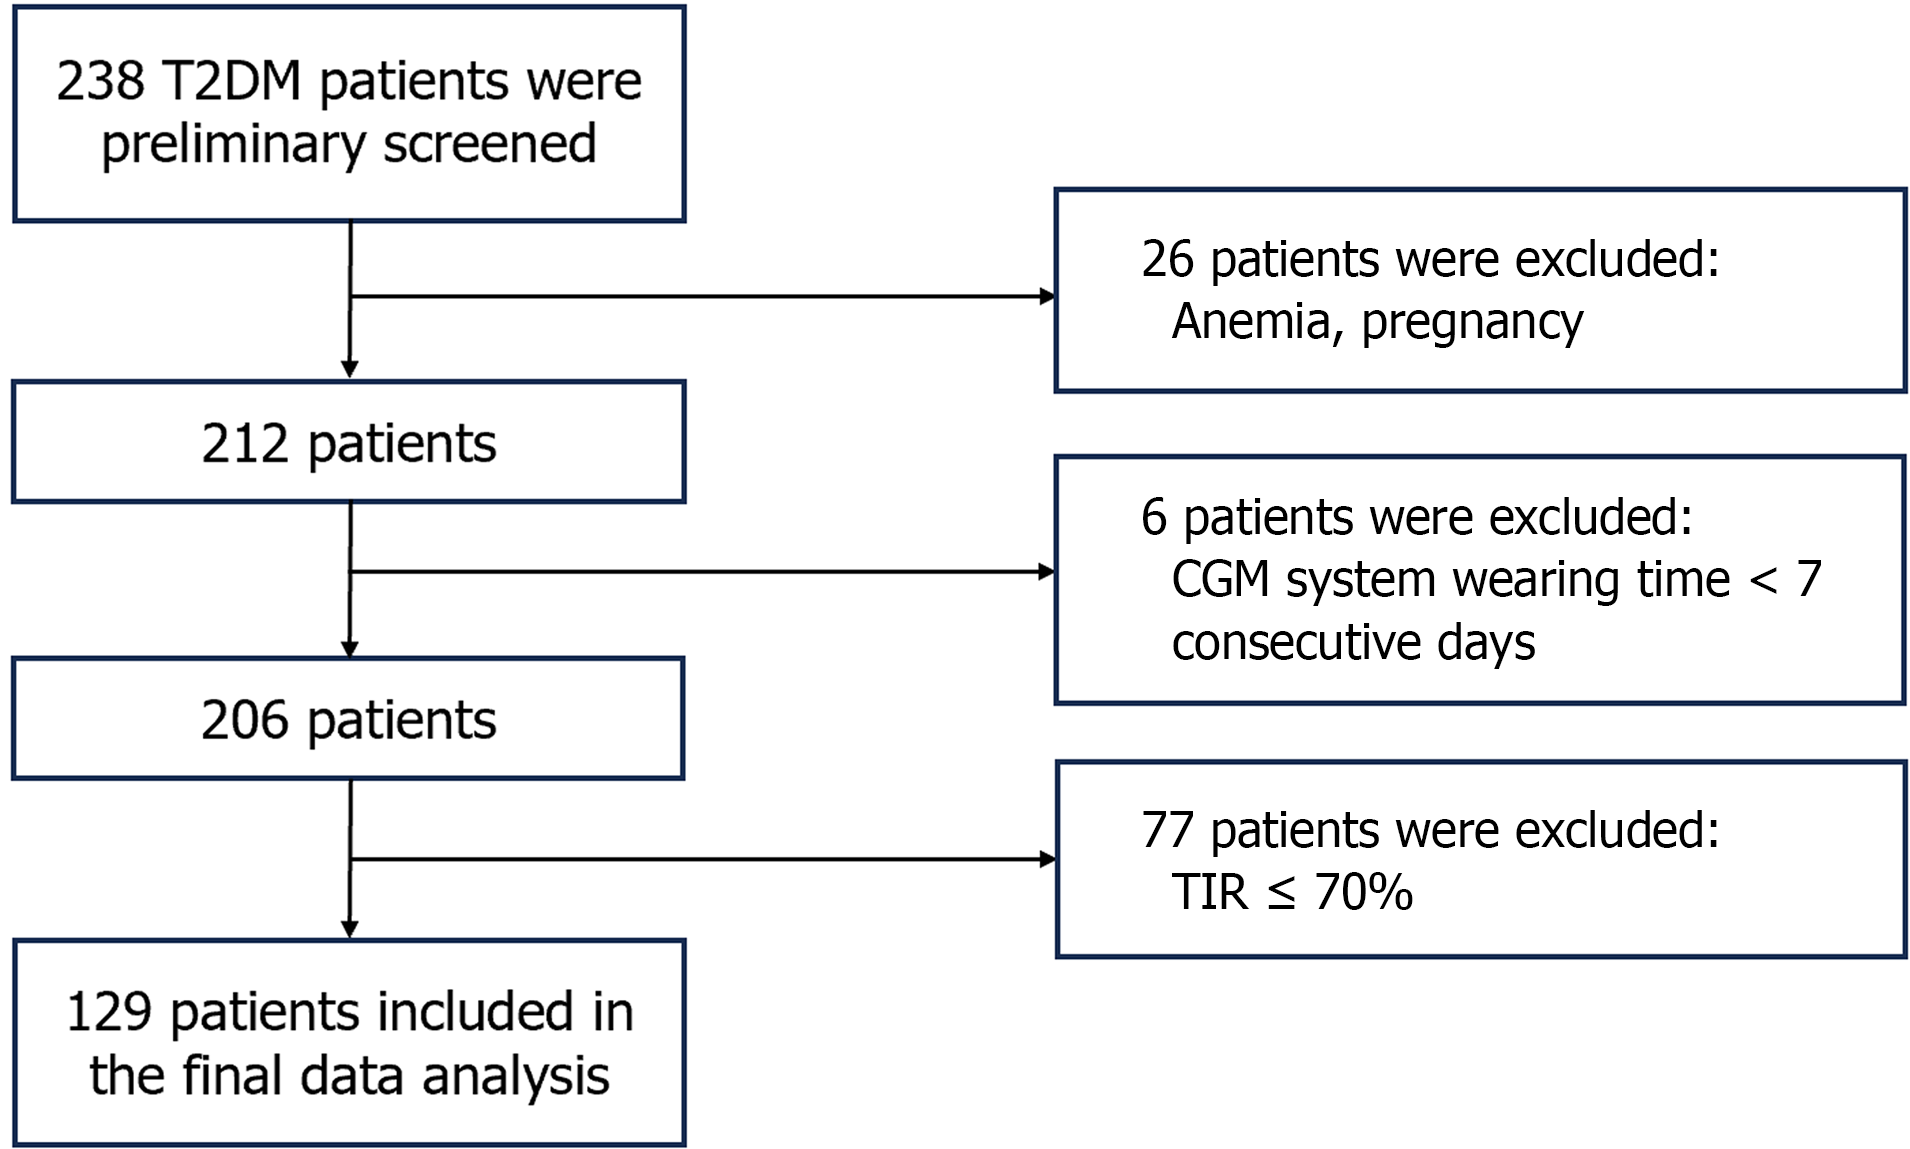
Figure 1 Flow chart of the trial.
T2DM: Type 2 diabetes mellitus; CGM: Continuous glucose monitoring; TIR: Time in range.
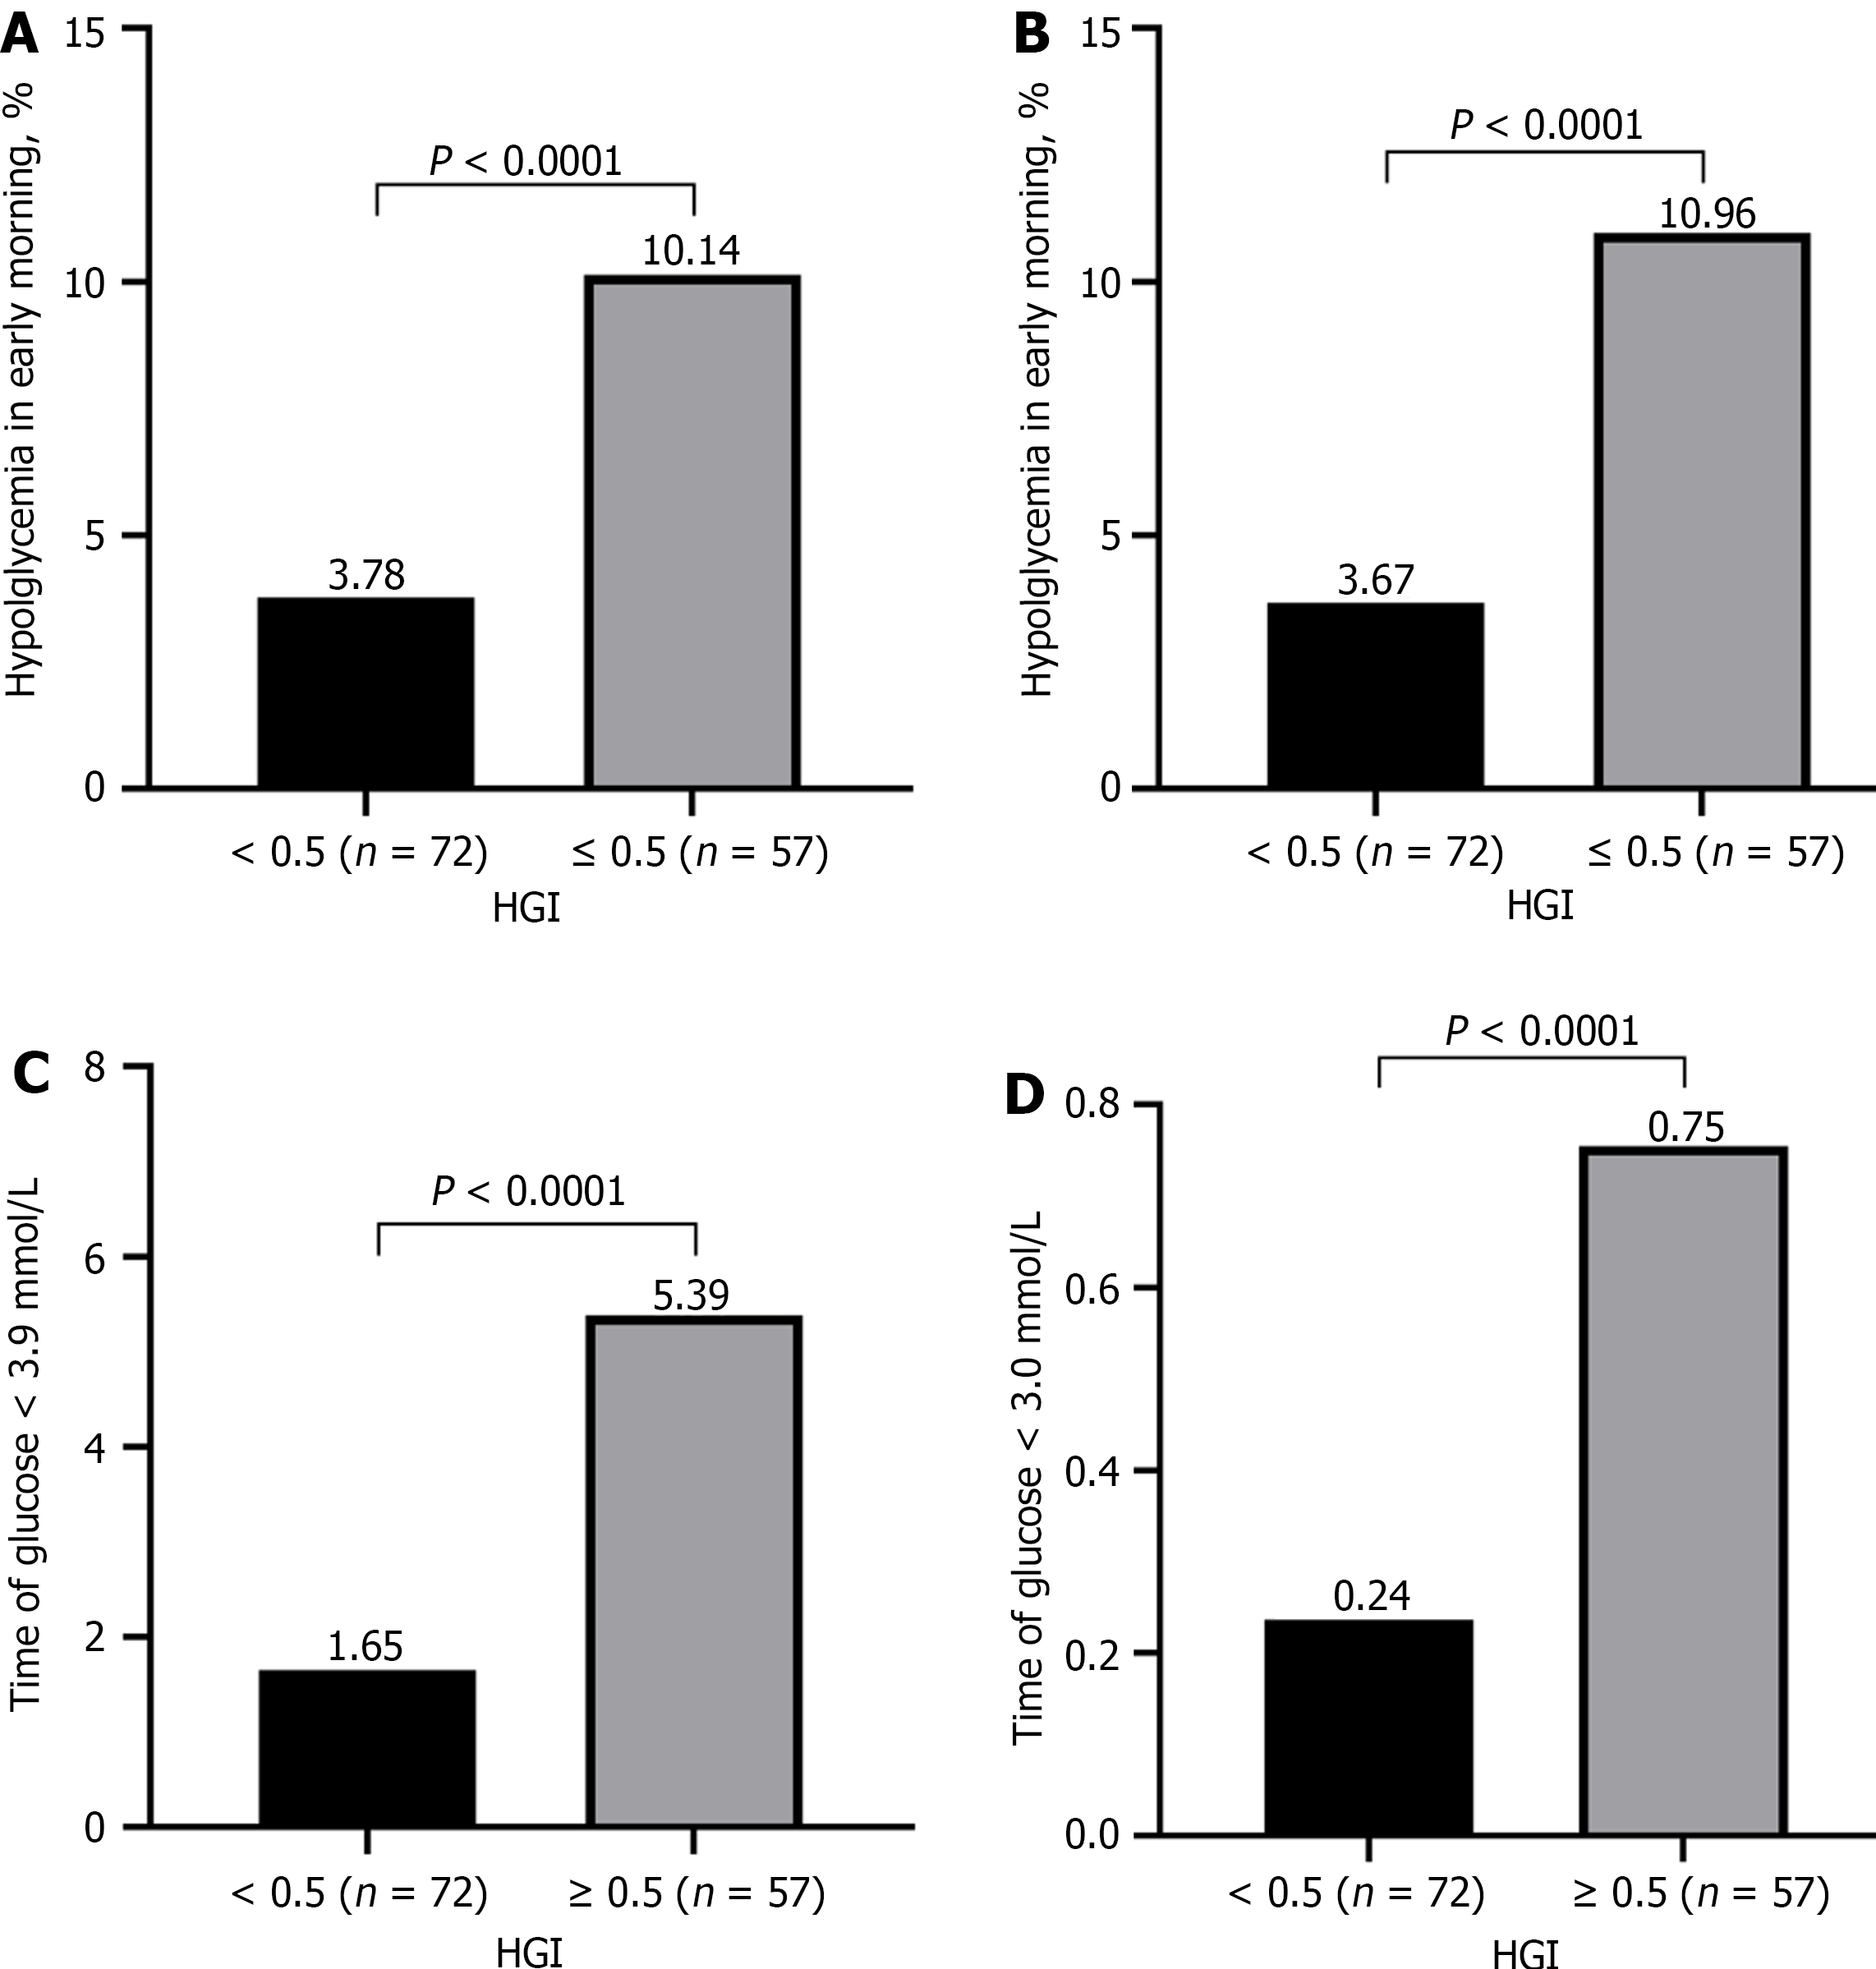
Figure 2 The differences in hypoglycemia between high hemoglobin glycation index and low hemoglobin glycation index groups.
A and B: Frequency of hypoglycemia in early morning (A) and nighttime (B); C and D: Frequency of time of glucose < 3.9 mmol/L (C) and < 3.0 mmol/L (D). HGI: Hemoglobin glycation index.
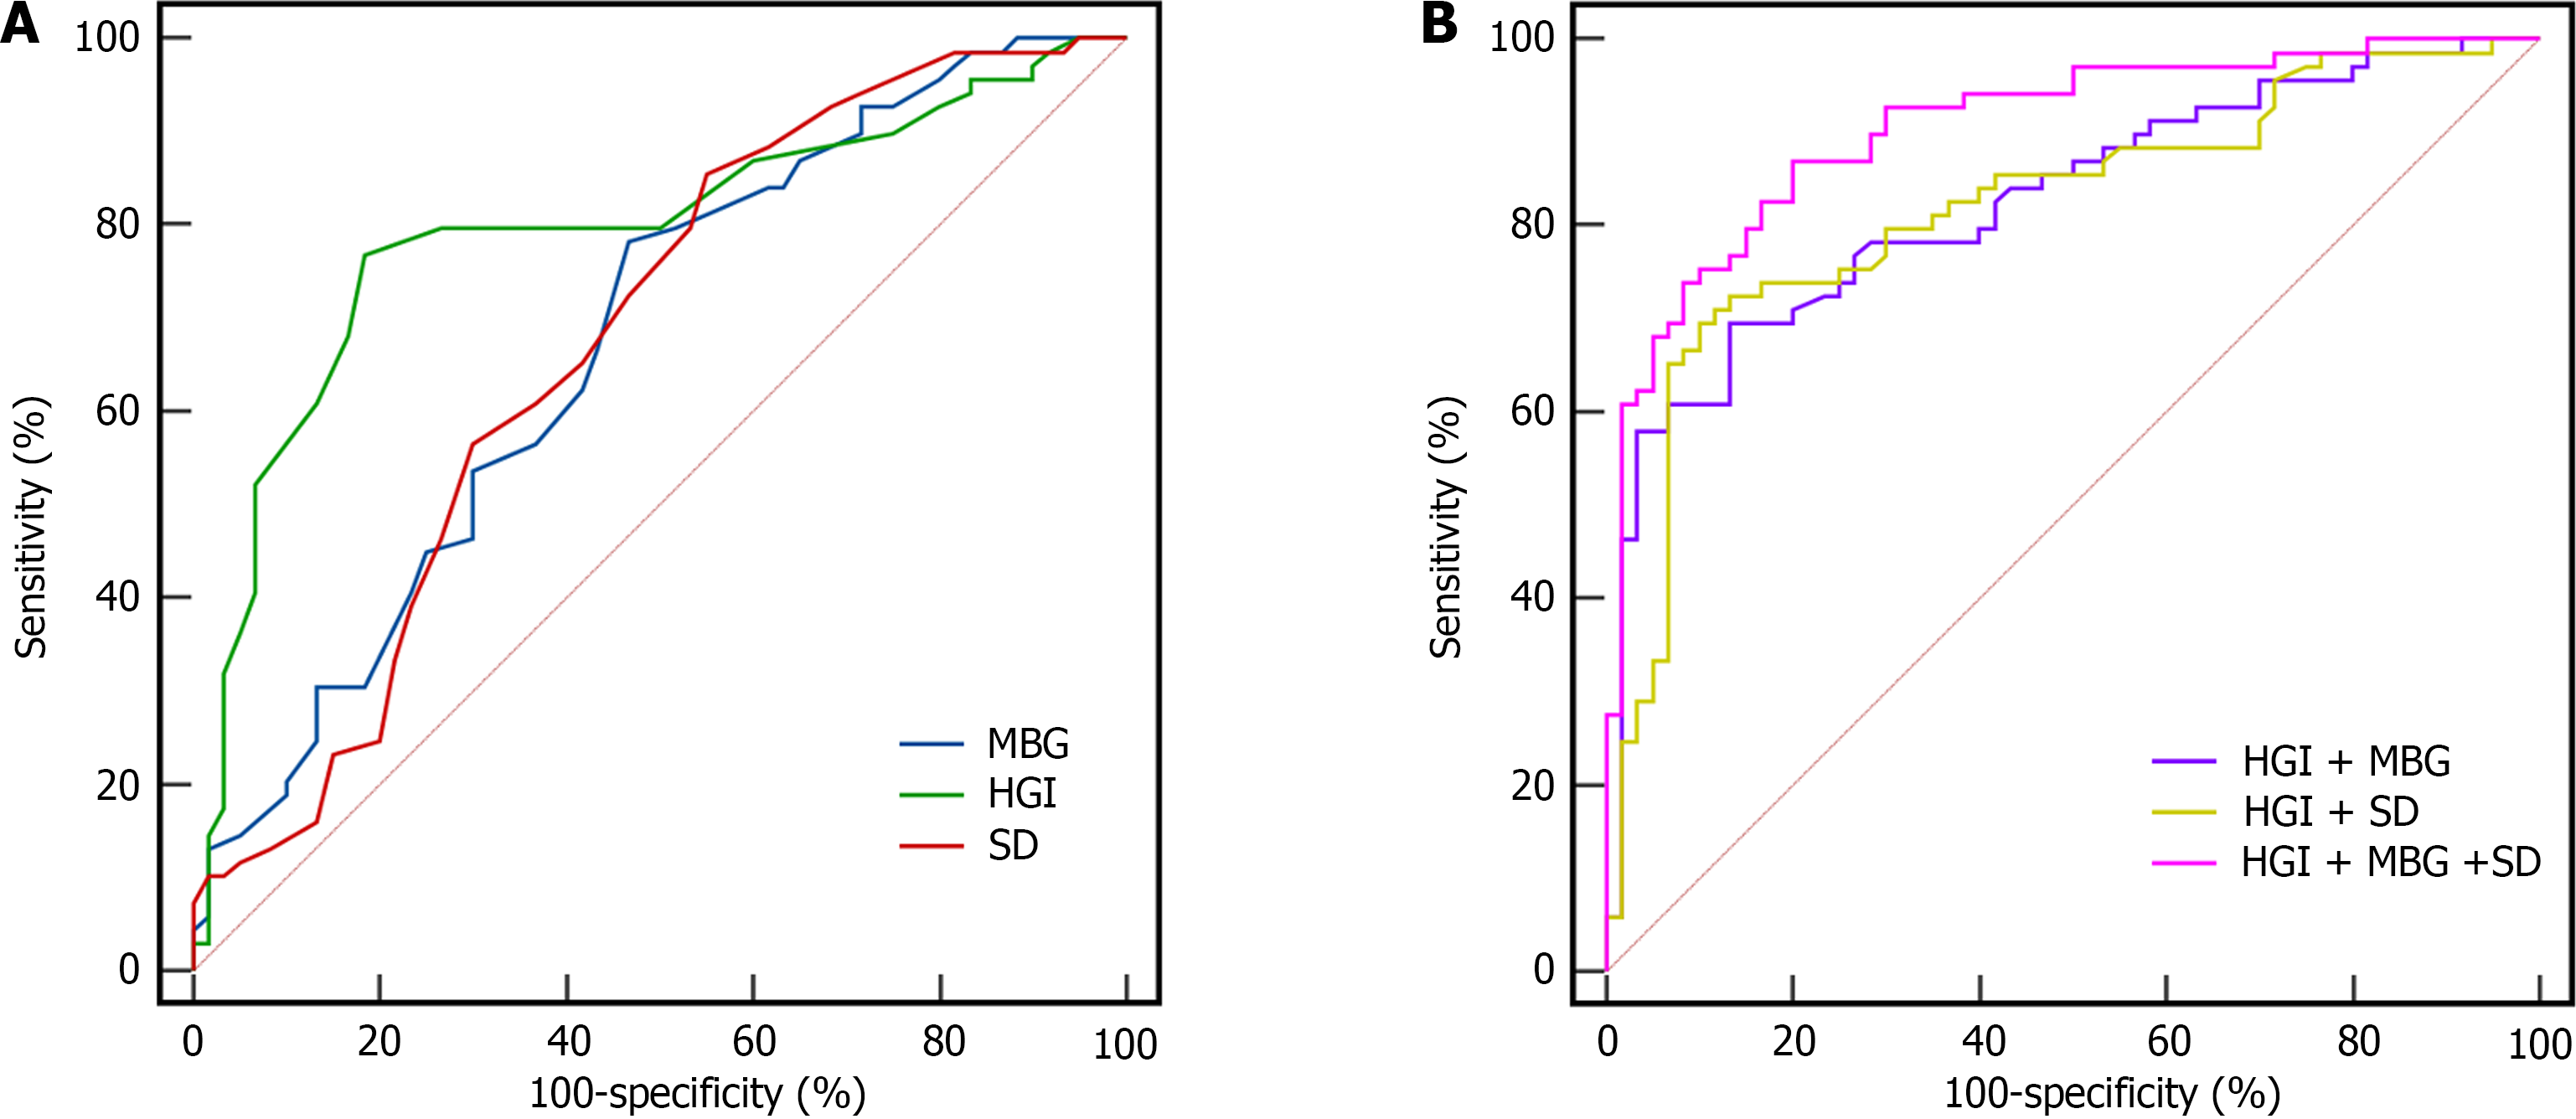
Figure 3 Receiver operator characteristic curve.
A: Receiver operator characteristic curve of high hemoglobin glycation index, low mean blood glucose and high standard deviation blood glucose in assessing risk of hypoglycemia among people with type 2 diabetes mellitus; B: Receiver operator characteristic curve of combination of high hemoglobin glycation index, low mean blood glucose and high standard deviation blood glucose in assessing risk of hypoglycemia among people with type 2 diabetes mellitus. HGI: Hemoglobin glycation index; MBG: Mean blood glucose; SD: Standard deviation.
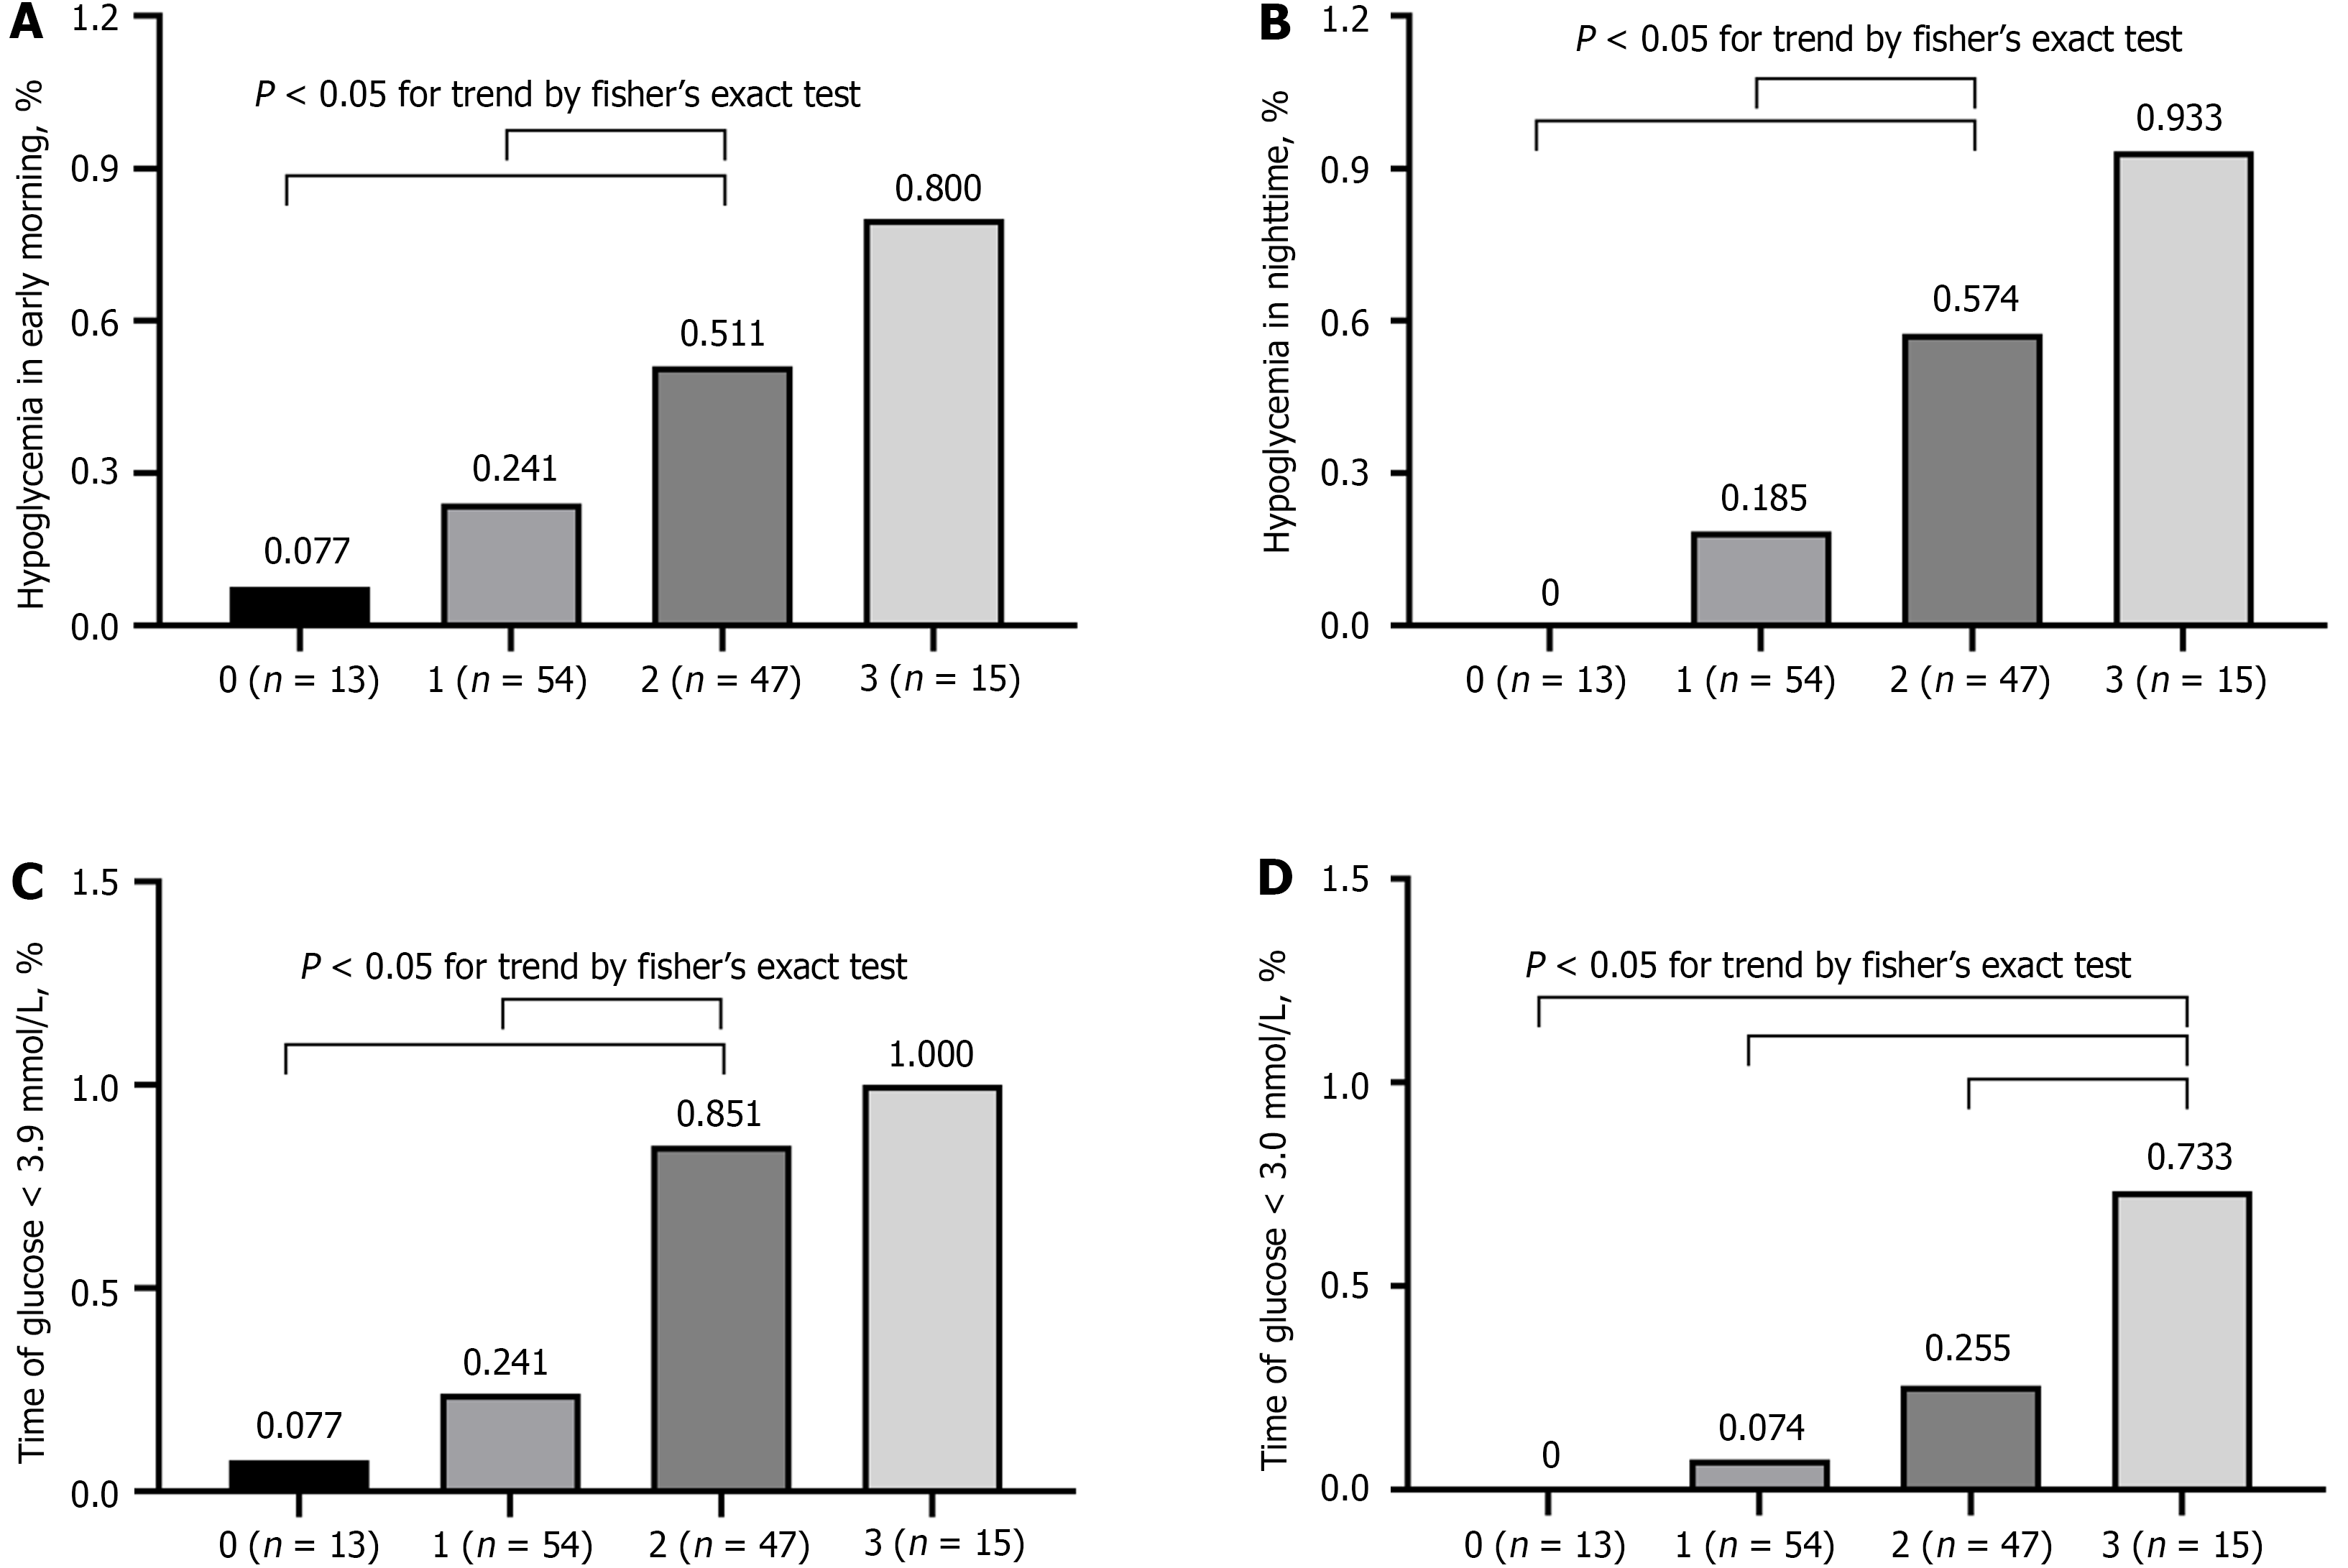
Figure 4 Relationship between the number of risk factors and hypoglycemia.
A and B: Frequency of hypoglycemia in early morning (A) and nighttime (B); C and D: Frequency of time of glucose < 3.9 mmol/L (C) and < 3.0 mmol/L (D). Number of risk factors for hypoglycemia: 0 [hemoglobin glycation index (HGI) < 0.5% and mean blood glucose (MBG) ≥ 7.2 mmol/L and standard deviation blood glucose (SDBG) < 1.4 mmol/L]; 1 (HGI ≥ 0.5% or MBG < 7.2 mmol/L or SDBG ≥ 1.4 mmol/L); 2 (HGI ≥ 0.5% and MBG < 7.2 mmol/L or HGI ≥ 0.5% and SDBG ≥ 1.4 mmol/L or MBG < 7.2 mmol/L and SDBG ≥ 1.4 mmol/L); 3 (HGI ≥ 0.5% and MBG < 7.2 mmol/L and SDBG ≥ 1.4 mmol/L).
- Citation: Lin BS, Liu ZG, Chen DR, Yang YL, Yang DZ, Yan JH, Zeng LY, Yang XB, Xu W. Relationship between hemoglobin glycation index and risk of hypoglycemia in type 2 diabetes with time-in-range in target. World J Diabetes 2024; 15(10): 2058-2069
- URL: https://www.wjgnet.com/1948-9358/full/v15/i10/2058.htm
- DOI: https://dx.doi.org/10.4239/wjd.v15.i10.2058


