Copyright
©The Author(s) 2024.
World J Diabetes. Jan 15, 2024; 15(1): 92-104
Published online Jan 15, 2024. doi: 10.4239/wjd.v15.i1.92
Published online Jan 15, 2024. doi: 10.4239/wjd.v15.i1.92
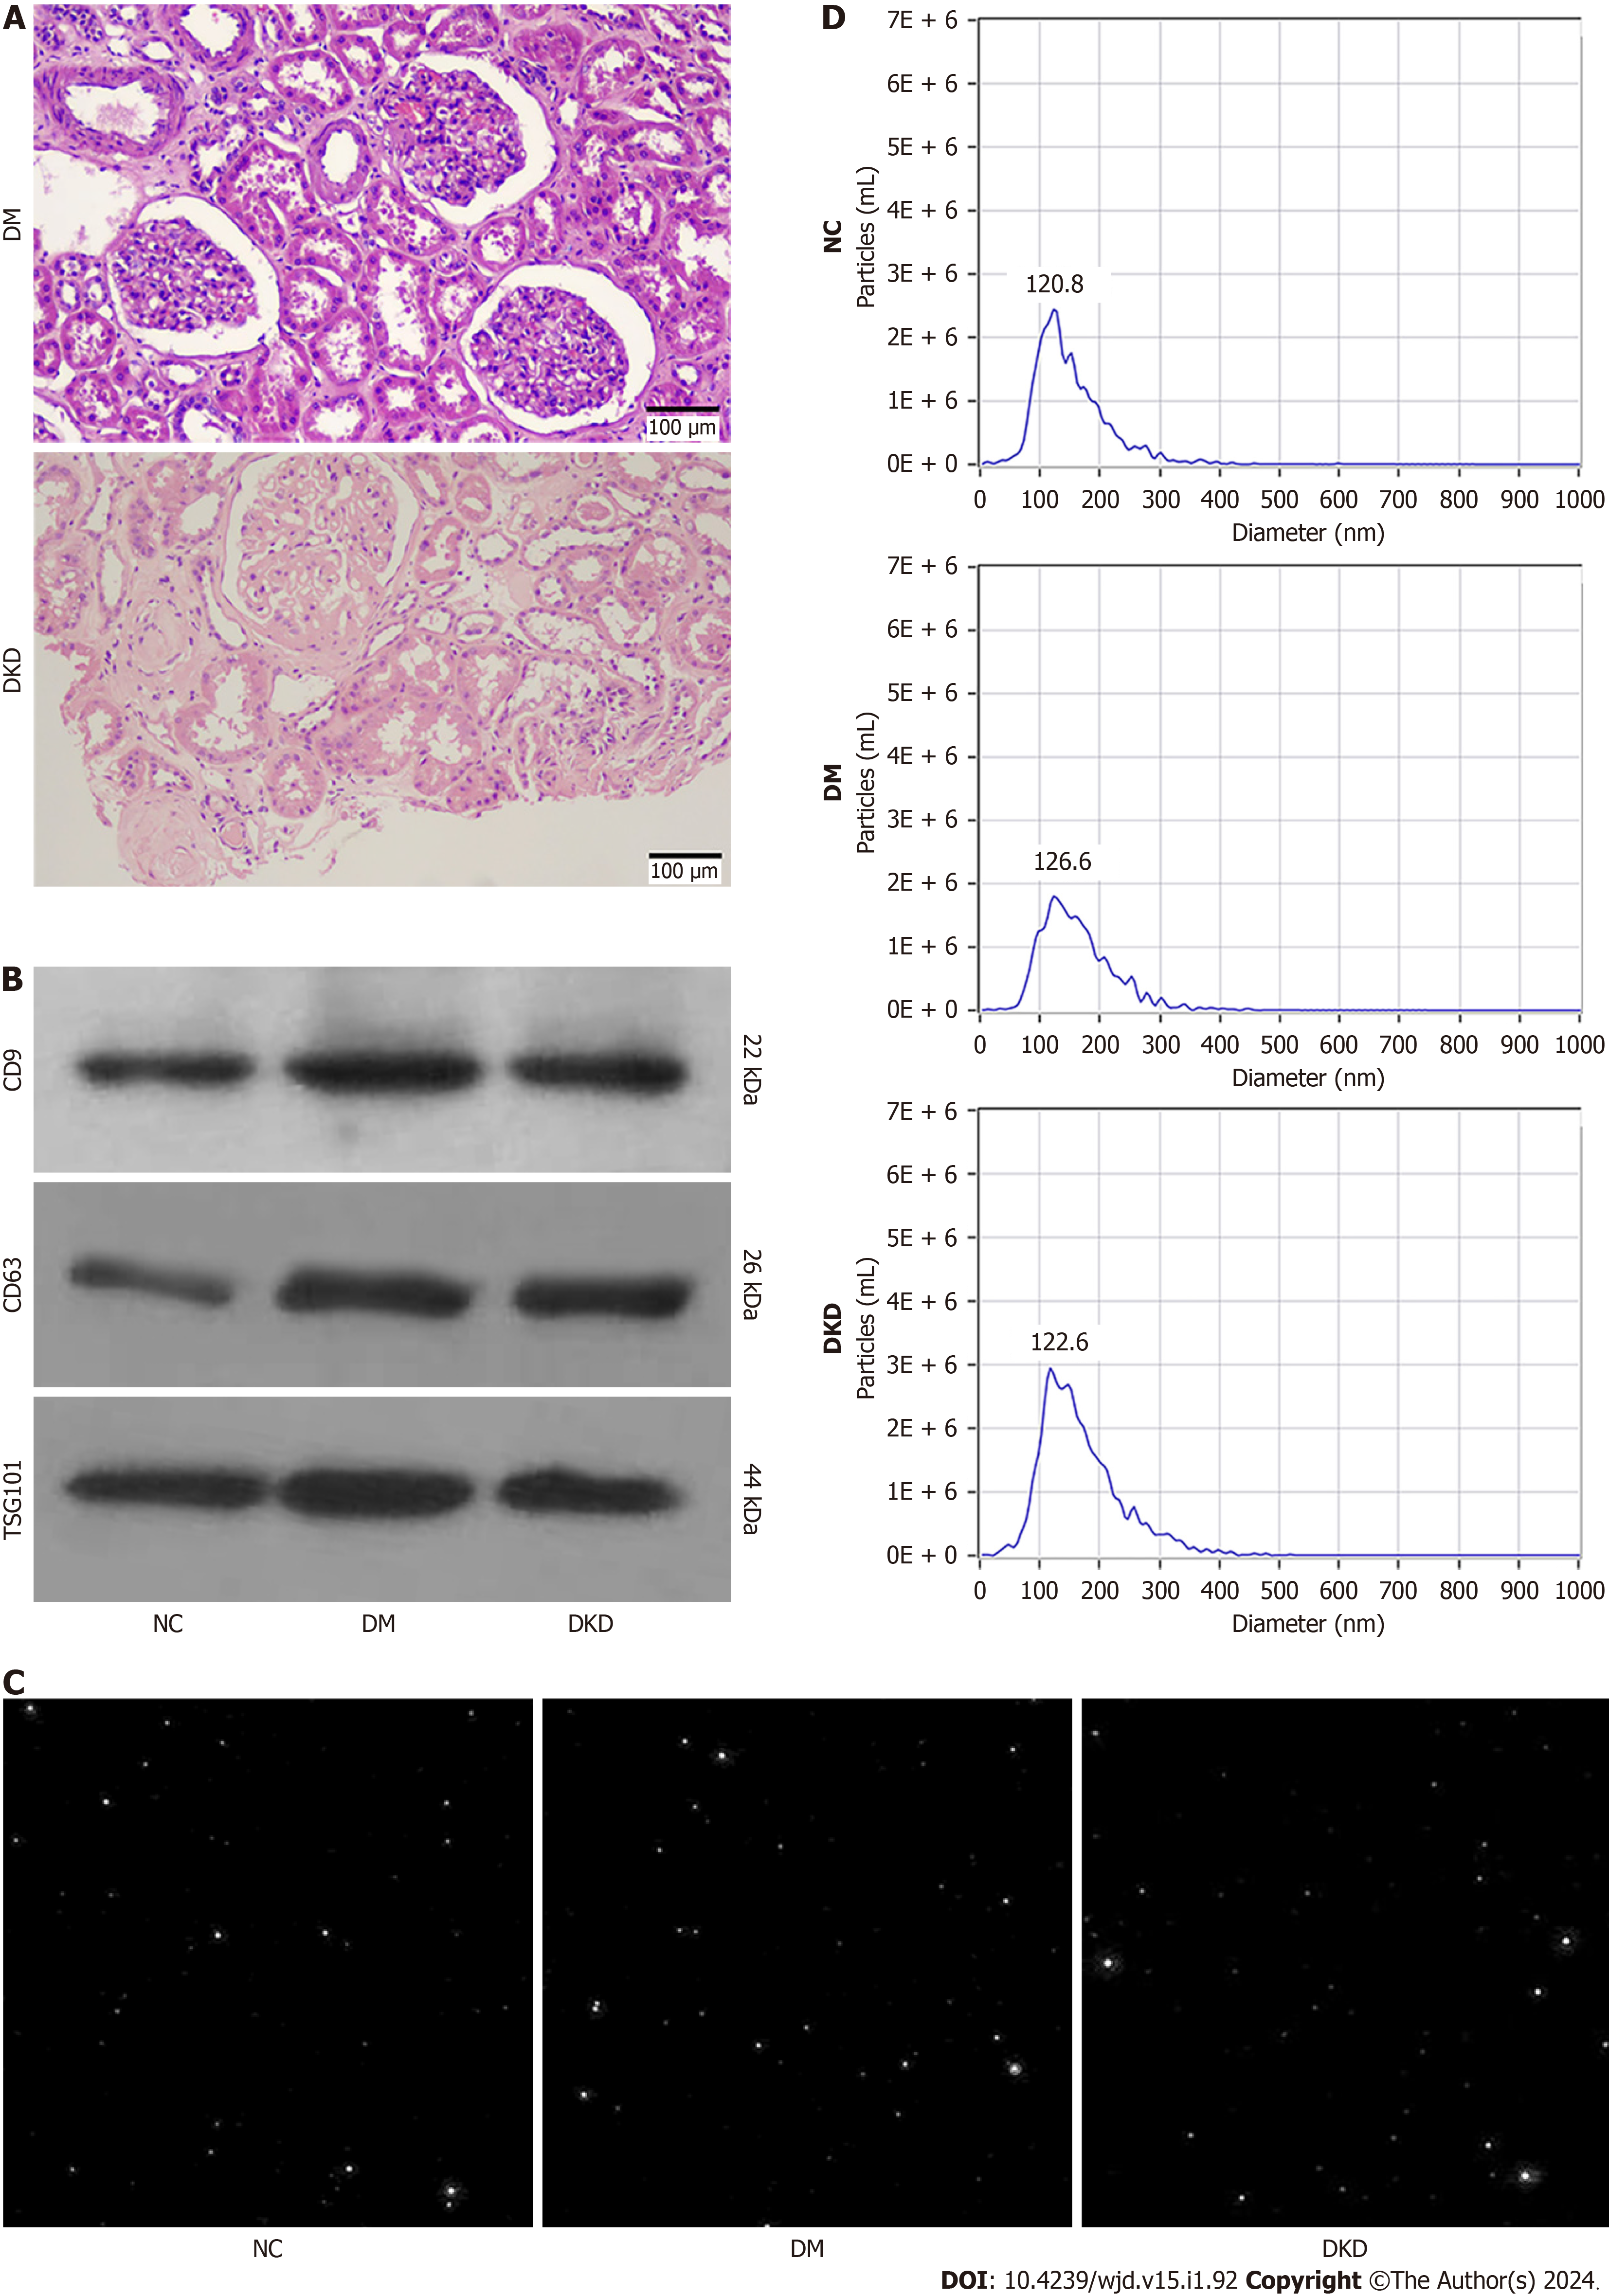
Figure 1 The characterization of urinary exosome.
A: The glomeruli histological features of diabetic kidney disease patients (Periodic acid-Schiff staining), Bar = 100 μm; B: The exosomal surface markers CD9, CD63 and TSG101 were detected by western blotting; C: The particle screenshots of nanoparticle tracking analysis (NTA) in the urine samples from participants; D: The diameter sizes and diameter concentration distributions of the particles were measured by NTA. NC: Normal control; DM: Diabetes mellitus; DKD: Diabetic kidney disease.
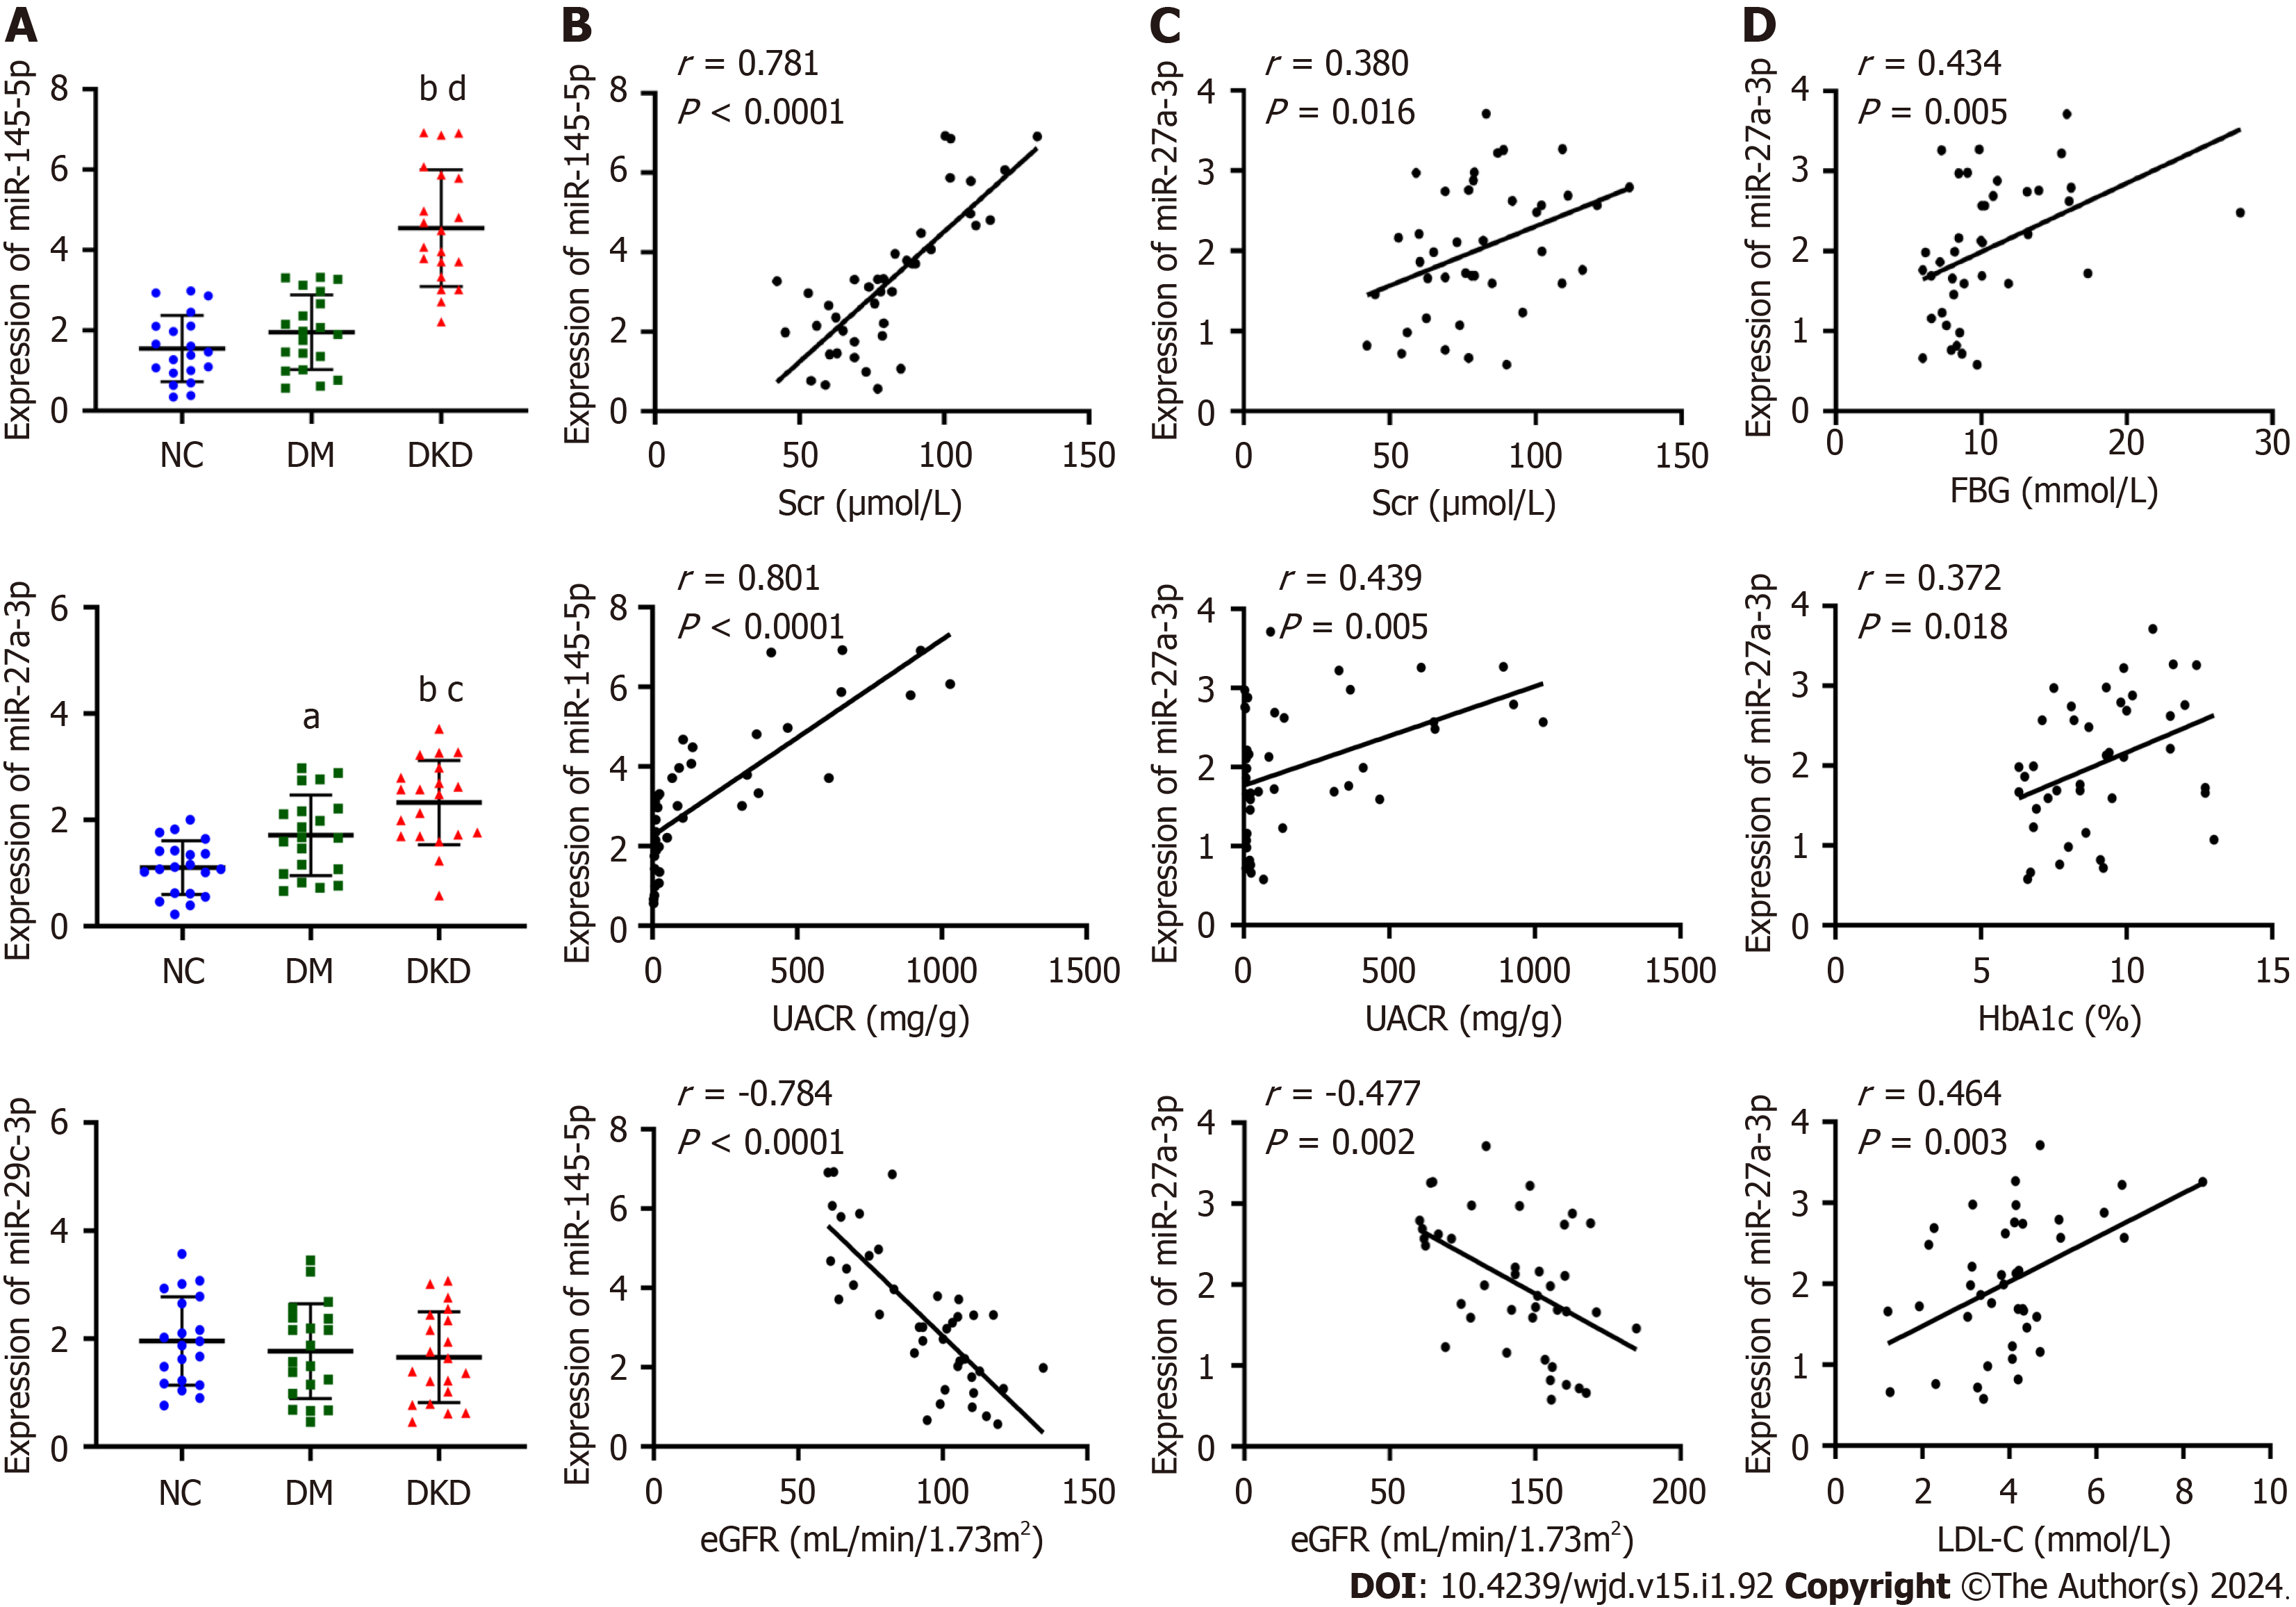
Figure 2 The expressions of urinary exosomal microRNAs in three groups and the correlations between urinary exosomal miR-145-5p, miR-27a-3p and clinical data of type 2 diabetes mellitus patients.
A: The exosomal miR-145-5p and miR-27a-3p were evidently up-regulated in diabetic kidney disease group compared with normal control (NC) and diabetes mellitus (DM) groups. The exosomal miR-27a-3p in the DM group was higher than that of the NC group. There were no differences in the expression of miR-145-5p between DM and NC groups, and miR-29c-3p among the three groups; B and C: Exosomal miR-145-5p and miR-27a-3p were positively correlated with serum creatinine and urinary albumin to creatinine ratio, negatively correlated with estimated glomerular filtration rate in type 2 DM (T2DM) patients; D: Exosomal miR-27a-3p was positively correlated with fasting blood glucose, glycosylated hemoglobin A1c and low-density lipoprotein cholesterol in T2DM patients. aP < 0.05, bP < 0.001 vs normal control group; cP < 0.05, dP < 0.001 vs diabetes mellitus group. NC: Normal control; DM: Diabetes mellitus; T2DM: Type 2 diabetes mellitus; DKD: Diabetic kidney disease; Scr: Serum creatinine; FBG: Fasting blood glucose; eGFR: Estimated glomerular filtration rate; UACR: Urinary albumin to creatinine ratio; HbA1c: Glycosylated hemoglobin A1c; LDL-C: Low-density lipoprotein cholesterol.
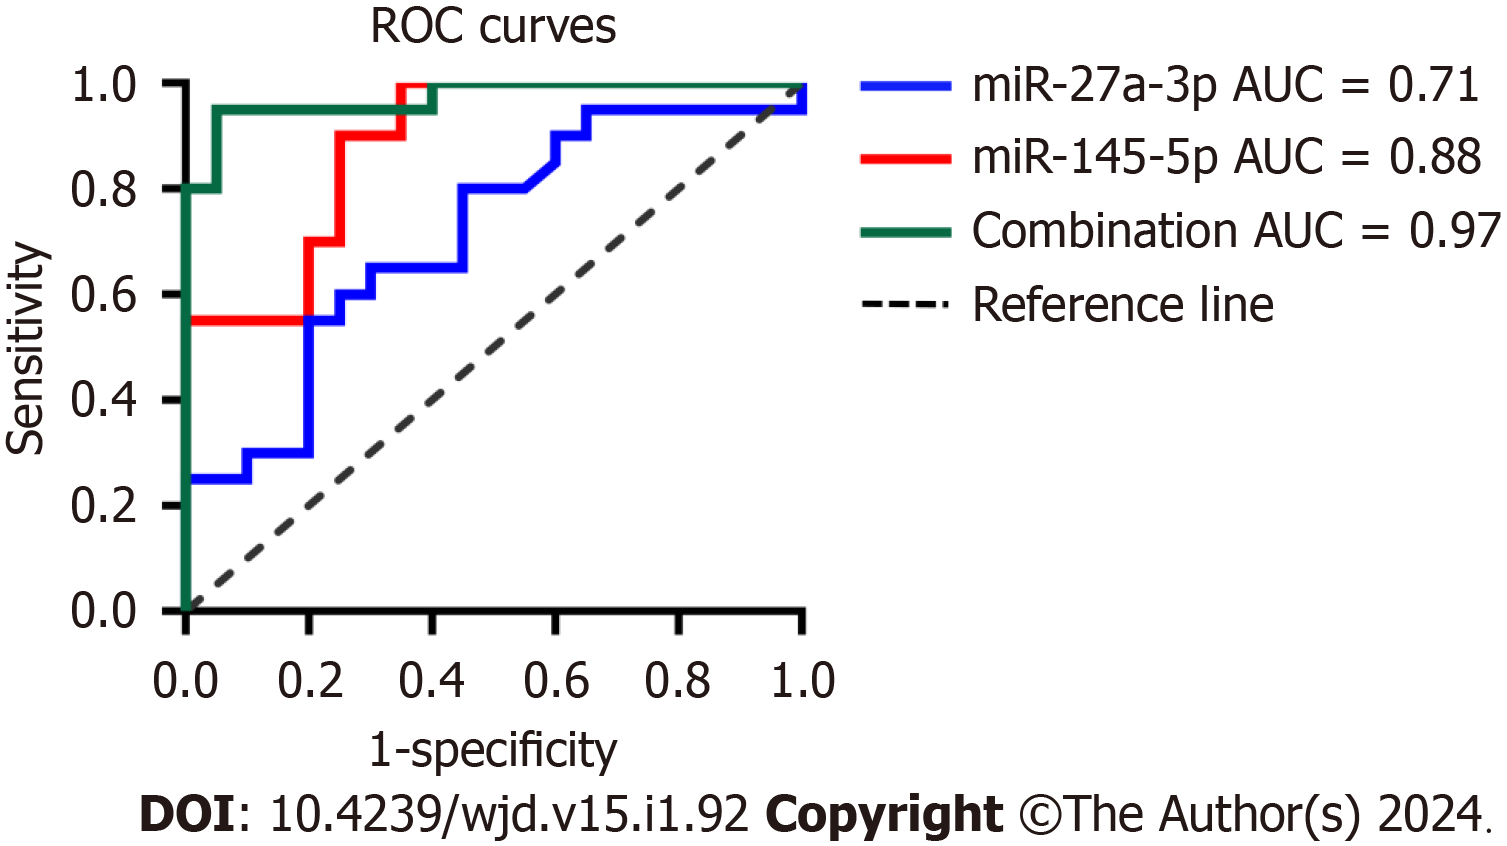
Figure 3 Receiver operating characteristic curves of urinary exosomal miR-145-5p, miR-27a-3p and their combination to discriminate diabetic kidney disease from type 2 diabetes mellitus patients.
The area under the curve for miR-27a-3p was 0.71 [95% confidence interval (CI): 0.547-0.871, P = 0.0239], 0.88 (95%CI: 0.784-0.985, P < 0.0001) for miR-145-5p, and 0.97 (95%CI: 0.927-1.000, P < 0.0001) for their combination. ROC: Receiver operating characteristic; AUC: Area under the curve.
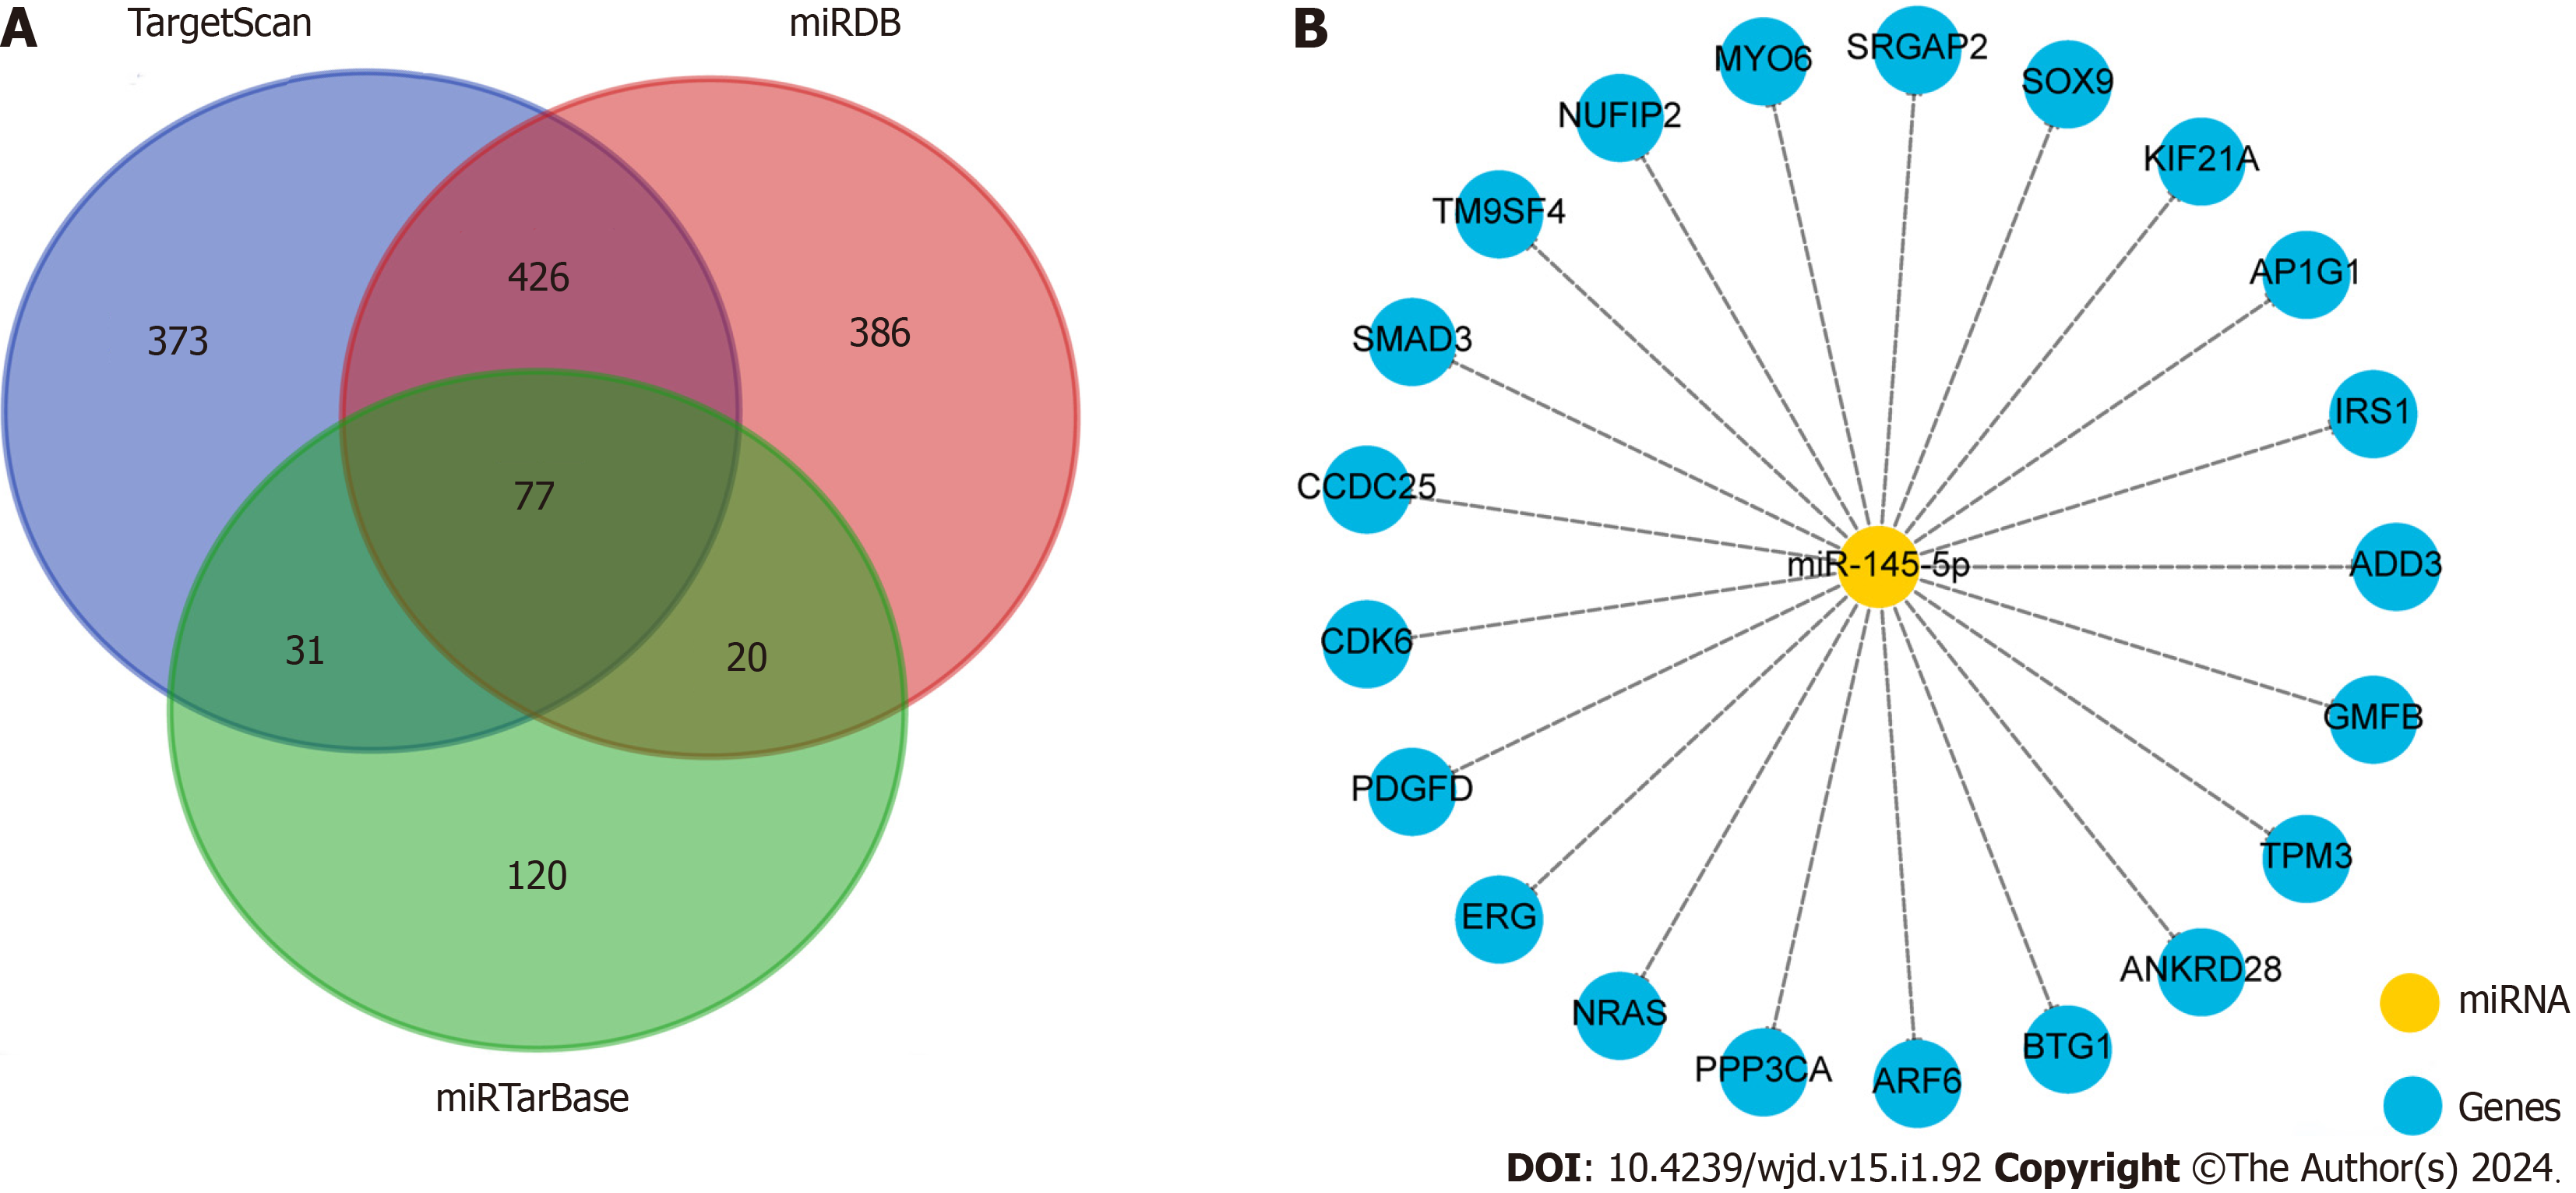
Figure 4 The potential target genes of exosomal miR-145-5p were predicted by three different gene databases.
A: The Venn diagram showed that 907 genes were detected by TargetScan, 909 genes were tested by miRDB and 248 genes were predicted by miRTarBase. A total of 77 items gene were simultaneously predicted by the three gene databases; B: Among the 77 target genes, we listed some gene names according to the target score.
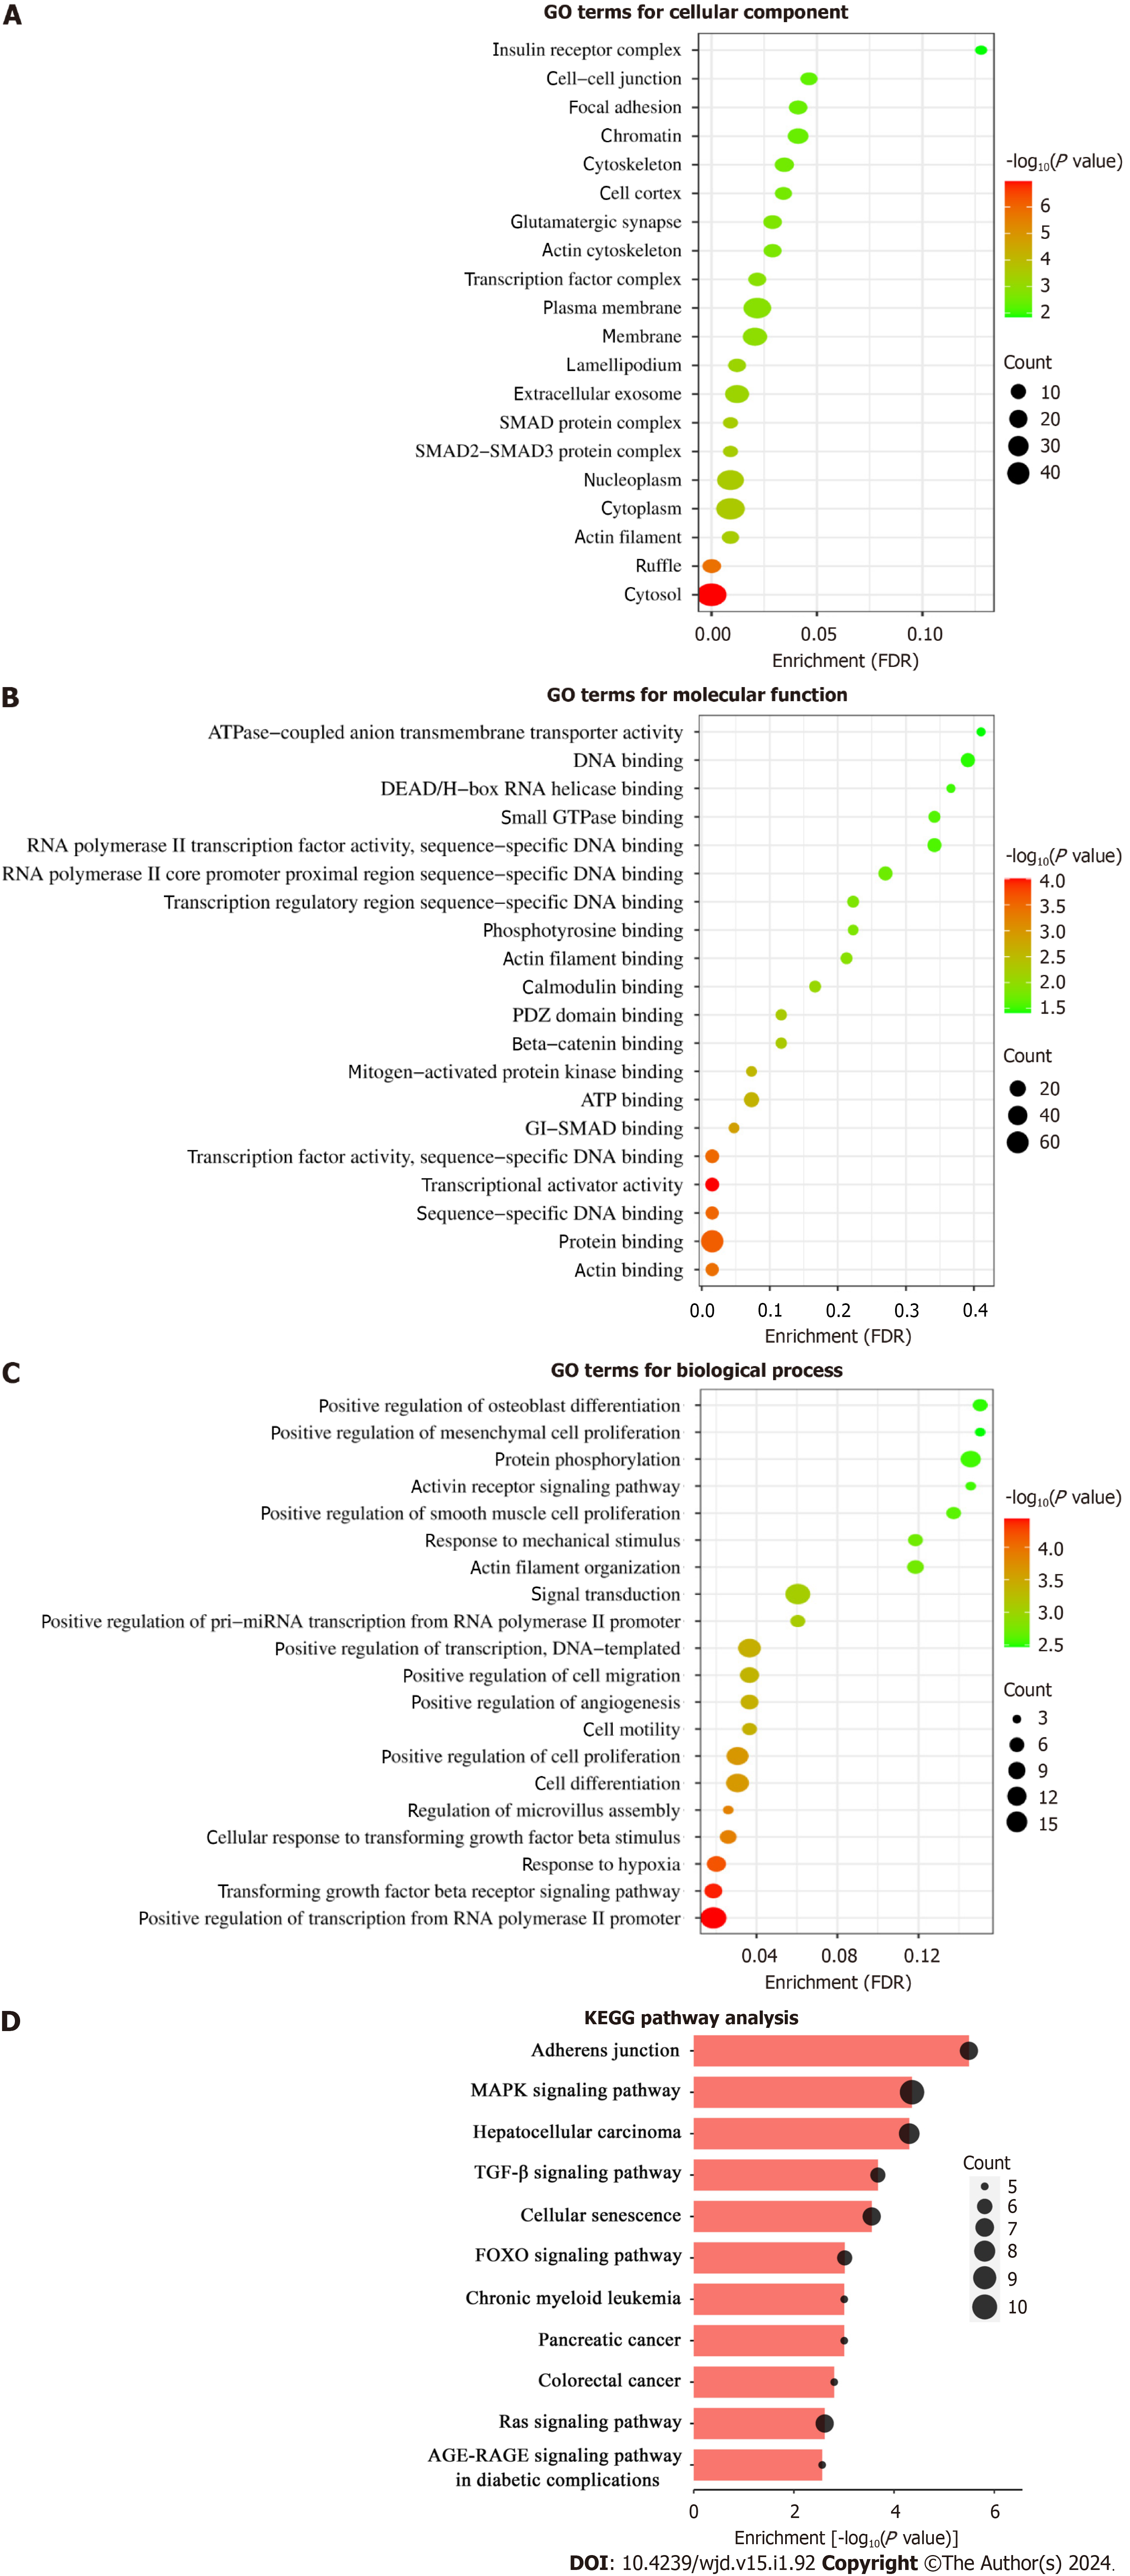
Figure 5 Bioinformatics analysis of the genes of miR-145-5p potential target.
A-C: Biological functions of the 77 intersectant target genes of miR-145-5p were described by Gene Ontology on cellular component, molecular function, and biological process aspect respectively; D: Kyoto Encyclopedia of Genes and Genomes pathways analysis predicted a total of 11 enriched signal pathways of the potential target genes of miR-145-5p. GO: Gene Ontology; KEGG: Kyoto Encyclopedia of Genes and Genomes; FDR: False discovery rate.
- Citation: Han LL, Wang SH, Yao MY, Zhou H. Urinary exosomal microRNA-145-5p and microRNA-27a-3p act as noninvasive diagnostic biomarkers for diabetic kidney disease. World J Diabetes 2024; 15(1): 92-104
- URL: https://www.wjgnet.com/1948-9358/full/v15/i1/92.htm
- DOI: https://dx.doi.org/10.4239/wjd.v15.i1.92


