Copyright
©The Author(s) 2024.
World J Diabetes. Jan 15, 2024; 15(1): 72-80
Published online Jan 15, 2024. doi: 10.4239/wjd.v15.i1.72
Published online Jan 15, 2024. doi: 10.4239/wjd.v15.i1.72
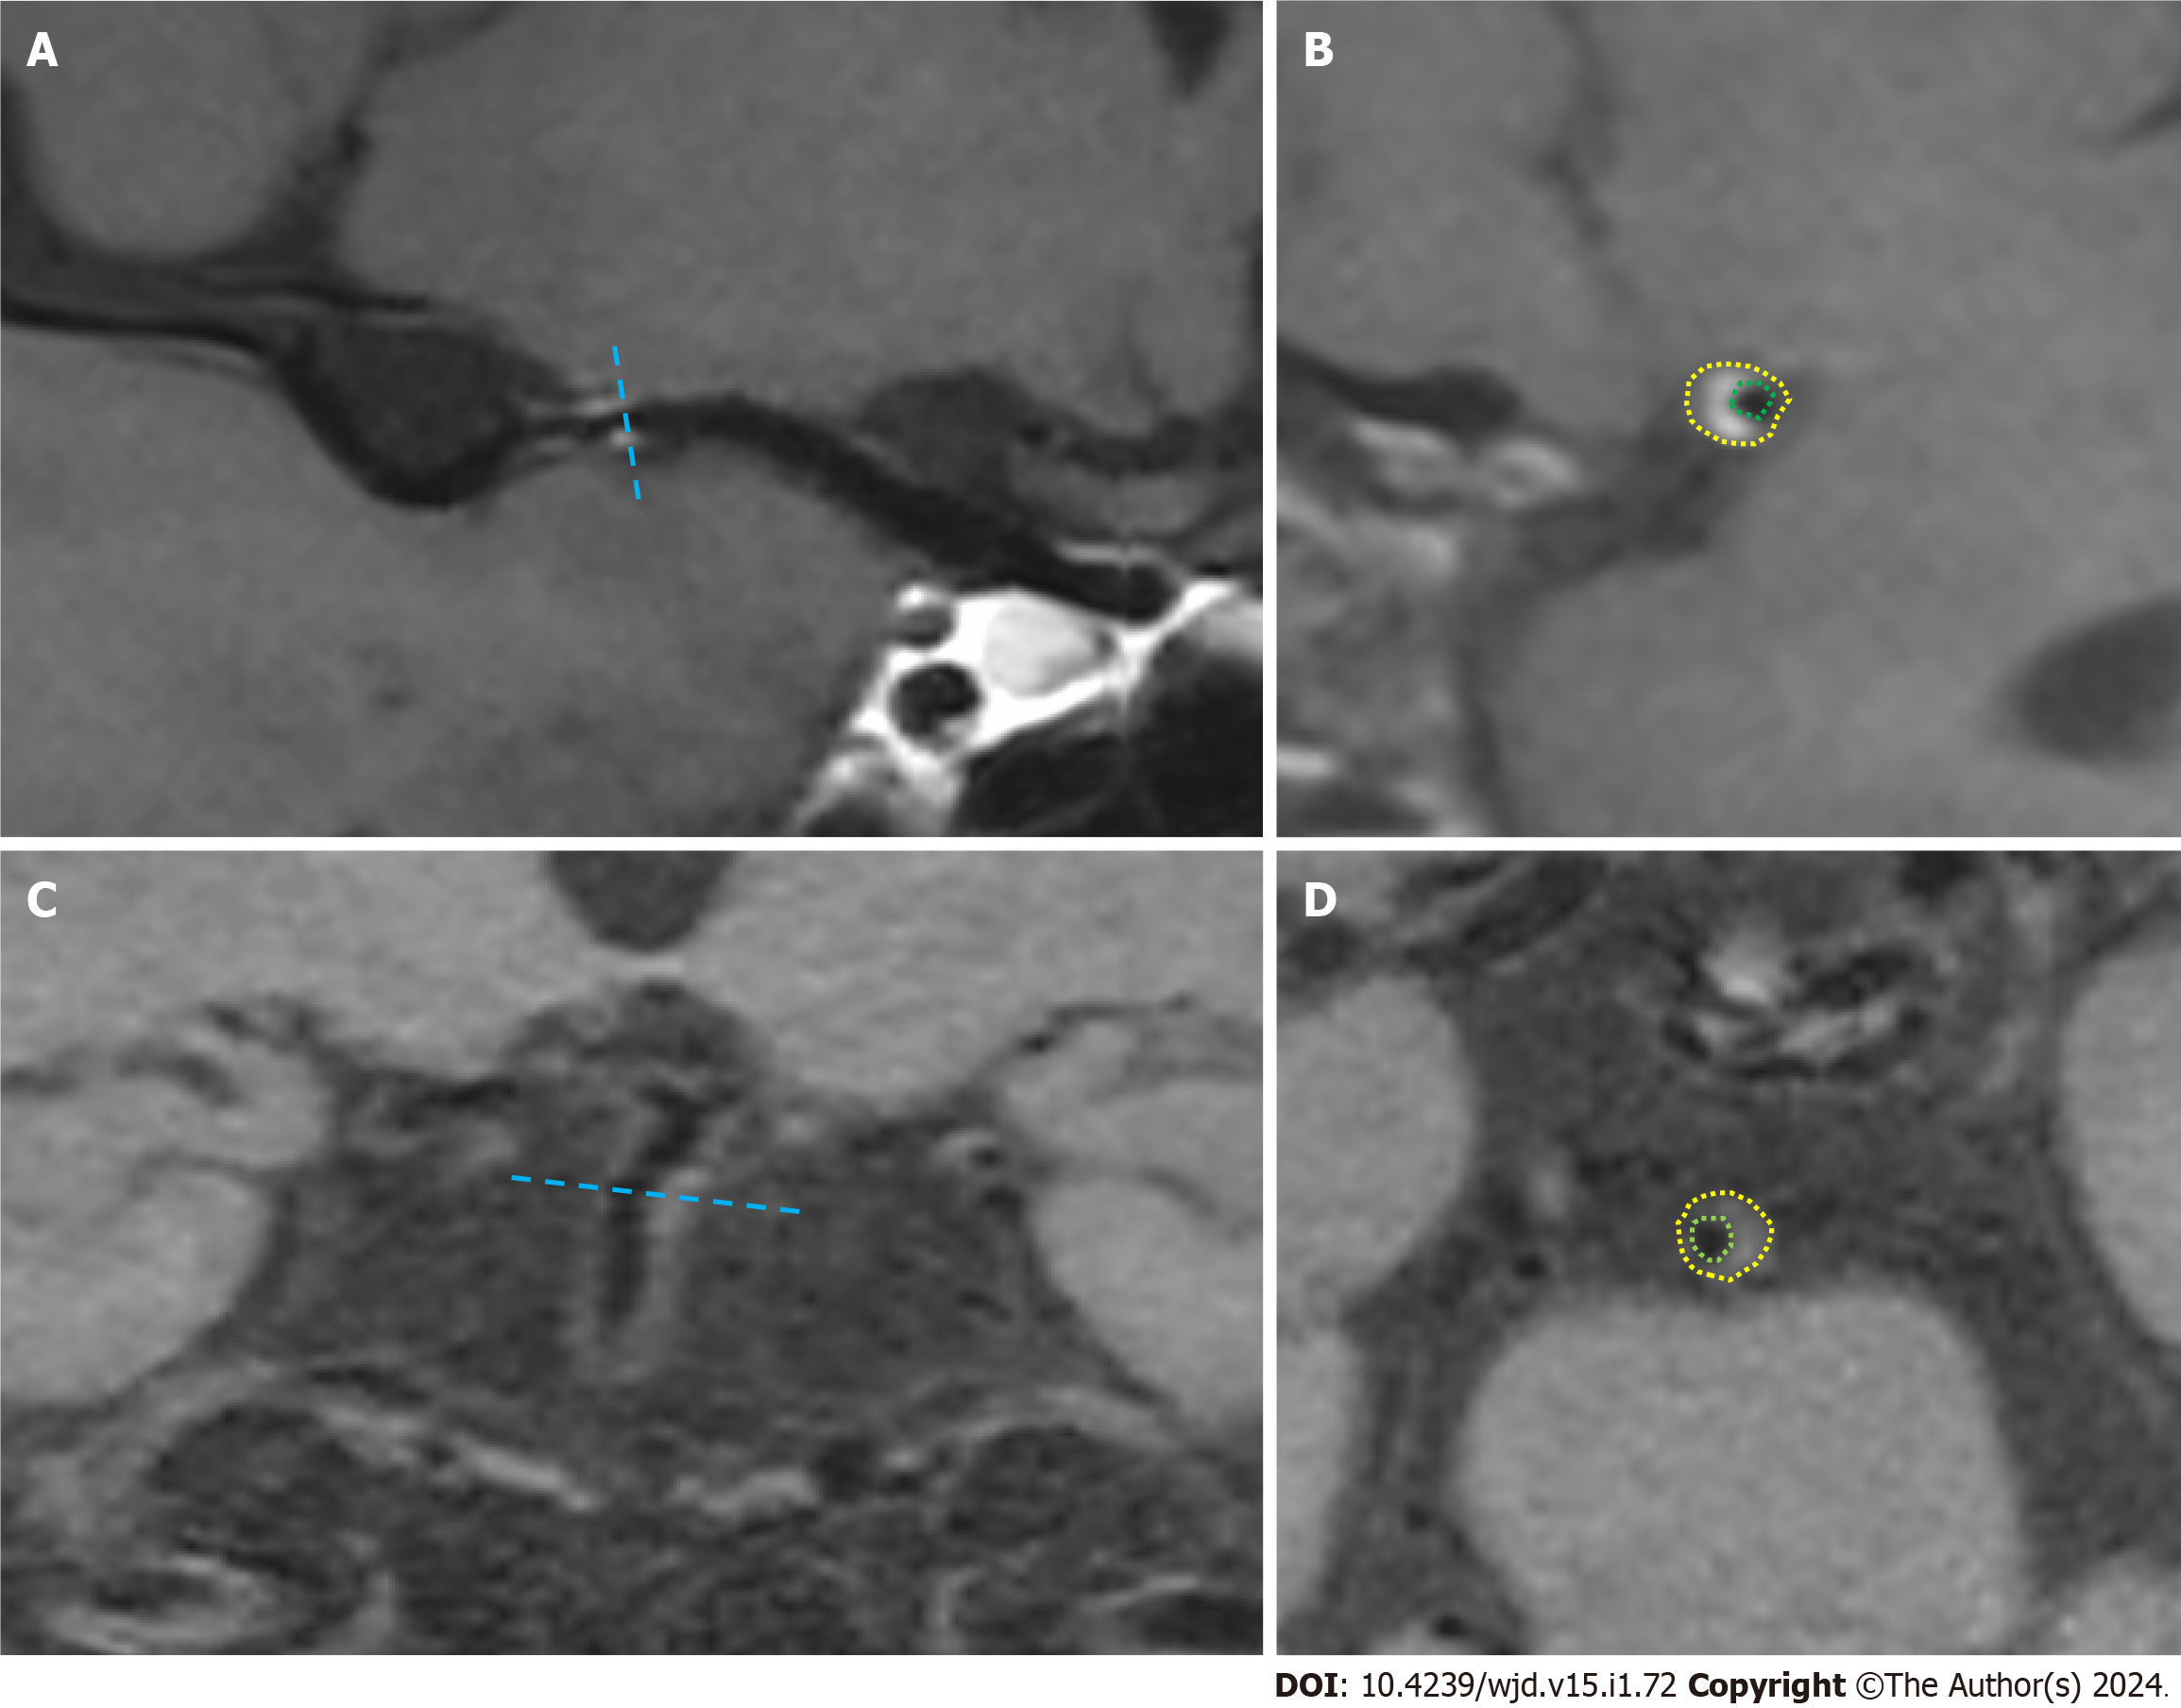
Figure 1 Schematic of the measurement of the plaque.
A: The long-axis diagram of the vessel for the first case; B: The cross-section of the vessel at the plaque for the first case; C: The long-axis diagram of the vessel; D: The cross-section of the vessel at the plaque. The green circle indicates the boundary of the inner vessel wall, while the yellow circle signifies the boundary of the outer vessel wall.
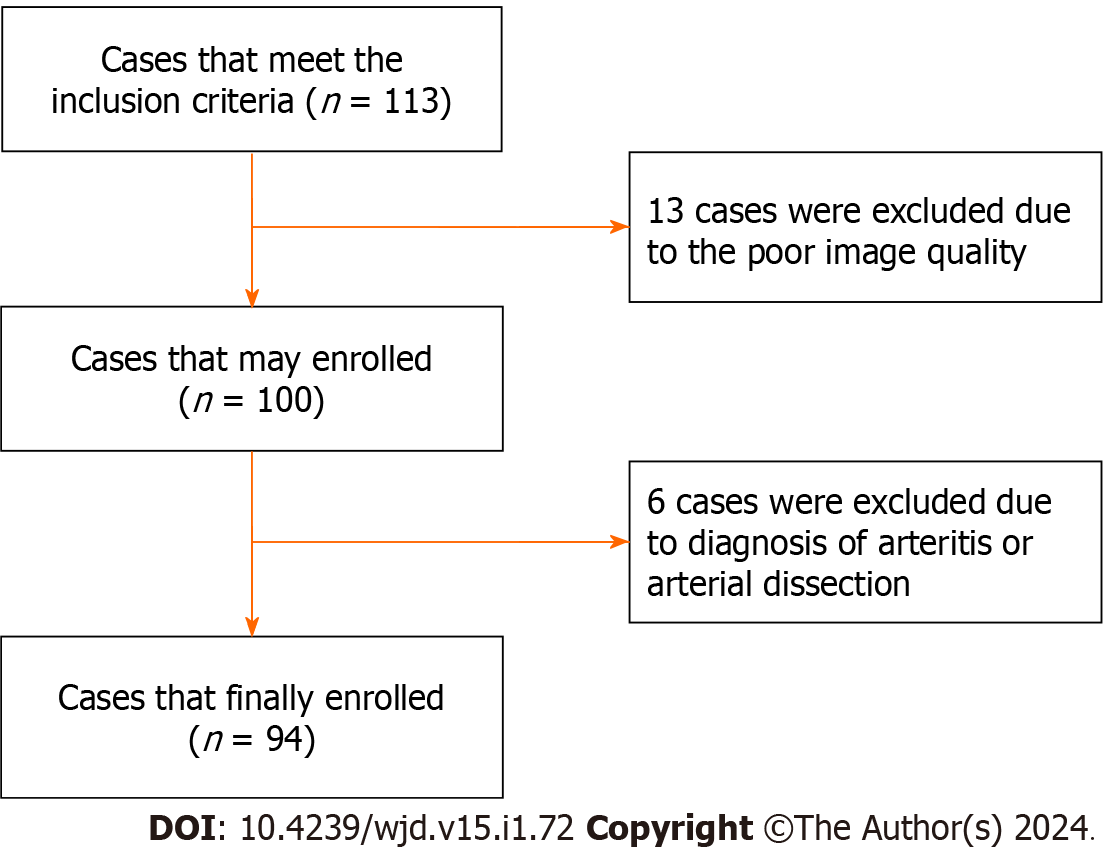
Figure 2 The flow chart of selecting patients.
Figure 3 The image of the positive remodelling.
A and B: The M1 segment of the right middle cerebral artery plaque with eccentric thickening of the wall, mild narrowing of the lumen and a remodeling index of 1.87 (orange arrow); C: Its proximal normal wall.
Figure 4 The image of the negative remodelling.
A and B: The M1 segment of the left middle cerebral artery plaque with eccentric thickening of the wall, mild narrowing of the lumen and a remodeling index of 0.58 (orange arrow); C: Its proximal normal wall.
- Citation: Mo YQ, Luo HY, Zhang HW, Liu YF, Deng K, Liu XL, Huang B, Lin F. Investigating the relationship between intracranial atherosclerotic plaque remodelling and diabetes using high-resolution vessel wall imaging. World J Diabetes 2024; 15(1): 72-80
- URL: https://www.wjgnet.com/1948-9358/full/v15/i1/72.htm
- DOI: https://dx.doi.org/10.4239/wjd.v15.i1.72


