Copyright
©The Author(s) 2024.
World J Diabetes. Jan 15, 2024; 15(1): 105-125
Published online Jan 15, 2024. doi: 10.4239/wjd.v15.i1.105
Published online Jan 15, 2024. doi: 10.4239/wjd.v15.i1.105
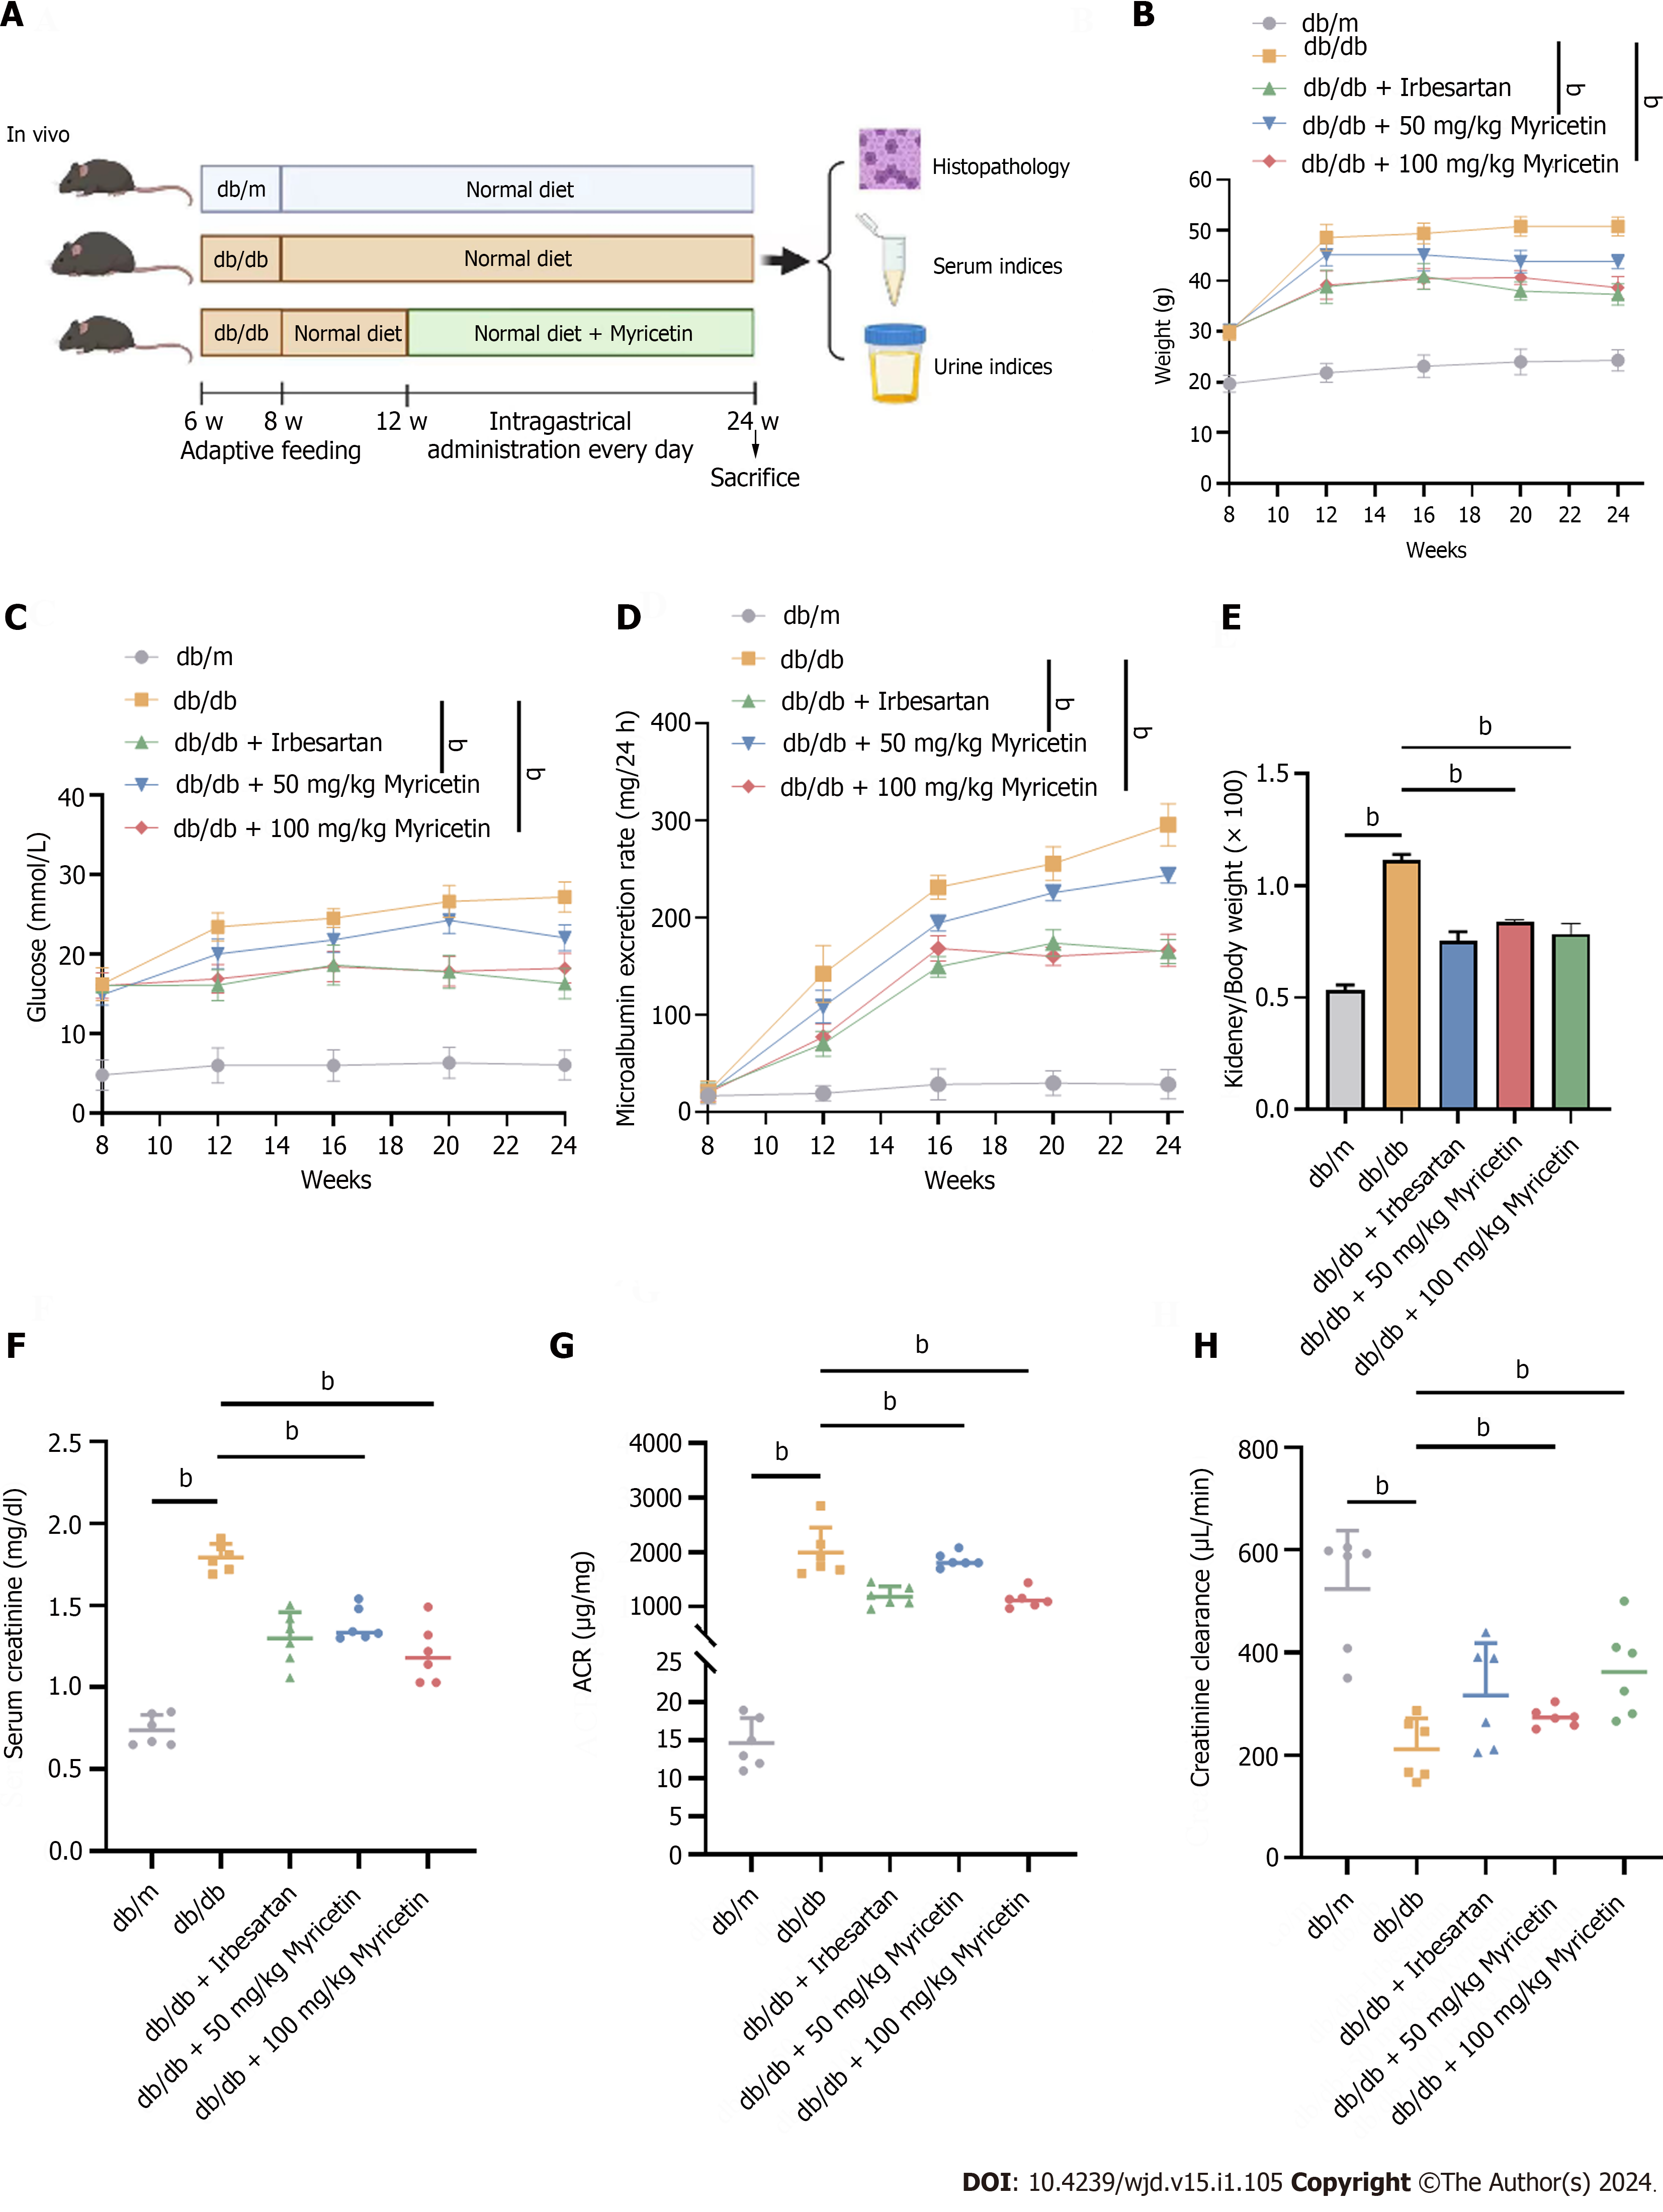
Figure 1 Myricetin alleviated the kidney injuries of diabetic nephropathy mice.
A: Timeline of in vivo assay; B: Body weights; C: Blood glucose levels; D: 24 h-microalbumin levels; E: Kidney/body weight ratios; F: Serum creatinine levels; G: Albumin-to-creatinine ratios; H: Creatinine clearance values. ACR: Albumin-to-creatinine ratio. bP < 0.05.
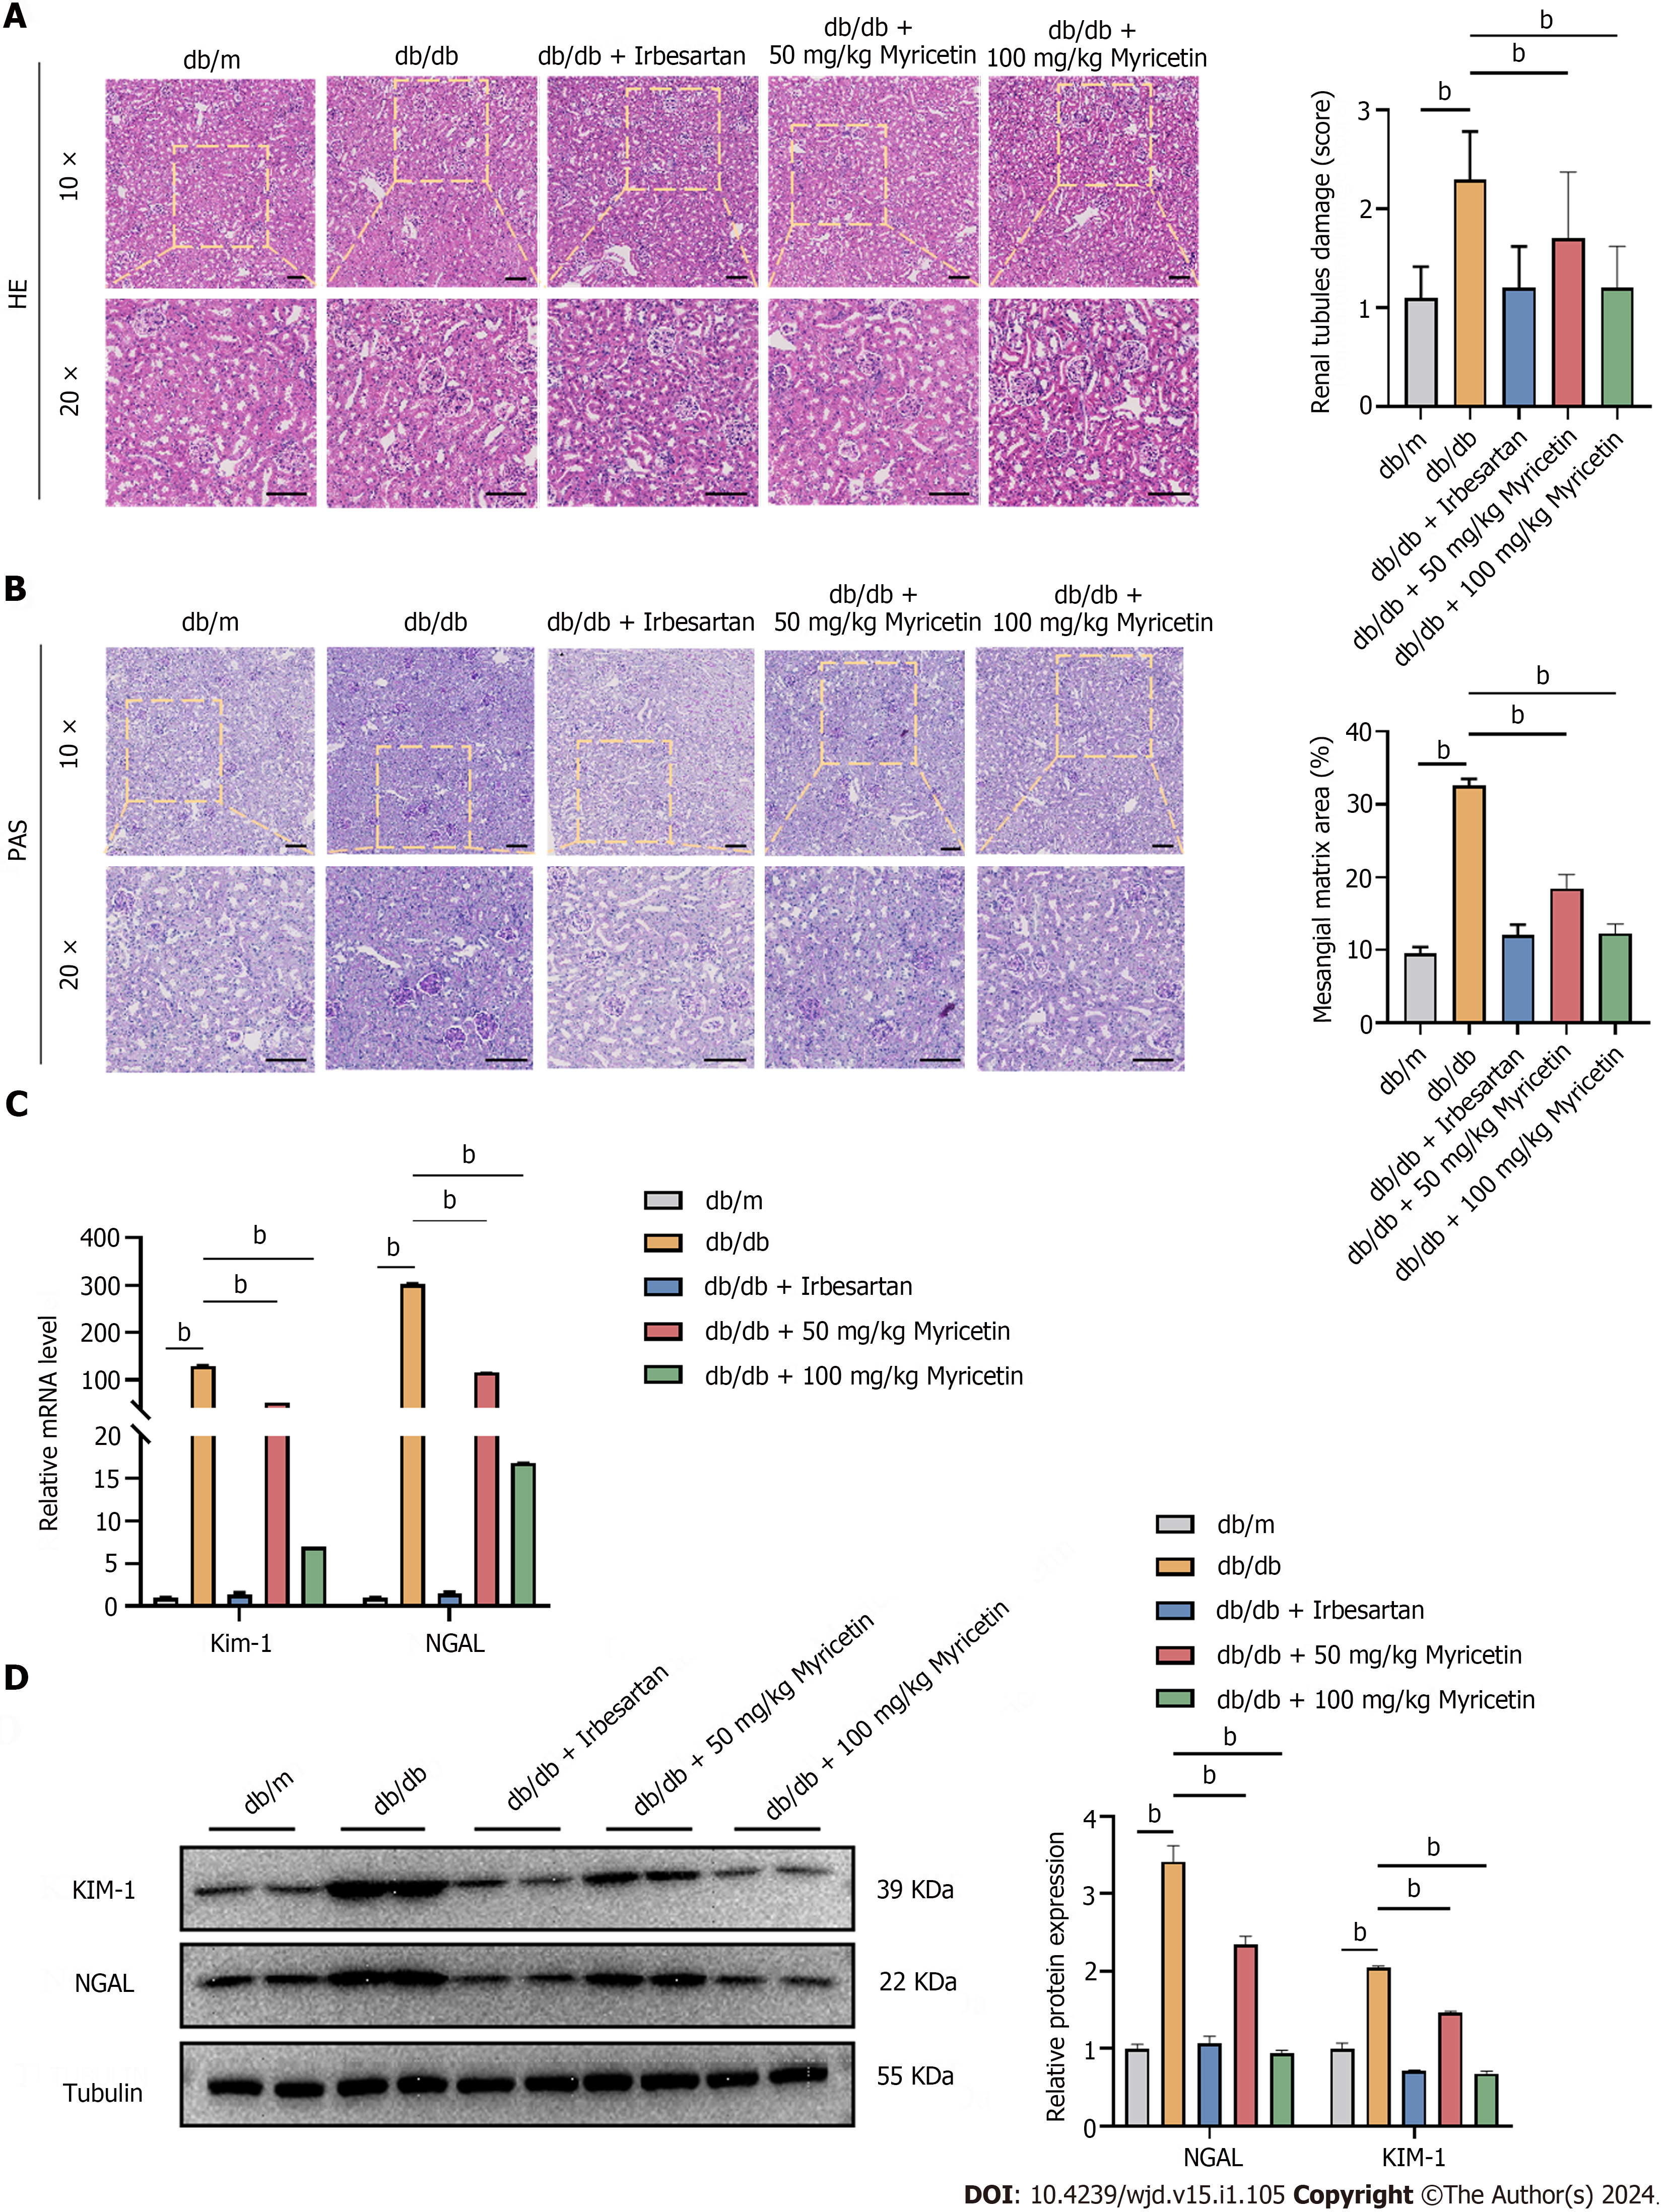
Figure 2 Myricetin ameliorated the renal histopathological changes of diabetic nephropathy mice.
A: Hematoxylin and eosin staining showing renal tubule damage analysis (left and right) of kidneys; B: Periodic acid-Schiff staining (left) and mesangial matrix analysis (right); C: Kidney injury molecule-1 (KIM-1) and neutrophil gelatinase associated lipocalin (NGAL) levels by reverse transcription-PCR; D: NGAL and KIM-1 Levels determined by western blotting. Scale bar: 100 μm. HE: Hematoxylin and eosin; PAS: Periodic acid-Schiff; KIM-1: Kidney injury molecule-1; NGAL: Neutrophil gelatinase associated lipocalin. bP < 0.05.
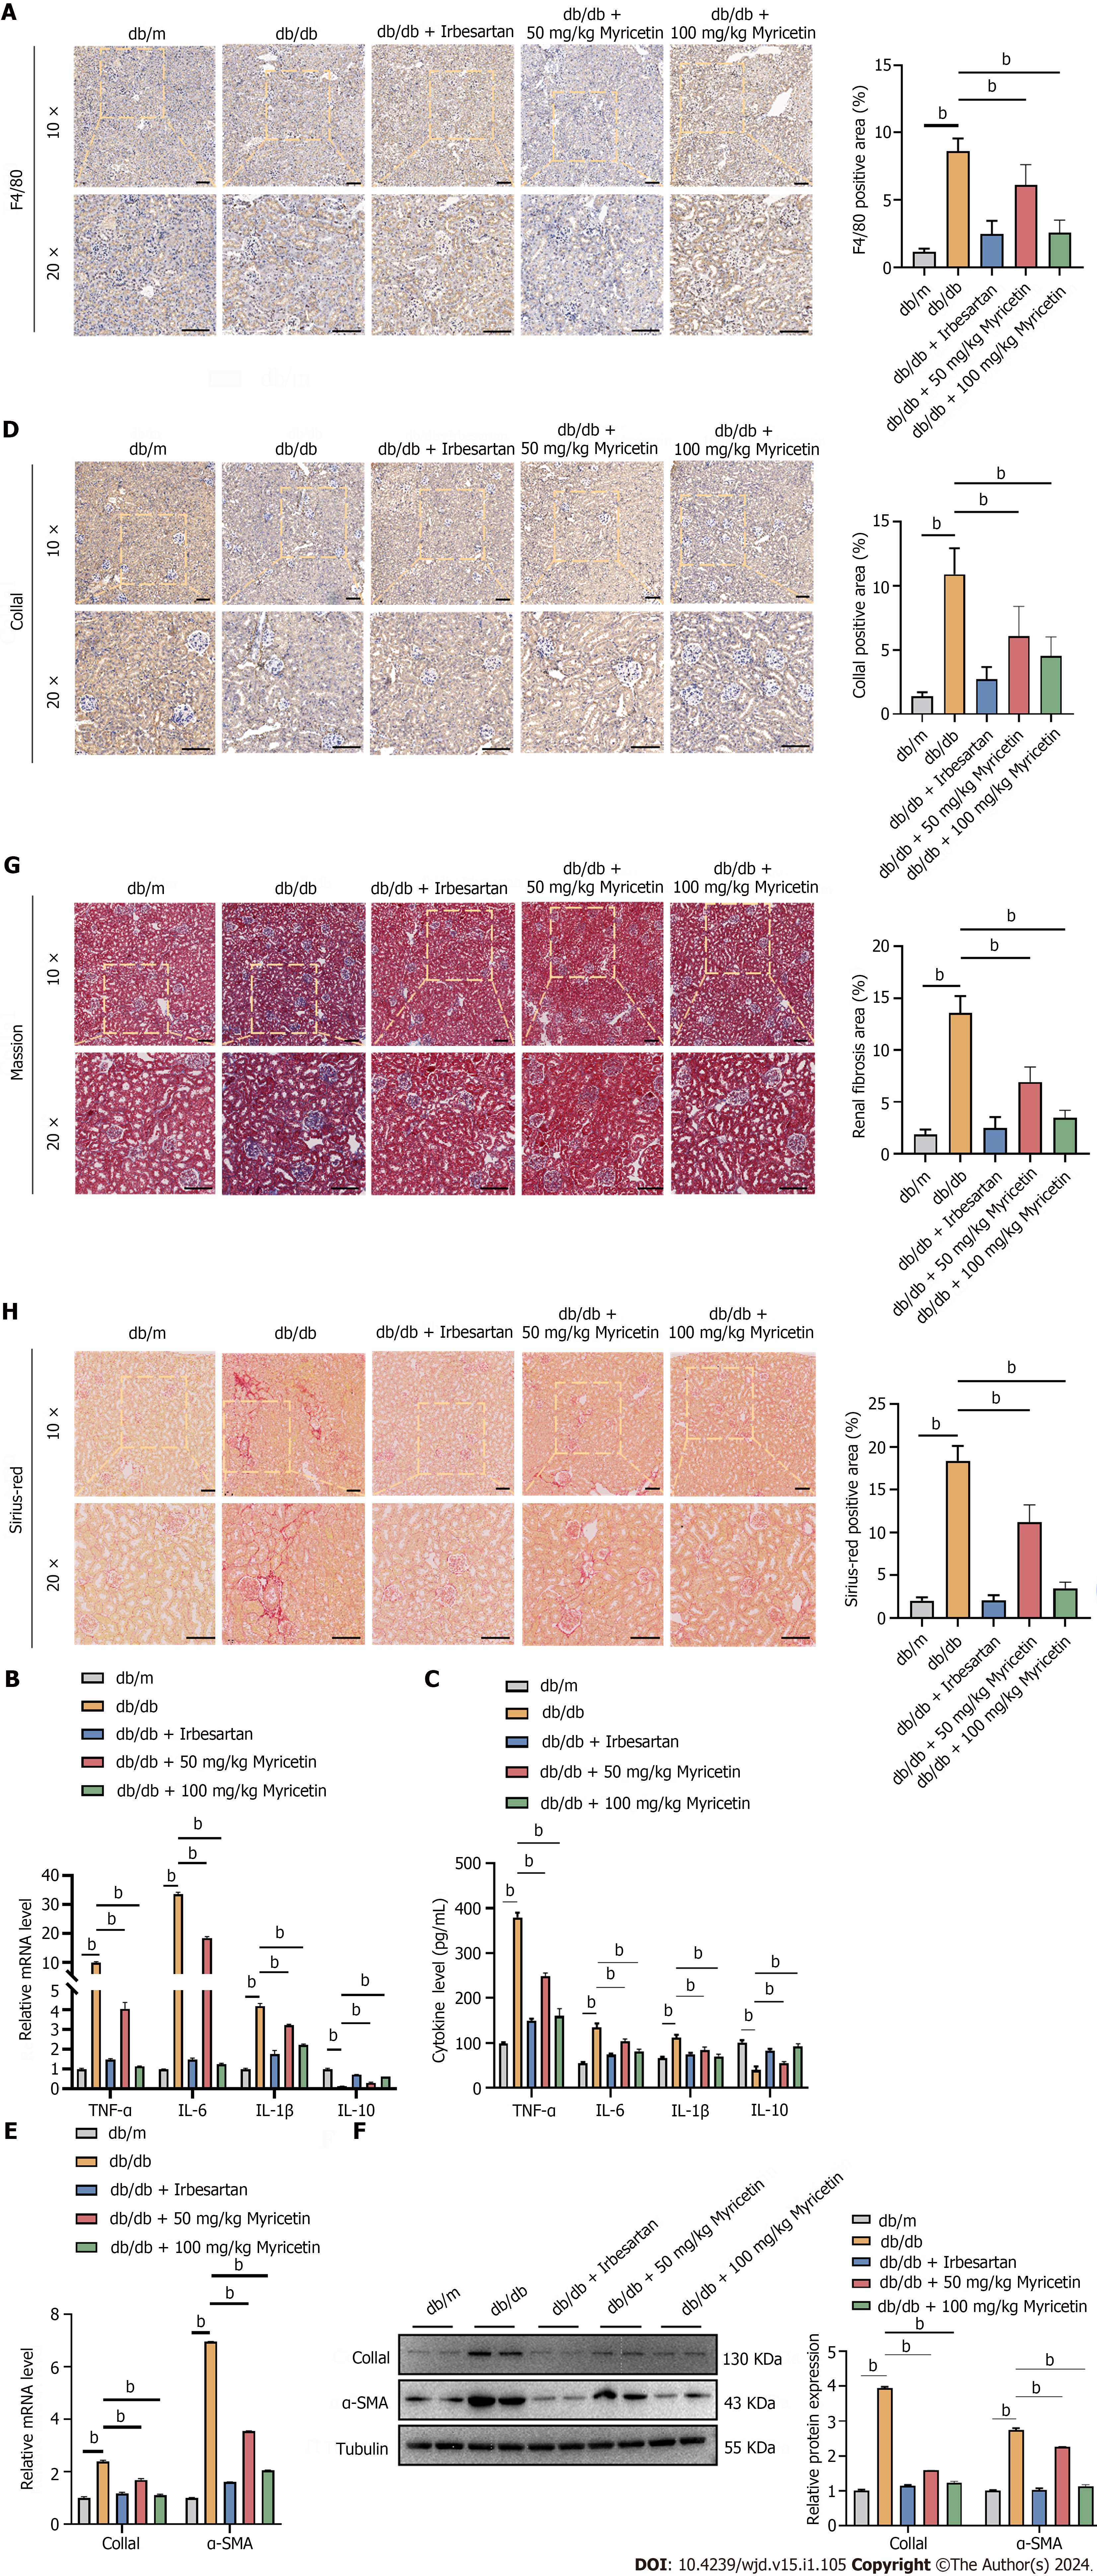
Figure 3 Myricetin inhibited inflammation factors and fibrosis in the renal tissue of diabetic nephropathy mice.
A: Immunofluorescent staining of F4/80 protein; B: Tumor necrosis factor-alpha (TNF-α), interleukin (IL)-6, IL-1β, and IL-10 mRNA levels; C: Serum TNF-α, IL-6, IL-1β, and IL-10 Levels; D: Immunofluorescent staining of collagen-1a1 (Col1a1) protein; E: Reverse transcription-PCR analysis of Col1a1 and alpha-smooth muscle actin (α-SMA) mRNAs; F: Western blotting analysis of Col1a1 and α-SMA proteins; G: Masson’s trichrome staining (left) and renal fibrosis analysis (right); H: Sirius-red staining (left) and fibrosis analysis (right). TNF-α: Tumor necrosis factor-alpha; α-SMA: Alpha-smooth muscle actin; IL: Interleukin; Col1a1: Collagen-1a1. bP < 0.05.
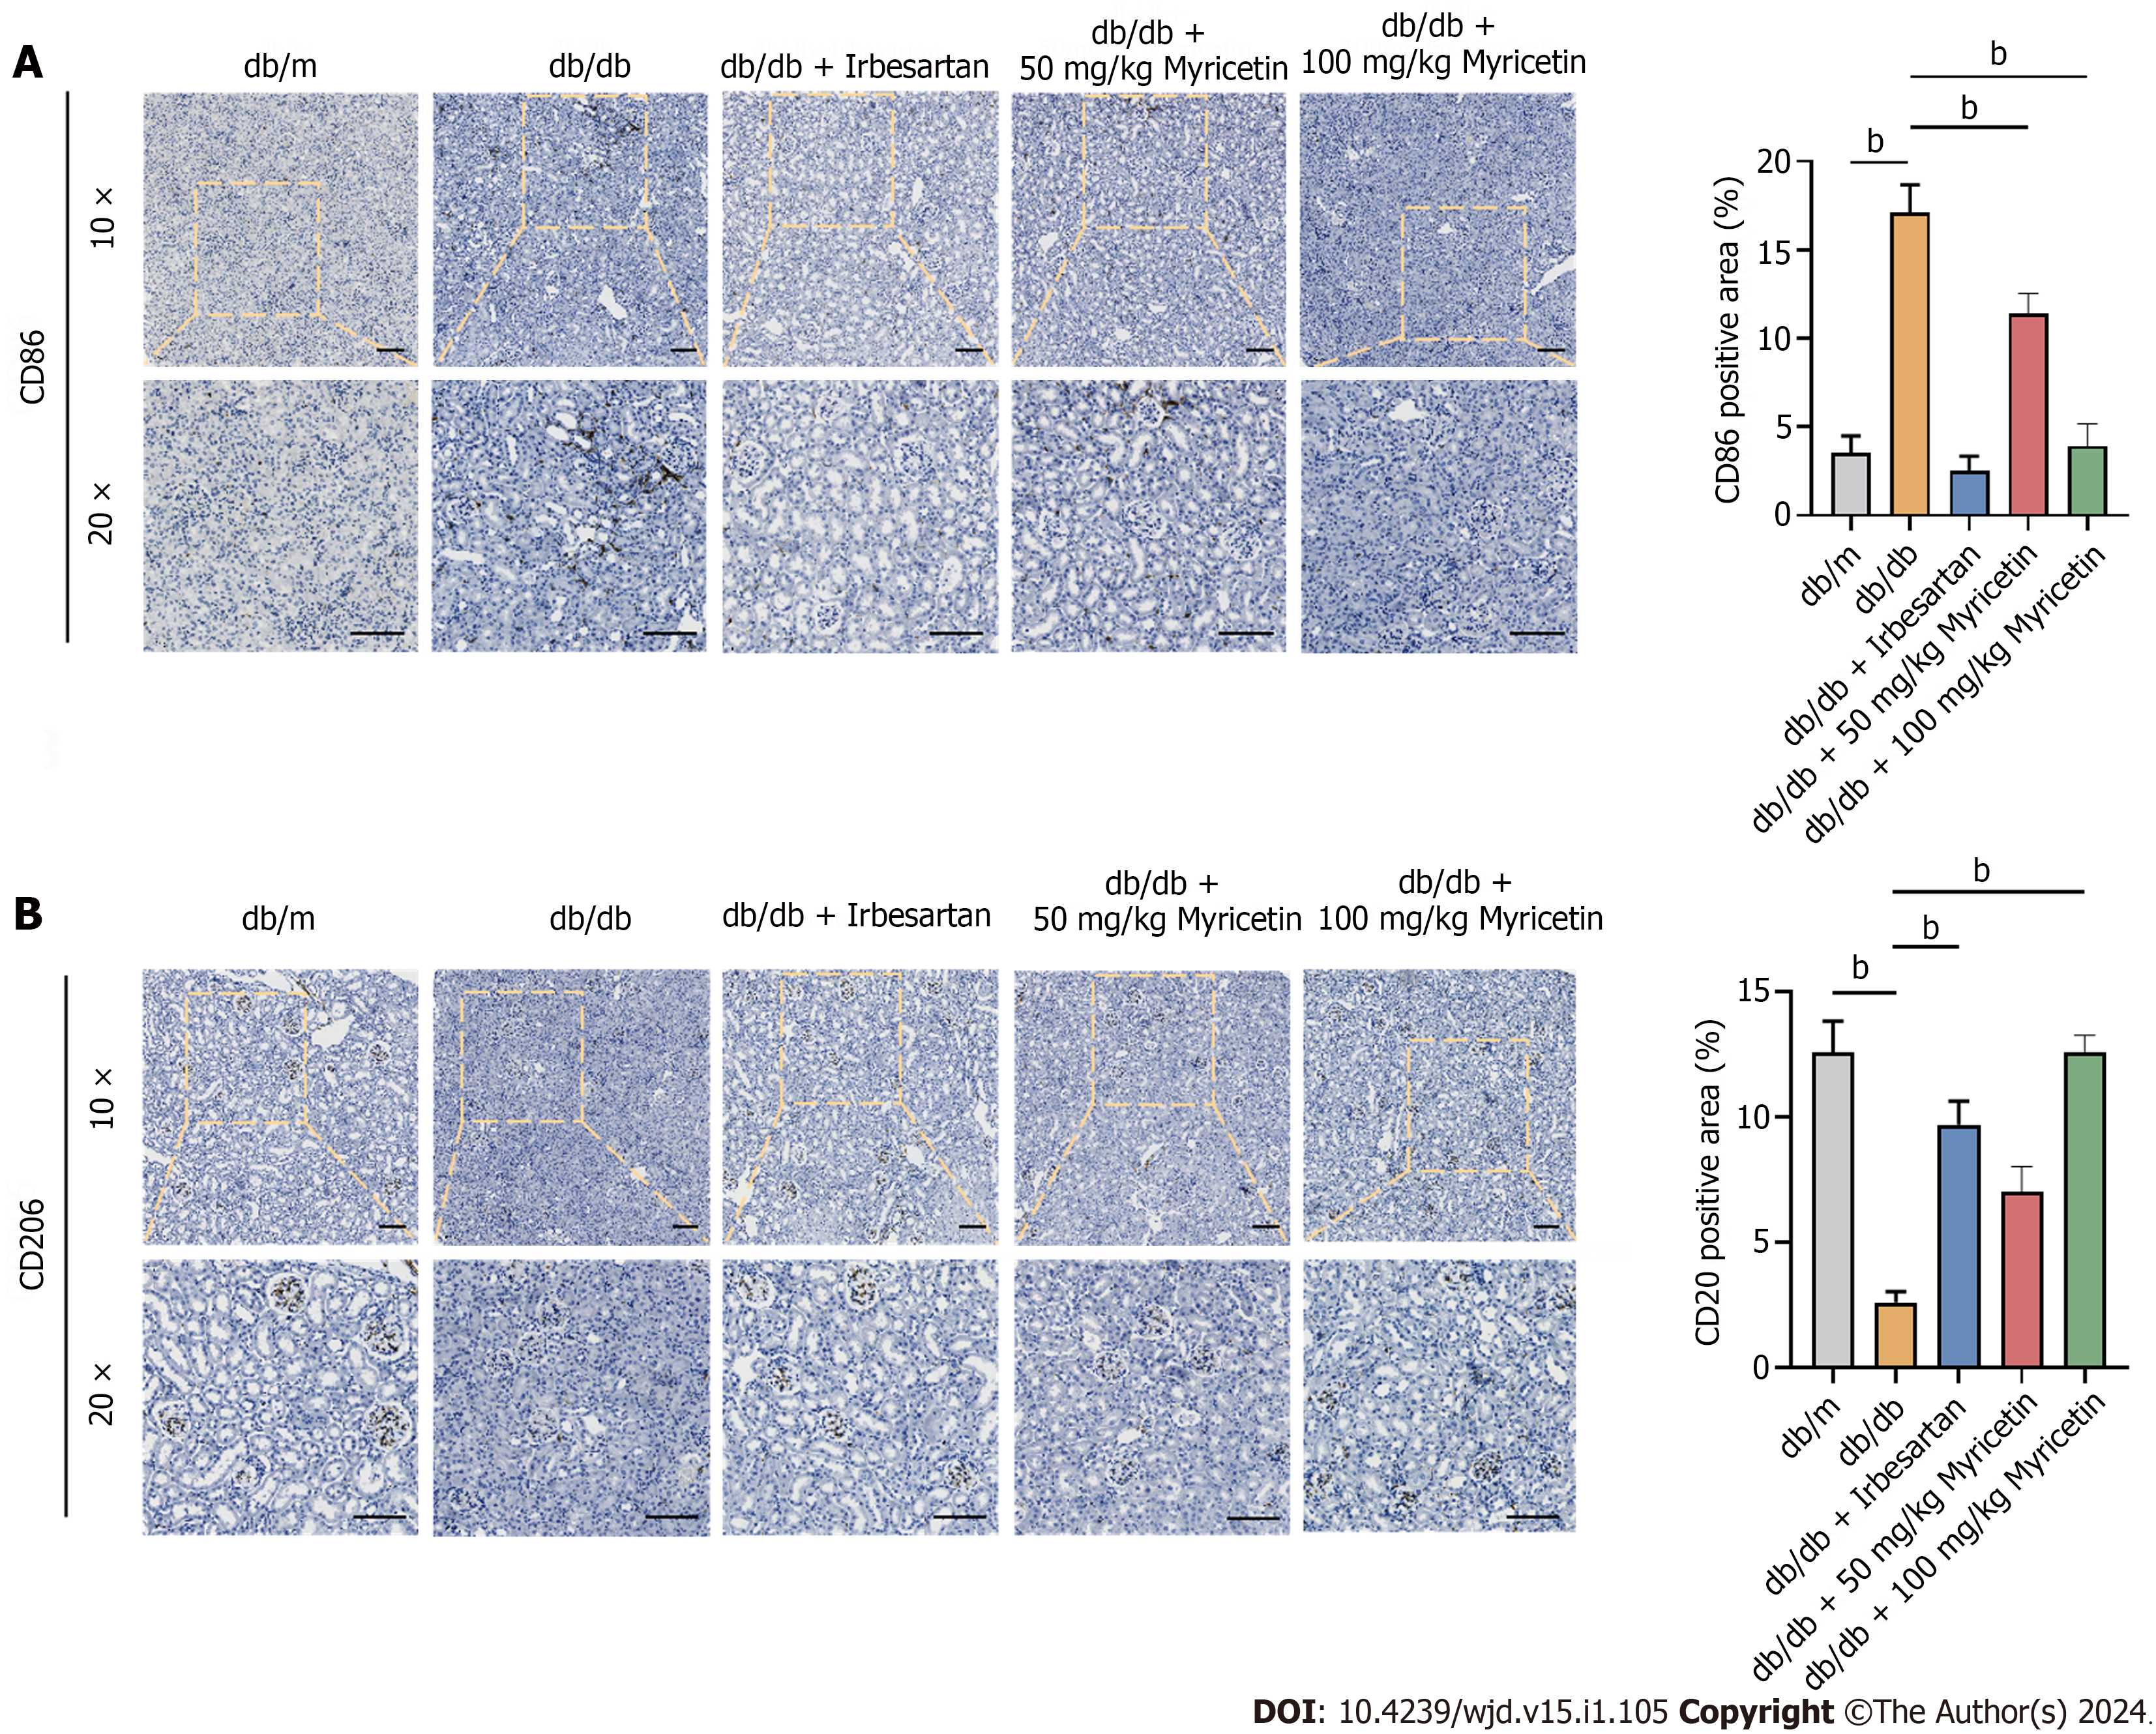
Figure 4 Myricetin switched the phenotype of macrophages in renal tissues of db/db mice.
A and B: Immunofluorescent staining of CD86 protein (A) and CD206 protein. Scale bar: 100 μm. bP < 0.05.
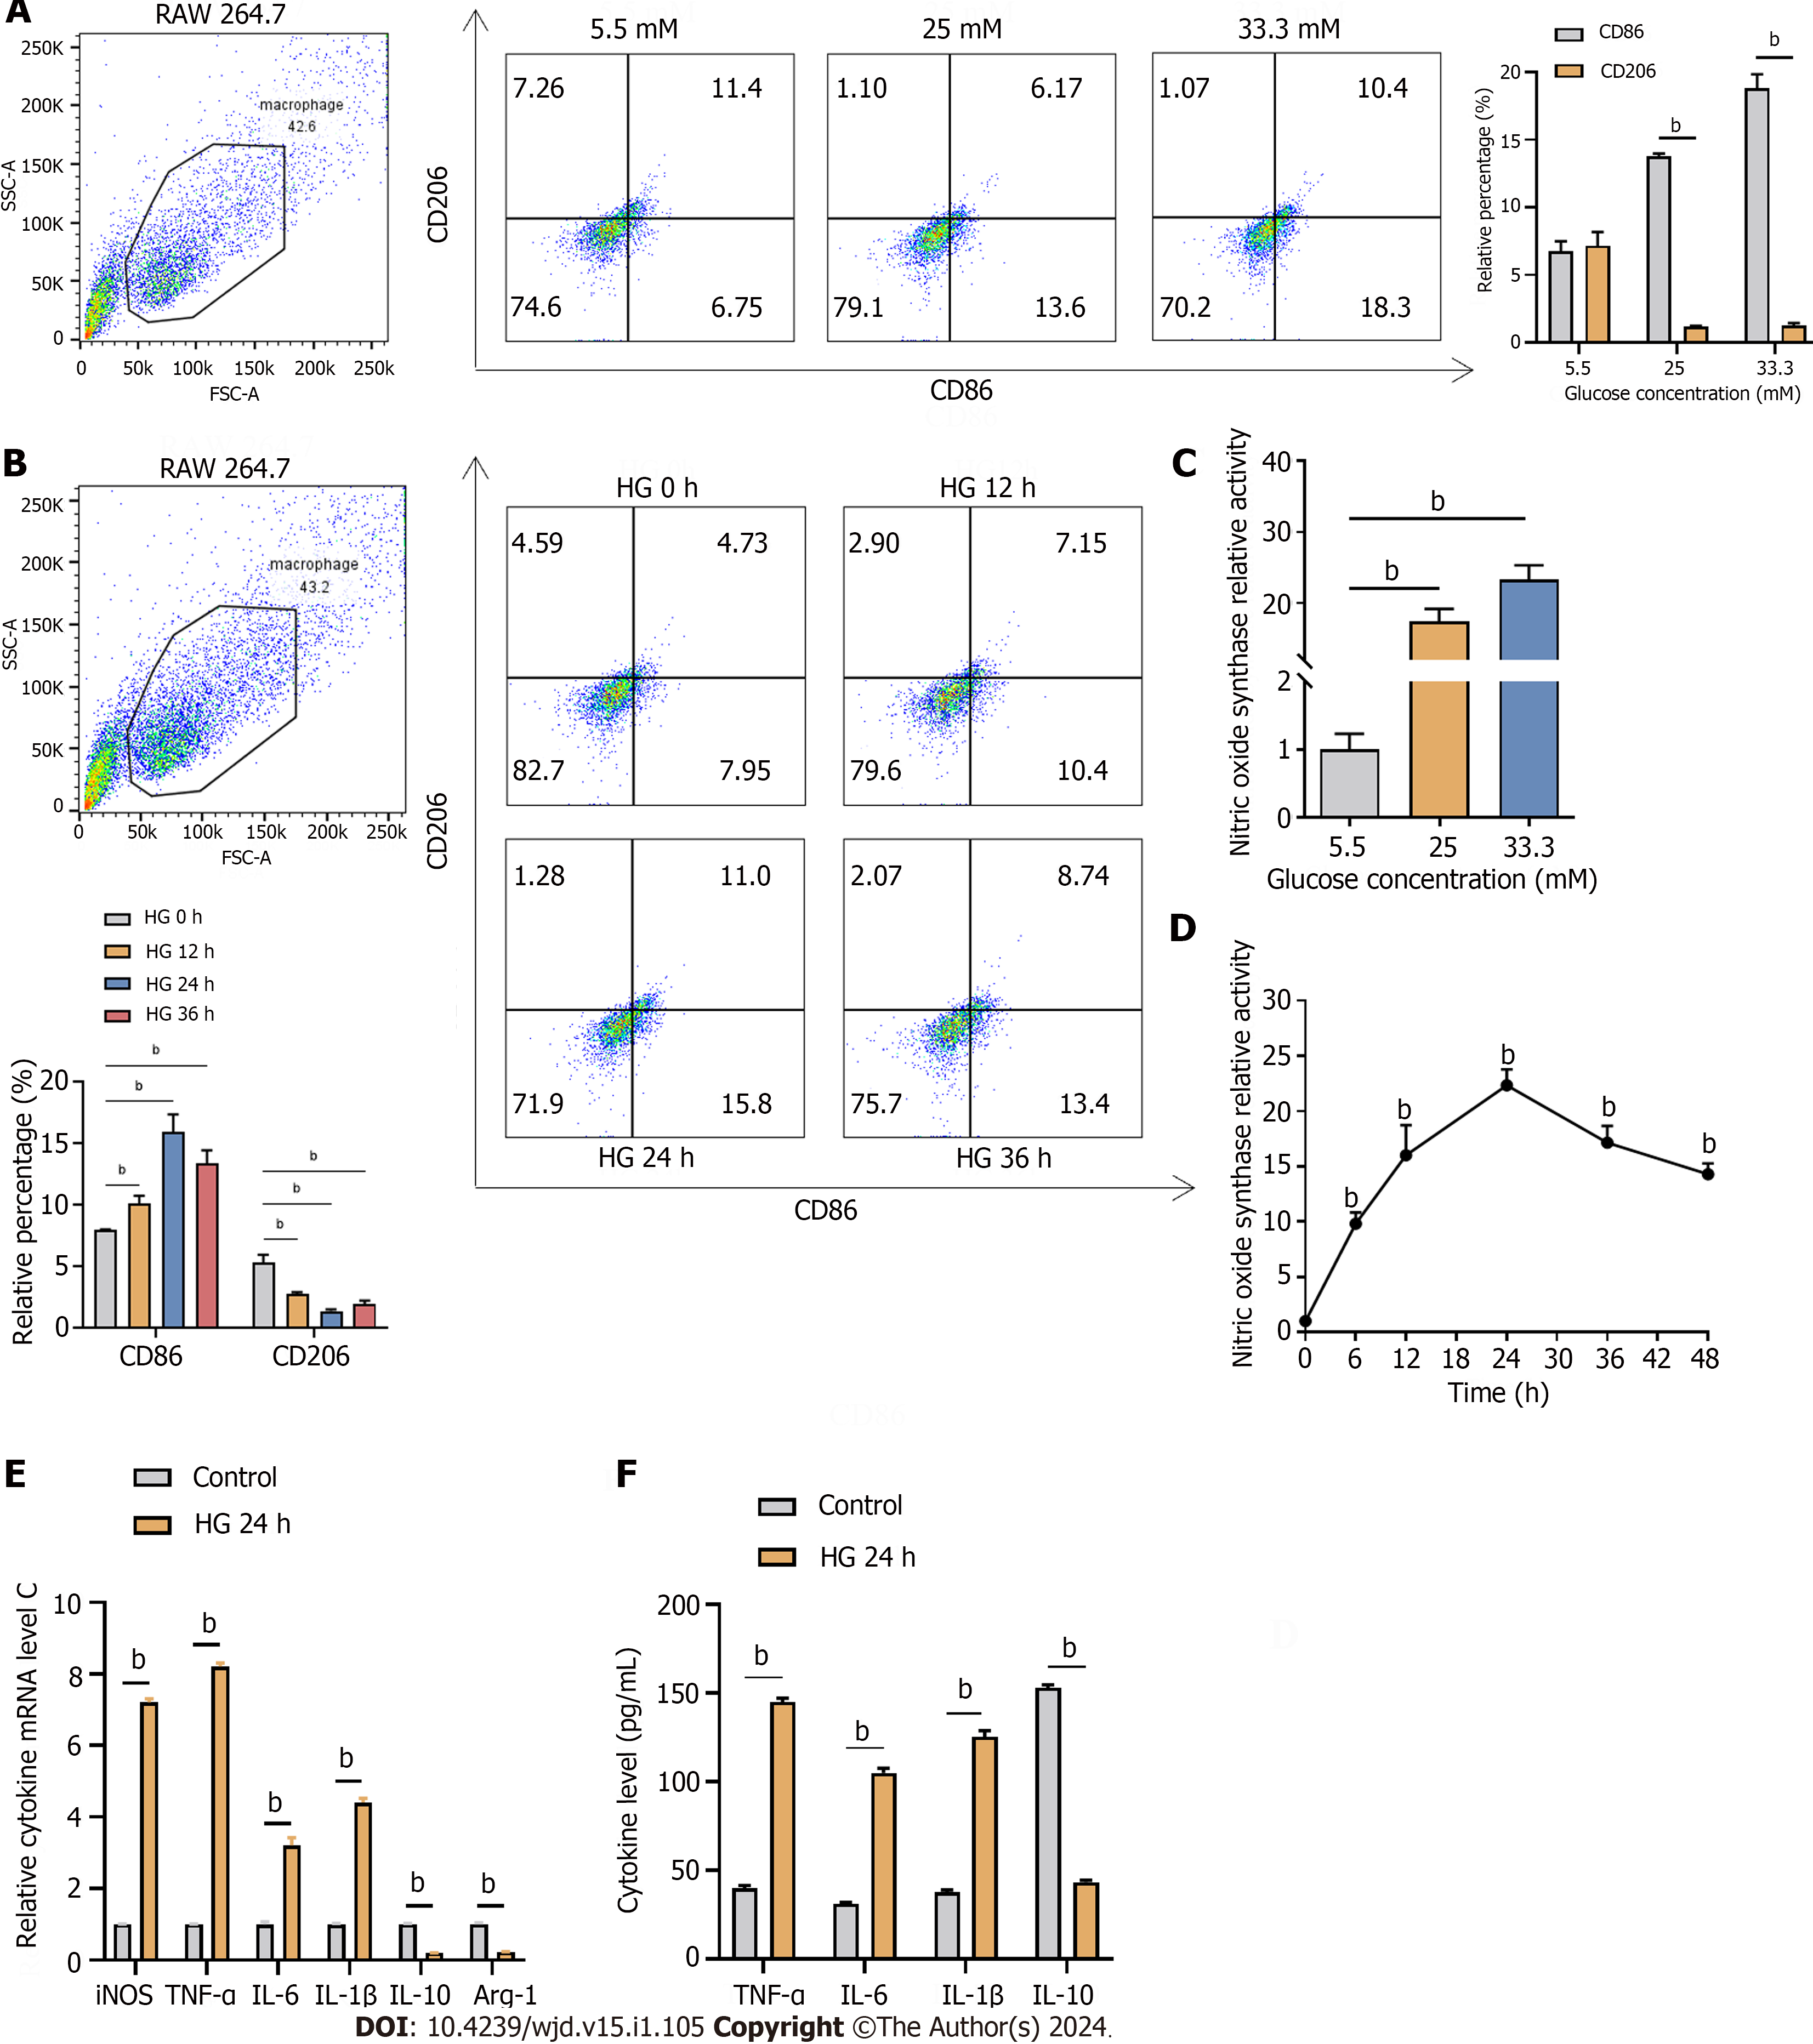
Figure 5 High glucose induced the M1 macrophage polarization of RAW 264.
7 cells. A and B: Flow cytometry analysis of RAW 264.7 macrophages labeled with CD86 and CD206 exposed to different concentrations of glucose (A) and to 33.3 mmol/L glucose for different times (B); C and D: Inducible nitric oxide synthase (iNOS) levels induced by different concentrations of glucose (C) and by 33.3 mmol/L glucose for different times (D); E and F: Relative cytokine mRNA (E) and protein (F) levels of iNOS, tumor necrosis factor-alpha, interleukin (IL)-6, IL-1β, IL-10, and arginase-1 after exposure to 33.3 mmol/L glucose for 24 h detected by reverse transcription-PCR (E) and western blotting (F). Arg-1: Arginase-1; TNF-α: Tumor necrosis factor-alpha; IL: Interleukin; iNOS: Inducible nitric oxide synthase; HG: High-glucose. bP < 0.05.
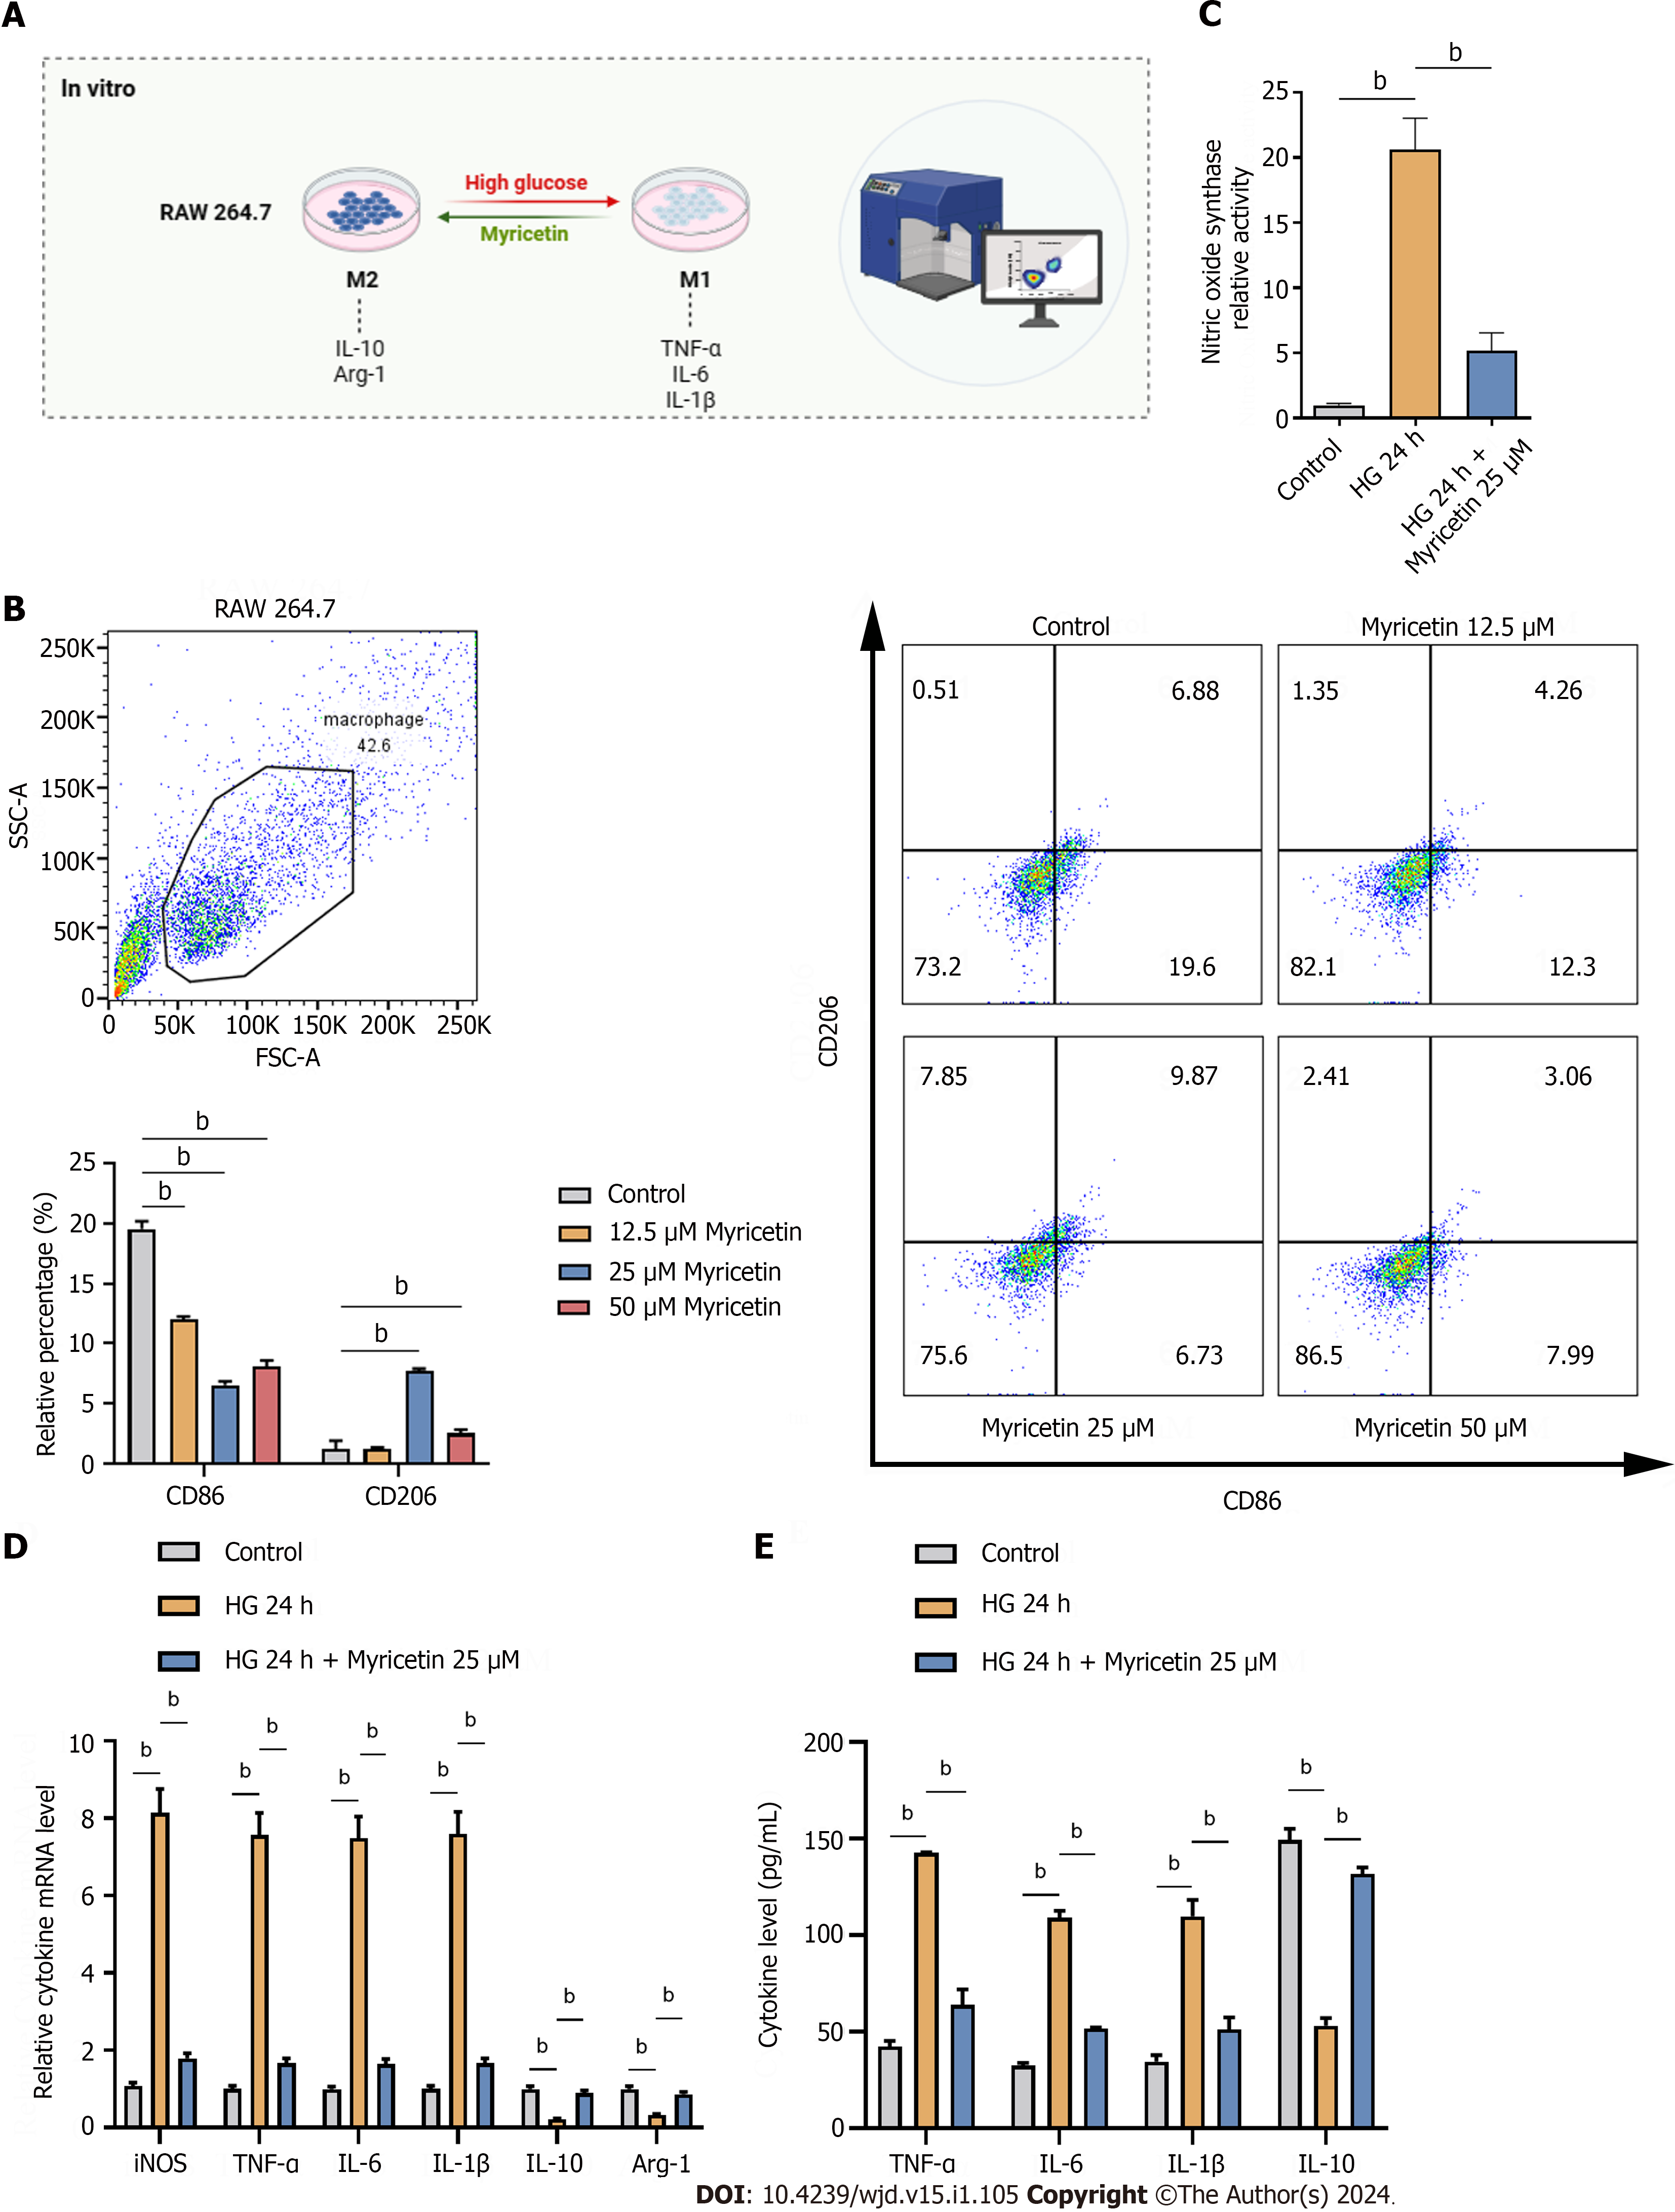
Figure 6 Myricetin regulated the polarization of RAW 264.
7 cells to M2-type induced by high glucose. A: In vitro assay; B: Flow cytometry analysis of CD86-labeled and CD206-labeled RAW 264.7 macrophages induced with 33.3 mmol/L glucose and different concentration of myricetin; C: Levels of inducible nitric oxide synthase (iNOS) induced by 33.3 mmol/L glucose and after treatment with 25 μM of myricetin detected by ELISA; D and E: Levels of iNOS, tumor necrosis factor-alpha, interleukin (IL)-6, IL-1β, IL-10 and arginase-1 mRNAs (D) and proteins (E) induced with 33.3 mmol/L glucose and after treatment with 25 μM of myricetin detected by reverse transcription-PCR (D) and western blotting (E). Arg-1: Arginase-1; TNF-α: Tumor necrosis factor-alpha; IL: Interleukin; iNOS: Inducible nitric oxide synthase; HG: High-glucose. bP < 0.05.
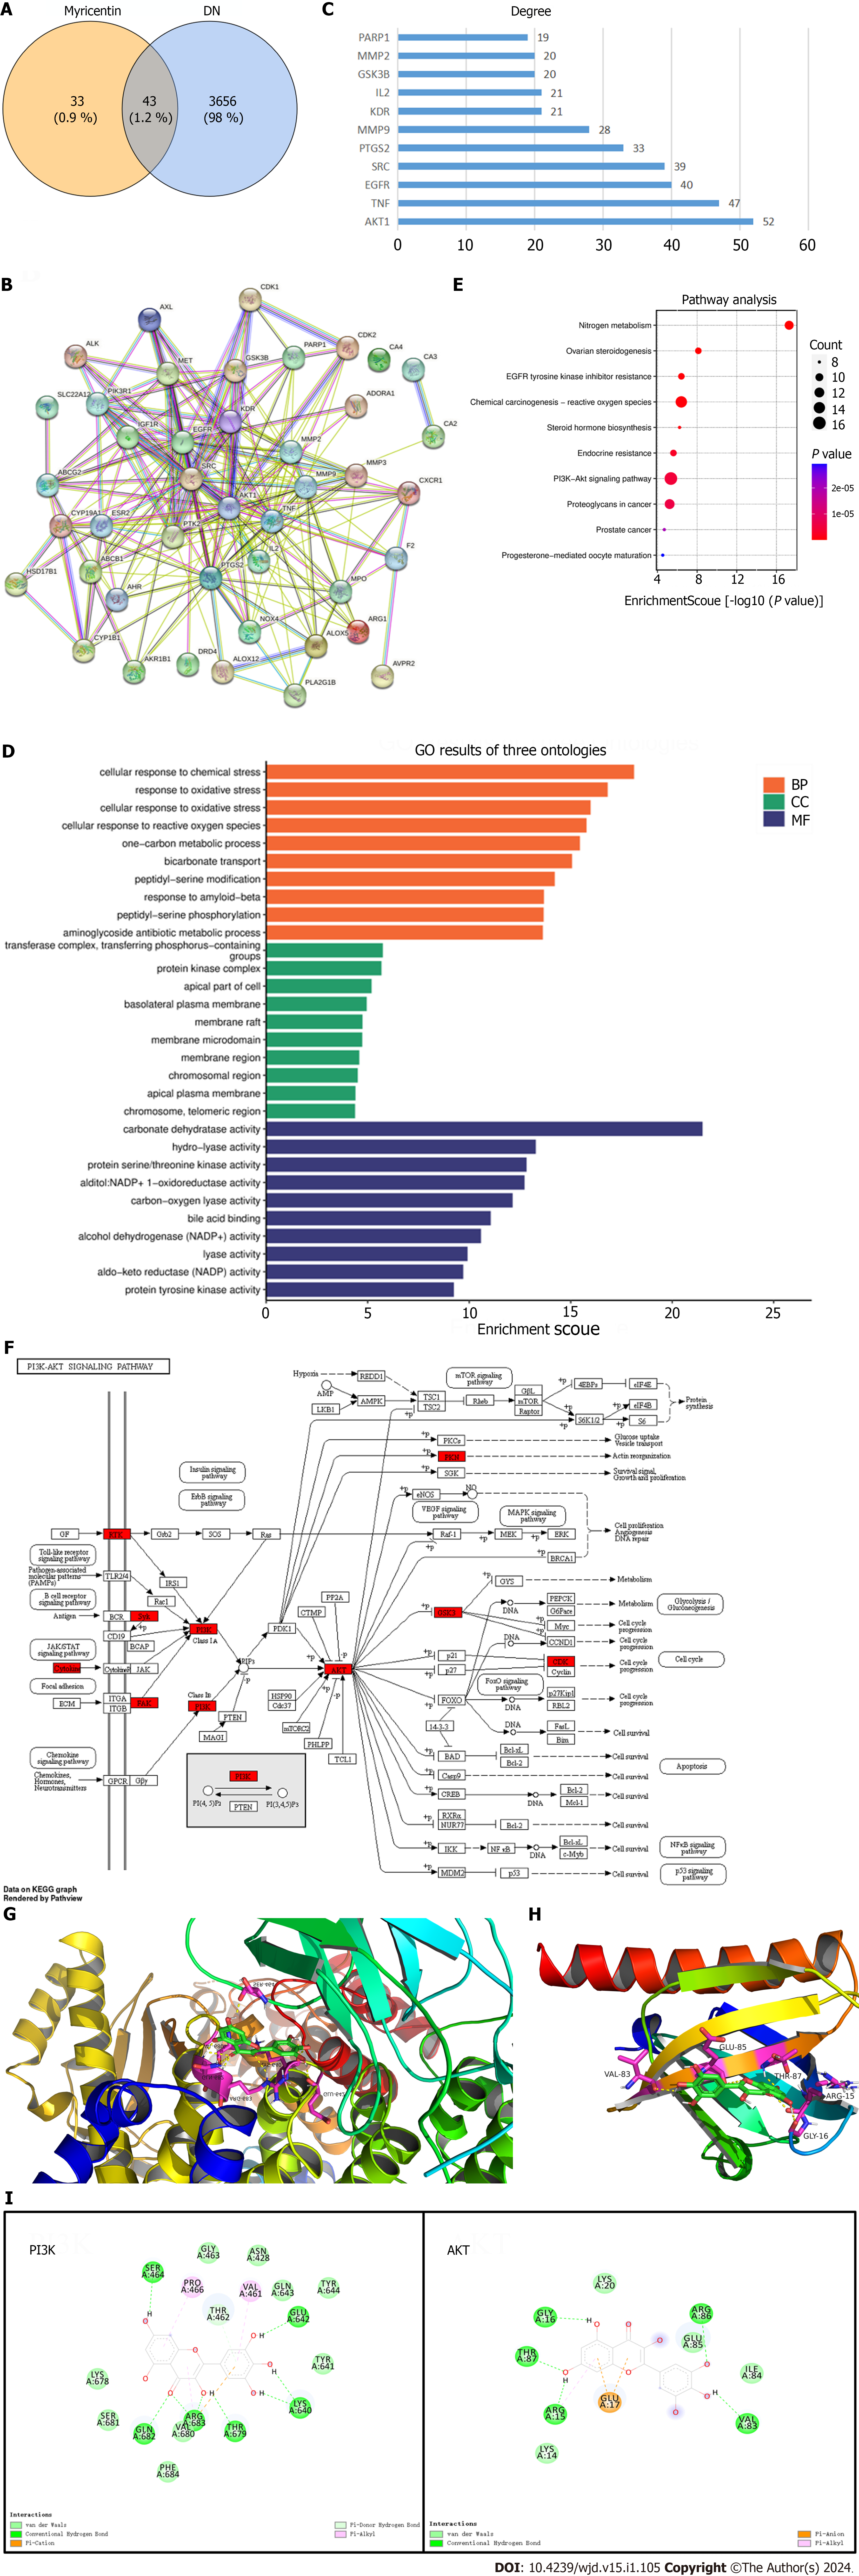
Figure 7 Identification of potential targets of diabetic nephropathy and myricetin using bioinformatics analysis.
A: Venn diagrams; B: Protein-protein interaction network of myricetin and diabetic nephropathy targets, in which edge points represent protein interactions and line thickness indicates data strength; C: Myricetin's key target gene for treating diabetic nephropathy; D: Potential targets for myricetin treatment of diabetic nephropathy from the Gene Ontology algorithm; E: Myricetin treatment pathways from the Kyoto Encyclopedia of Genes and Genomes database; F: Signaling pathway of PI3K-Akt; G and H: The 3D structures of the docking mode of myricetin and PI3K (G) and myricetin and Akt (H); I: Visualization of the binding abilities of myricetin with PI3K and Akt. DN: Diabetic nephropathy.
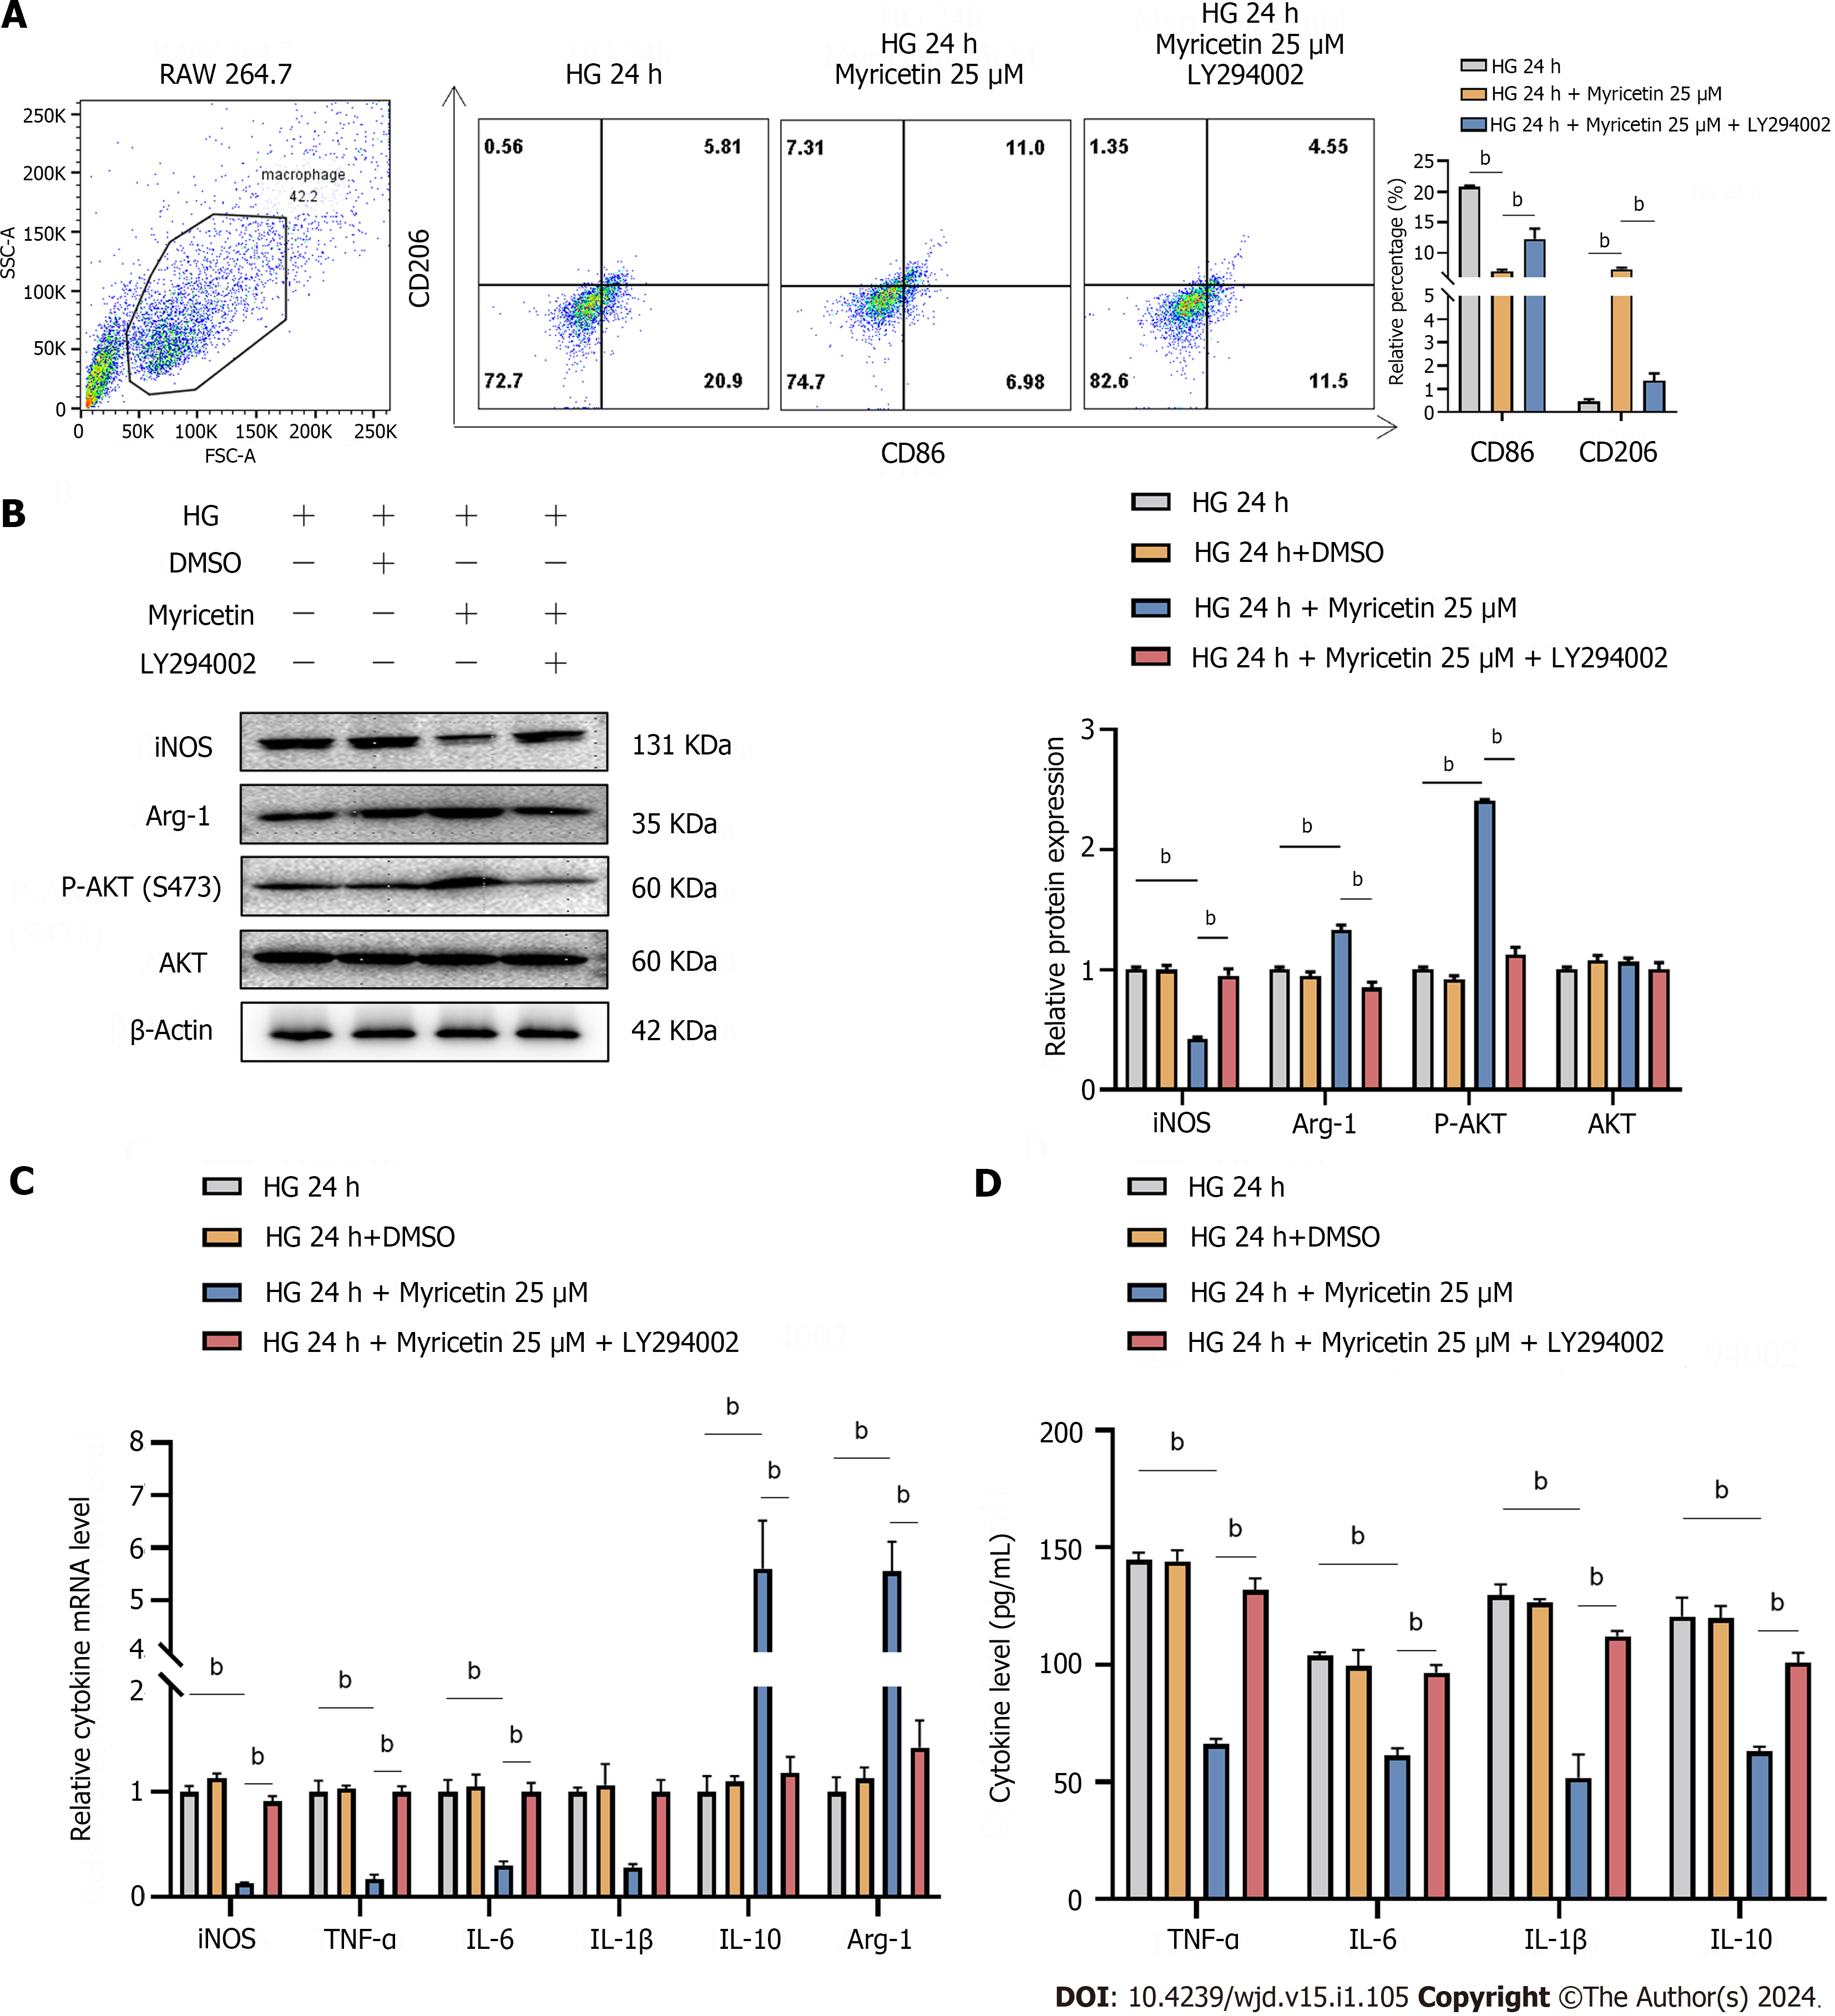
Figure 8 Myricetin regulated the polarization of RAW 264.
7 cells through the PI3K/Akt signaling pathway in diabetic nephropathy mice. A-D: CD86-labeled and CD206-labeled RAW 264.7 macrophages under the 33.3 mmol/L glucose condition and after 25 μM myricetin treatment and LY294002 administration assessed by flow cytometry (A) and for protein levels of inducible nitric oxide synthase (iNOS), arginase-1 (Arg-1), phosphorylated-Akt (at S473) and Akt by western blotting (B) or mRNA levels of iNOS, tumor necrosis factor-alpha, interleukin (IL)-6, IL-1β, IL-10, and Arg-1 by reverse transcription PCR (C), and for secreted levels of TNF-α,IL-6, IL-1β, and IL-10 by ELISA. Arg-1: Arginase-1; TNF-α: Tumor necrosis factor-alpha; IL: Interleukin; iNOS: Inducible nitric oxide synthase; HG: High-glucose. bP < 0.05.
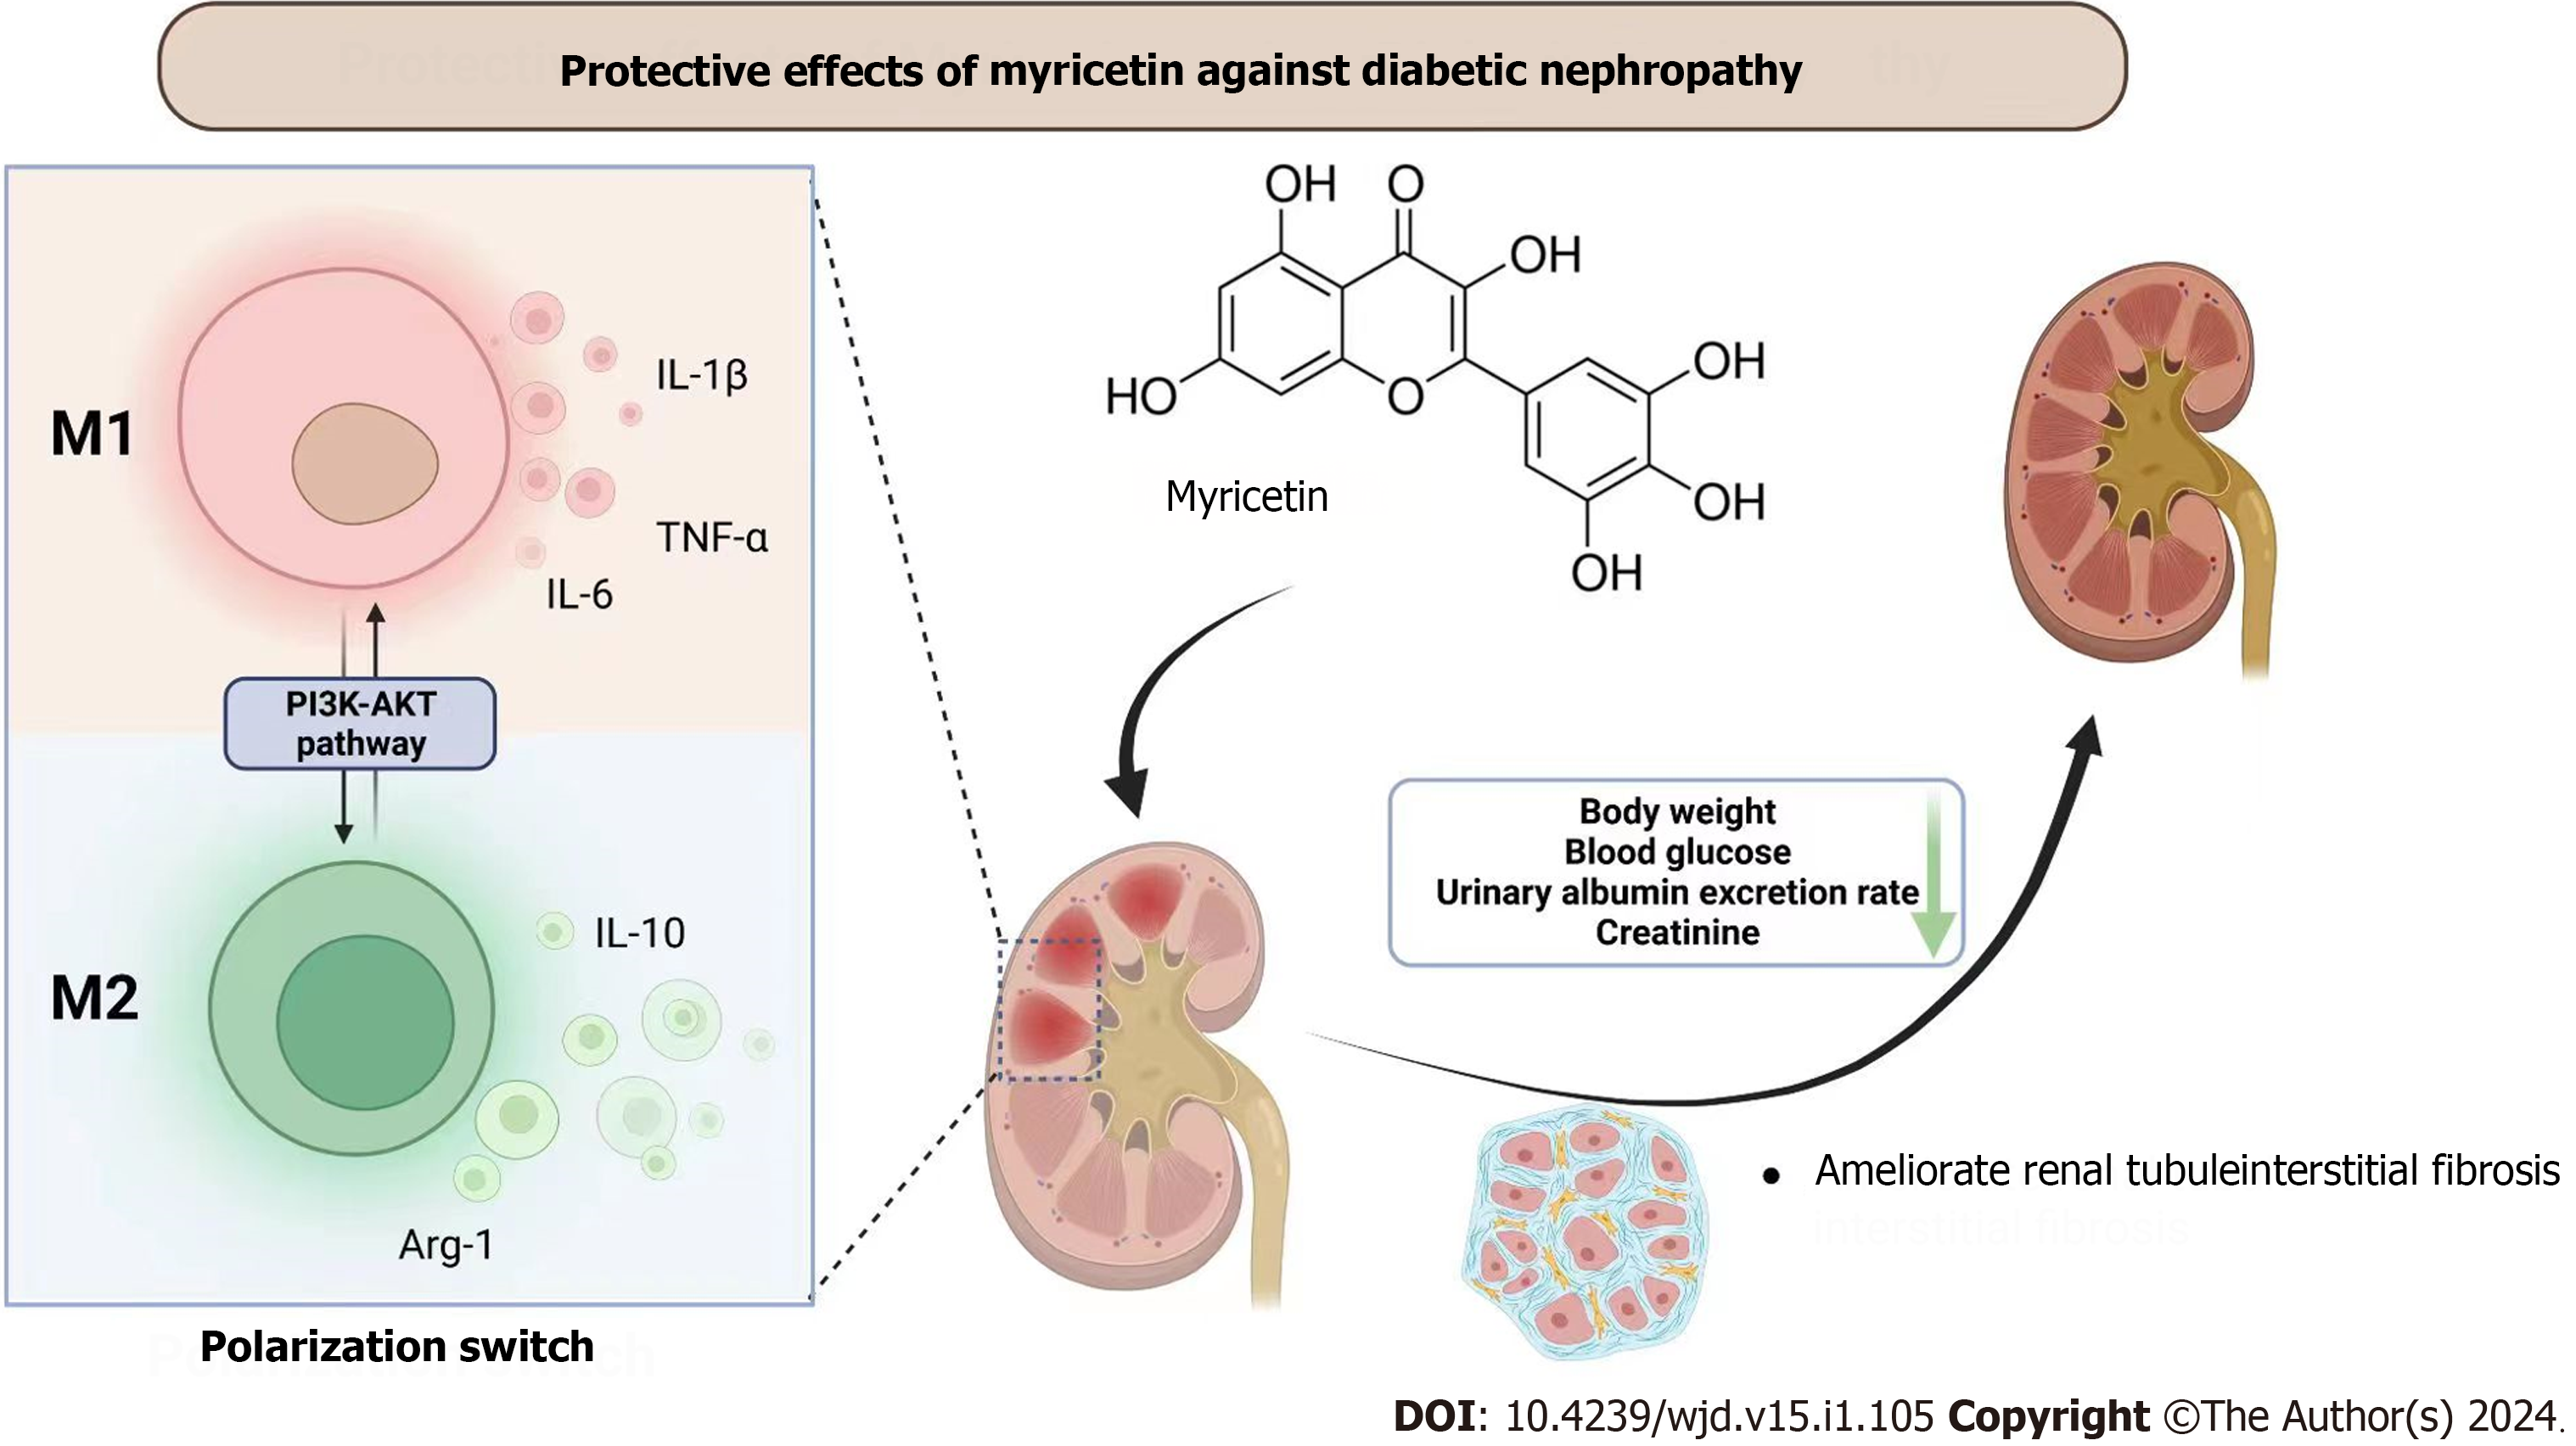
Figure 9 Overview of protective effects of myricetin against diabetic nephropathy.
Myricetin can regulate the polarization of macrophages through the PI3K/Akt signaling pathway to ameliorate the injuries of kidneys in mice with diabetic nephropathy. Arg-1: Arginase-1; TNF-α: Tumor necrosis factor-alpha; IL: Interleukin.
- Citation: Xu WL, Zhou PP, Yu X, Tian T, Bao JJ, Ni CR, Zha M, Wu X, Yu JY. Myricetin induces M2 macrophage polarization to alleviate renal tubulointerstitial fibrosis in diabetic nephropathy via PI3K/Akt pathway. World J Diabetes 2024; 15(1): 105-125
- URL: https://www.wjgnet.com/1948-9358/full/v15/i1/105.htm
- DOI: https://dx.doi.org/10.4239/wjd.v15.i1.105


