Copyright
©The Author(s) 2023.
World J Diabetes. Aug 15, 2023; 14(8): 1234-1248
Published online Aug 15, 2023. doi: 10.4239/wjd.v14.i8.1234
Published online Aug 15, 2023. doi: 10.4239/wjd.v14.i8.1234
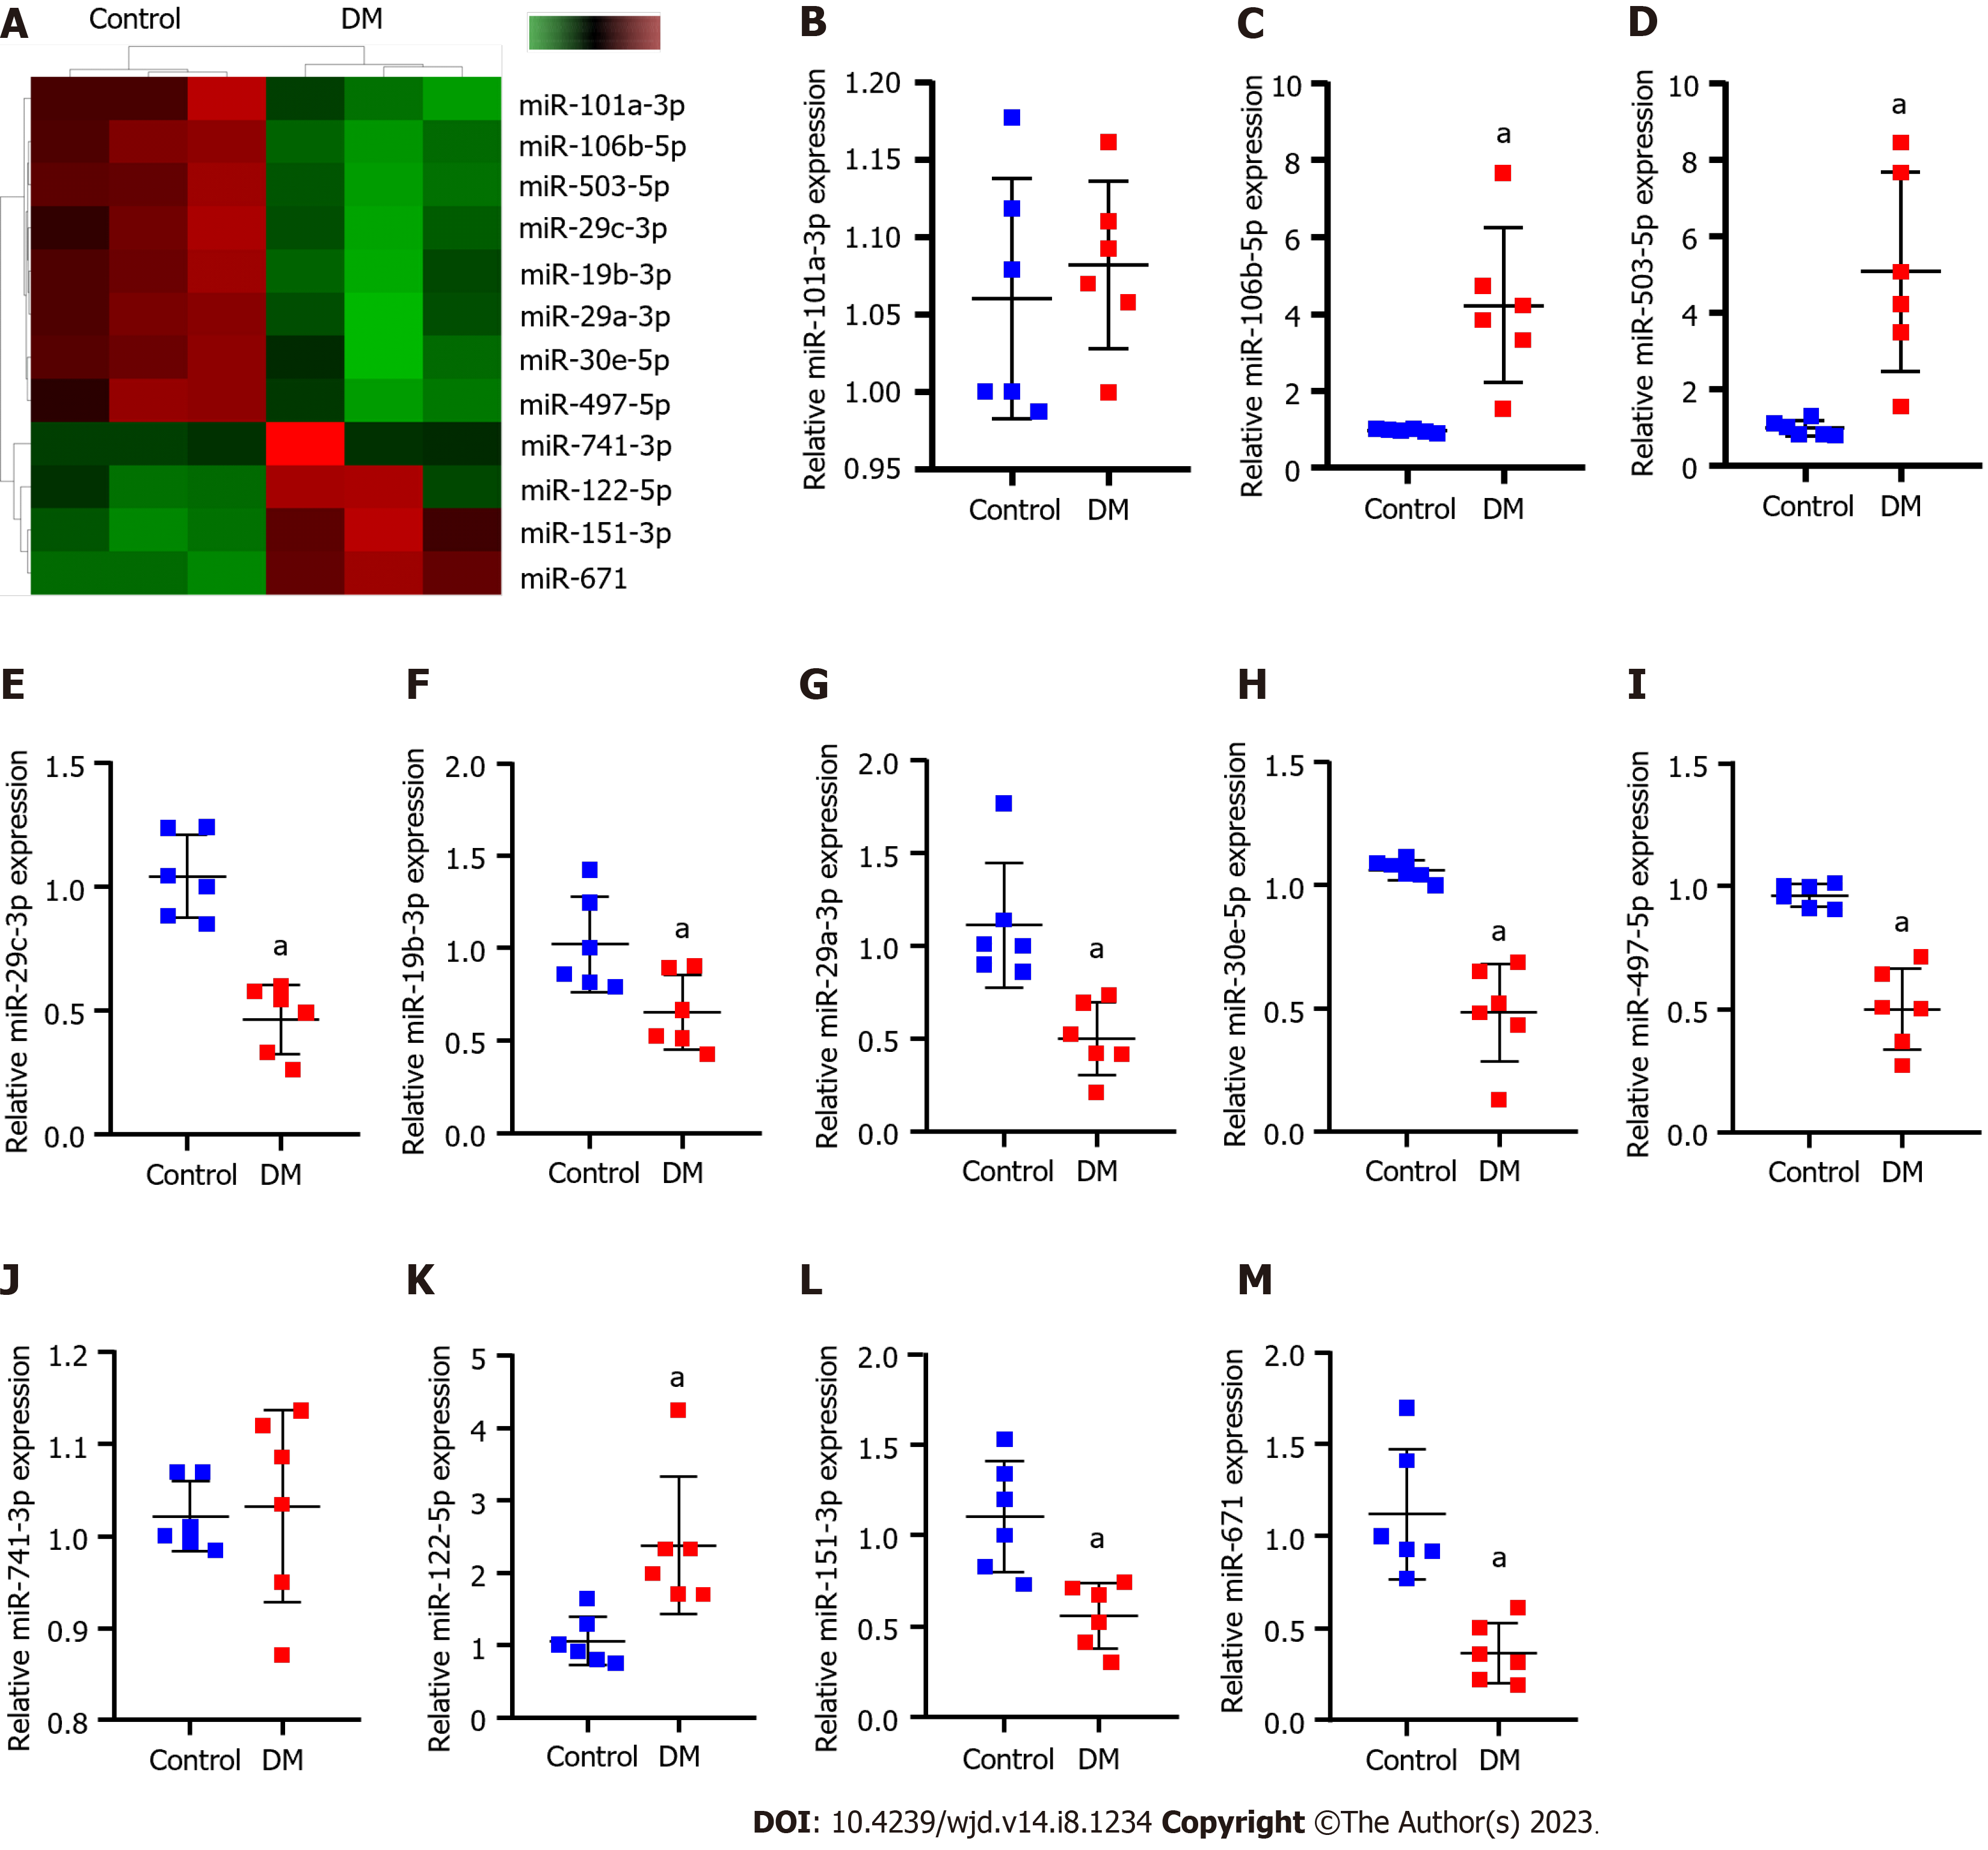
Figure 1 Differentially expressed miRNAs that affect diabetic nephropathy progression.
A: High-throughput sequencing analysis of the differences between the diabetes mellitus rats and normal rats concerning expressed miRNAs. In the heatmap, green squares indicate low expression and red squares indicate high expression; B-M: Real-time quantitative polymerase chain reaction verification of differentially expressed miR-151-3p, miR-19b-3p (B), miR-106b-5p (C), miR-30e-5p (D), miR-122-5p (E), miR-29a-3p (F), miR-29c-3p (G), miR-497-5p (H), miR-101a-3p (I), miR-741-3p (J), miR-503 (K), miR-671 (L), obtained by high-throughput sequencing (M). aP < 0.05 vs the control group. DM: Diabetes mellitus; miR: microRNA; RT-qPCR: Real-time quantitative polymerase chain reaction.
Figure 2 Effect of Icariin on high glucose treatment.
A: Immunofluorescence analysis of vimentin/α-smooth muscle actin (α-SMA) expression in primary rat kidney (PRKs). Blue denotes 4',6-diamidino-2-phenylindole staining, green denotes vimentin expression, and red denotes α-SMA expression; B: Real-time quantitative polymerase chain reaction (RT-qPCR) analysis of the effect of high glucose (HG) treatment on the expression of miR-151-3p, miR-19b-3p, miR-106b-5p, miR-30e-5p, miR-122-5p, miR-29a-3p, miR-29c-3p, miR-497-5p, miR-101a-3p, miR-741-3p, miR-503, and miR-671; C: RT-qPCR analysis of the effect of HG treatment on the expression of Caspase 12, C/EBP-homologous protein (CHOP), and glucose regulated protein 78 (GRP78); D: Western blot analysis of the effect of HG treatment on the protein levels of Caspase 12, CHOP, and GRP78; E: RT-qPCR analysis of the effect of Icariin (ICA) treatment on HG treatment of miR-503 expression; F: RT-qPCR analysis of the effect of ICA treatment on HG-induced expression of endoplasmic reticulum stress-related factors Caspase 12, CHOP, and GRP78 expression; G: Western blot analysis of the effect of ICA treatment on HG-induced protein levels of Caspase 12, CHOP, and GRP78; H: Cell Counting Kit 8 (CCK8) analysis of the effect of ICA treatment on HG-induced cell viability of PRKs; I: flow cytometry analysis of the effect of ICA treatment on HG-induced apoptosis of PRKs; J: CCK8 analysis of the effect of low, medium, and high doses of ICA on cell viability of PRKs. aP < 0.05 vs the control group; bP < 0.05 vs the HG group. DAPI: 4',6-diamidino-2-phenylindole; α-SMA: α-smooth muscle actin; HG: High glucose; miR: MicroRNA; CHOP: C/EBP-homologous protein; GRP78: Glucose regulated protein 78; ICA: Icariin; L: Low; M: Medium; H: High; FITC: Fluorescein isothiocyanate; PI: Propidium iodide.
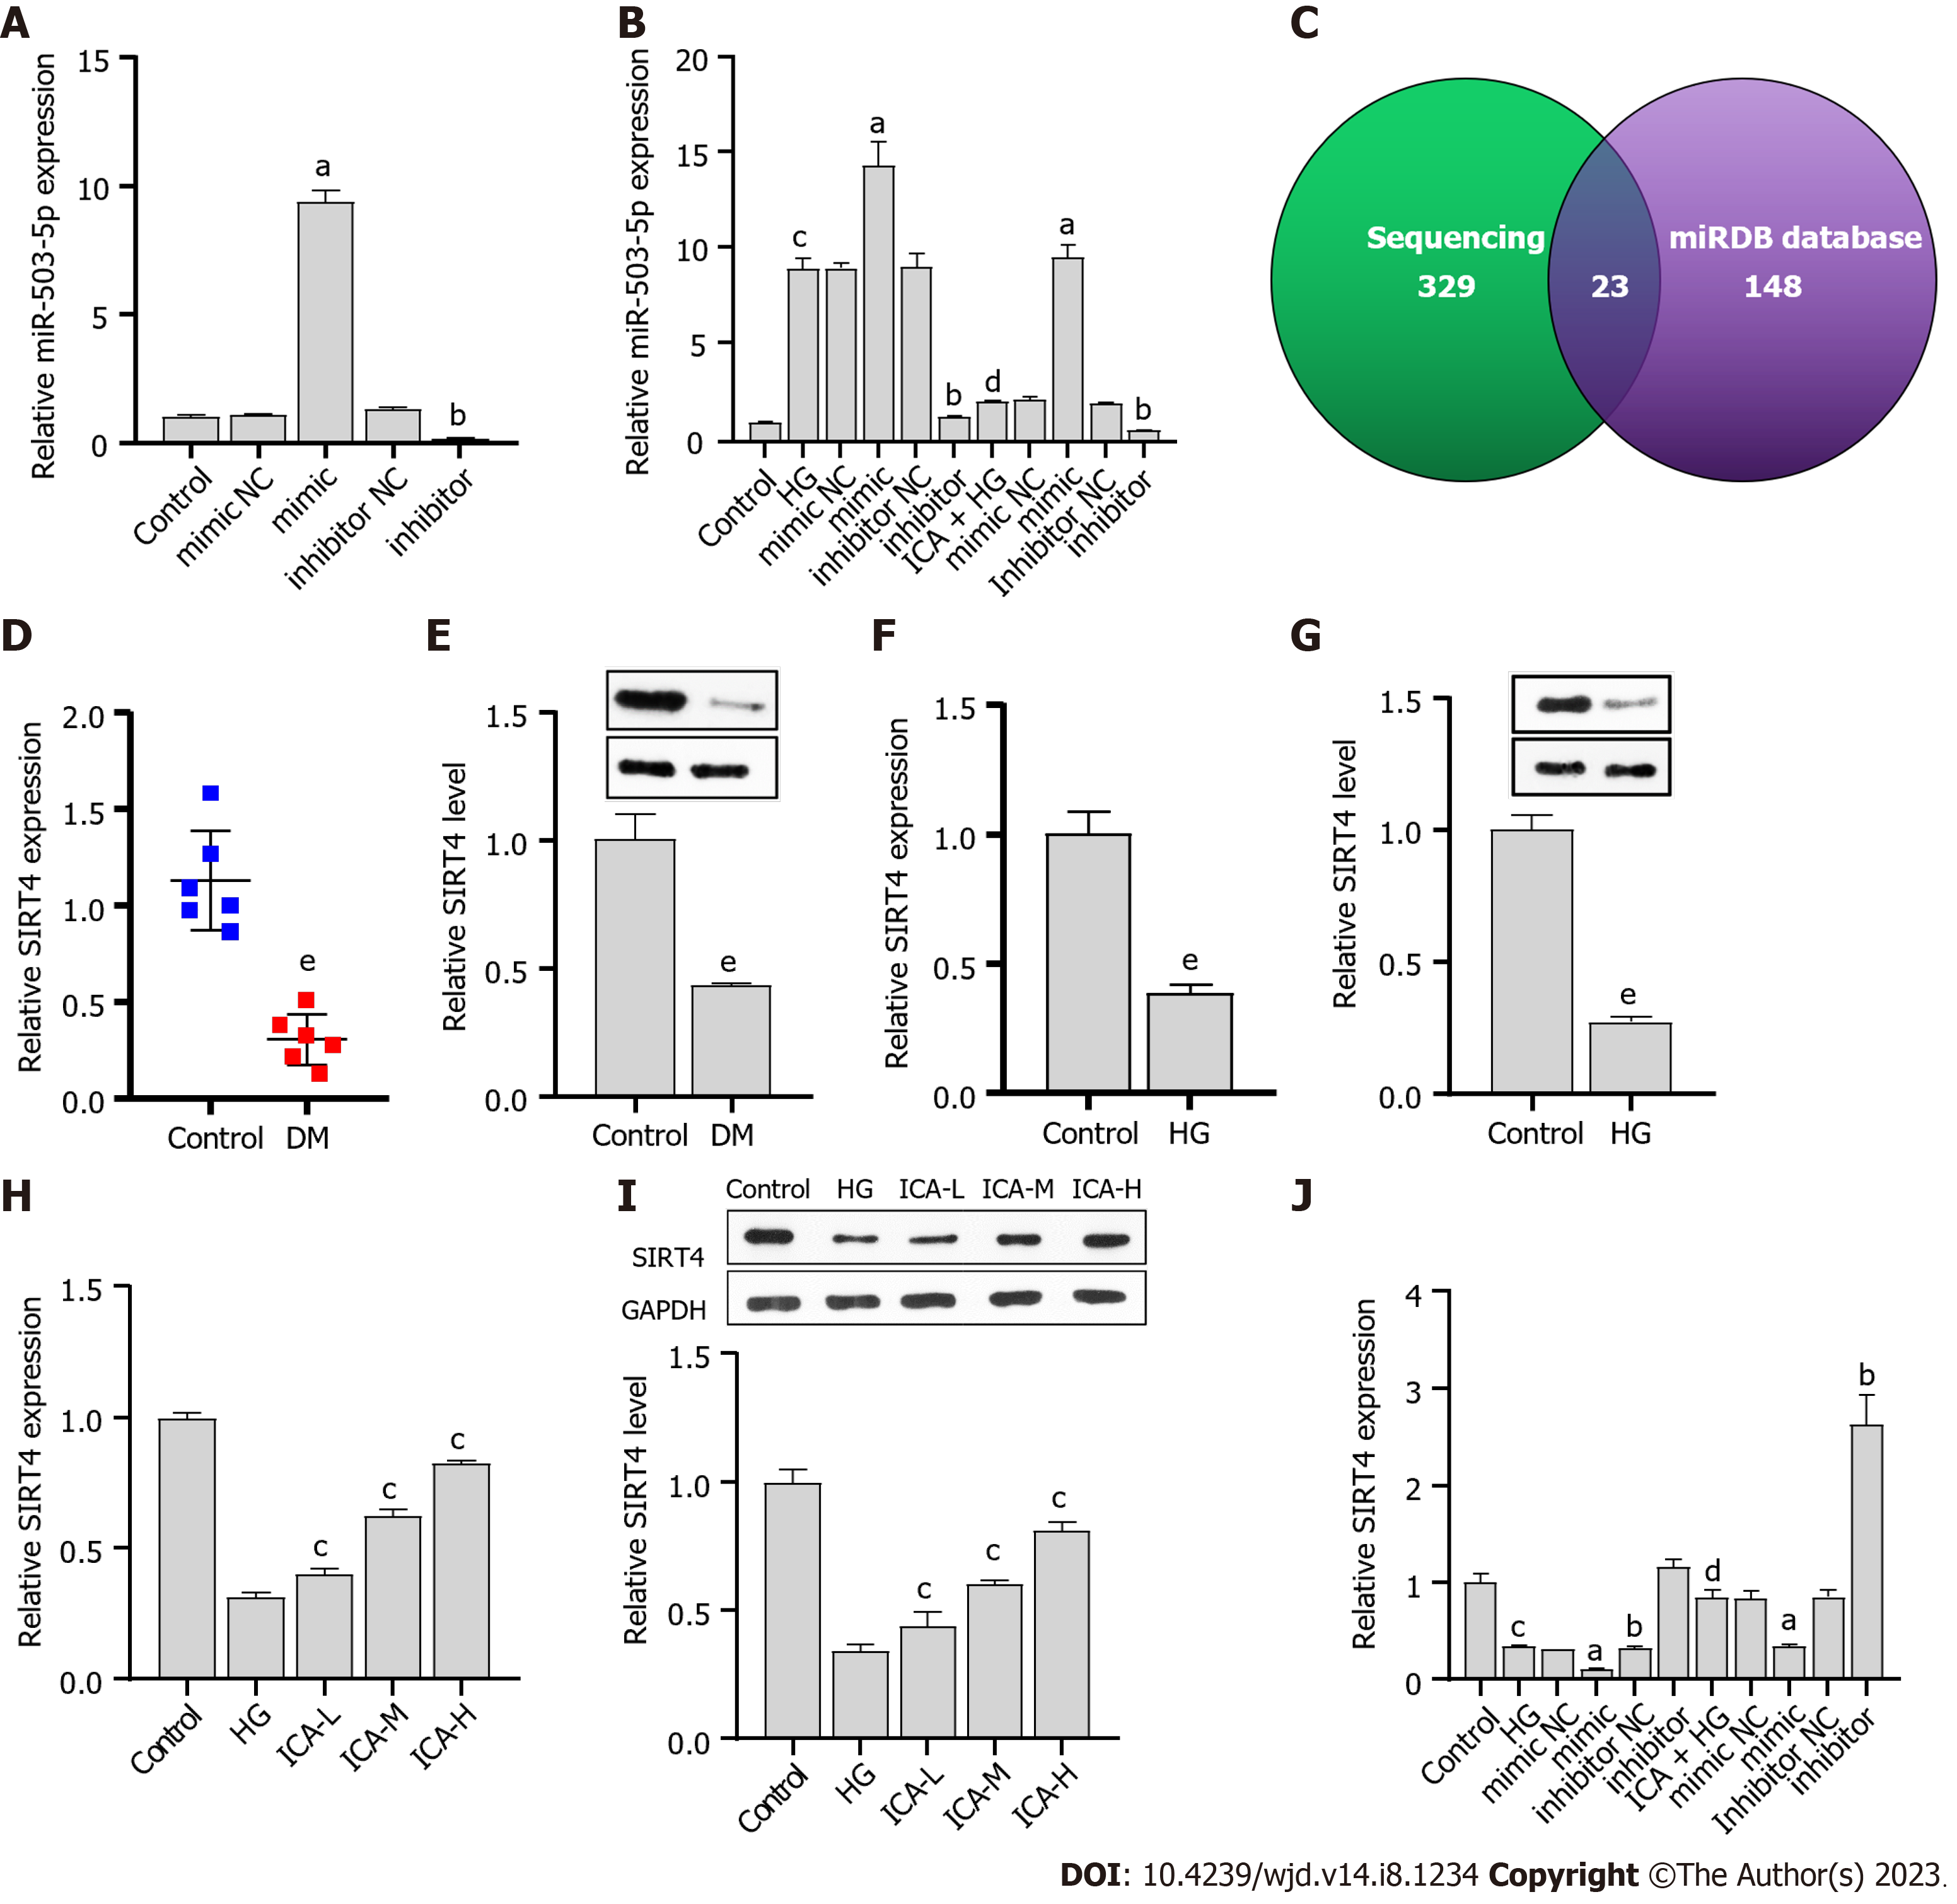
Figure 3 miR-503 negatively regulates sirtuin 4.
A: Real-time quantitative polymerase chain reaction (RT-qPCR) verification of the effectiveness of miR-503 mimic/inhibitor; B: RT-qPCR analysis of the effect of Icariin (ICA) treatment on high glucose (HG)-induced miR-503 expression; C: High-throughput sequencing results combined with the miRDB database to screen for the putative target gene of miR-503; D: RT-qPCR analysis of sirtuin 4 (SIRT4) expression in normal and diabetic nephropathy (DN) rat kidney tissue; E: Western blot analysis of SIRT4 protein level in normal and DN rat kidney tissue; F: RT-qPCR analysis of the effect of HG on SIRT4 expression; G: Western blot analysis of the effect of HG on SIRT4 protein level; H: RT-qPCR analysis of the effects of low, medium, and high doses of ICA in the treatment of HG-induced SIRT4 expression; I: Western blot analysis of the effects of low, medium, and high doses of ICA in the treatment of HG-induced SIRT4 protein level; J: RT-qPCR analysis of the effect of ICA treatment on HG-induced SIRT4 expression. aP < 0.05 vs the mimic negative control (NC) group; bP < 0.05 vs the inhibitor NC group; cP < 0.05 vs the control group; dP < 0.05 vs the HG group; eP < 0.05 vs the control group. DN: Diabetic nephropathy; HG: High glucose; miR: microRNA; NC: Negative control; RT-qPCR: Real-time quantitative polymerase chain reaction; ICA: Icariin; L: Low; M: Medium; H: High; SIRT4: Sirtuin 4.
Figure 4 Sirtuin 4 is a direct target of miR-503.
A: Real-time quantitative polymerase chain reaction (RT-qPCR) verification of the validity of the ov-sirtuin 4 (SIRT4) plasmid; B: Western blot verification of the validity of the ov-SIRT4 plasmid; C: Potential binding sites of miR-503 to SIRT4; D: Dual luciferase analysis of the binding of miR-503 and SIRT4; E: RT-qPCR analysis of the effect of miR-503 mimic and ov-SIRT4 co-transfection on miR-503 expression; F: RT-qPCR analysis of the effect of miR-503 mimic and ov-SIRT4 co-transfection on SIRT4 expression. aP < 0.05 vs the ov-negative control (NC) group; bP < 0.05 vs the mimic NC group; cP < 0.05 vs the mimic group; dP < 0.05 vs the mimic + ov-NC group. miR: microRNA; NC: Negative control; RT-qPCR: Real-time quantitative polymerase chain reaction; ov: Overexpression; SIRT4: Sirtuin 4; WT: Wild type; mut: Mutant.
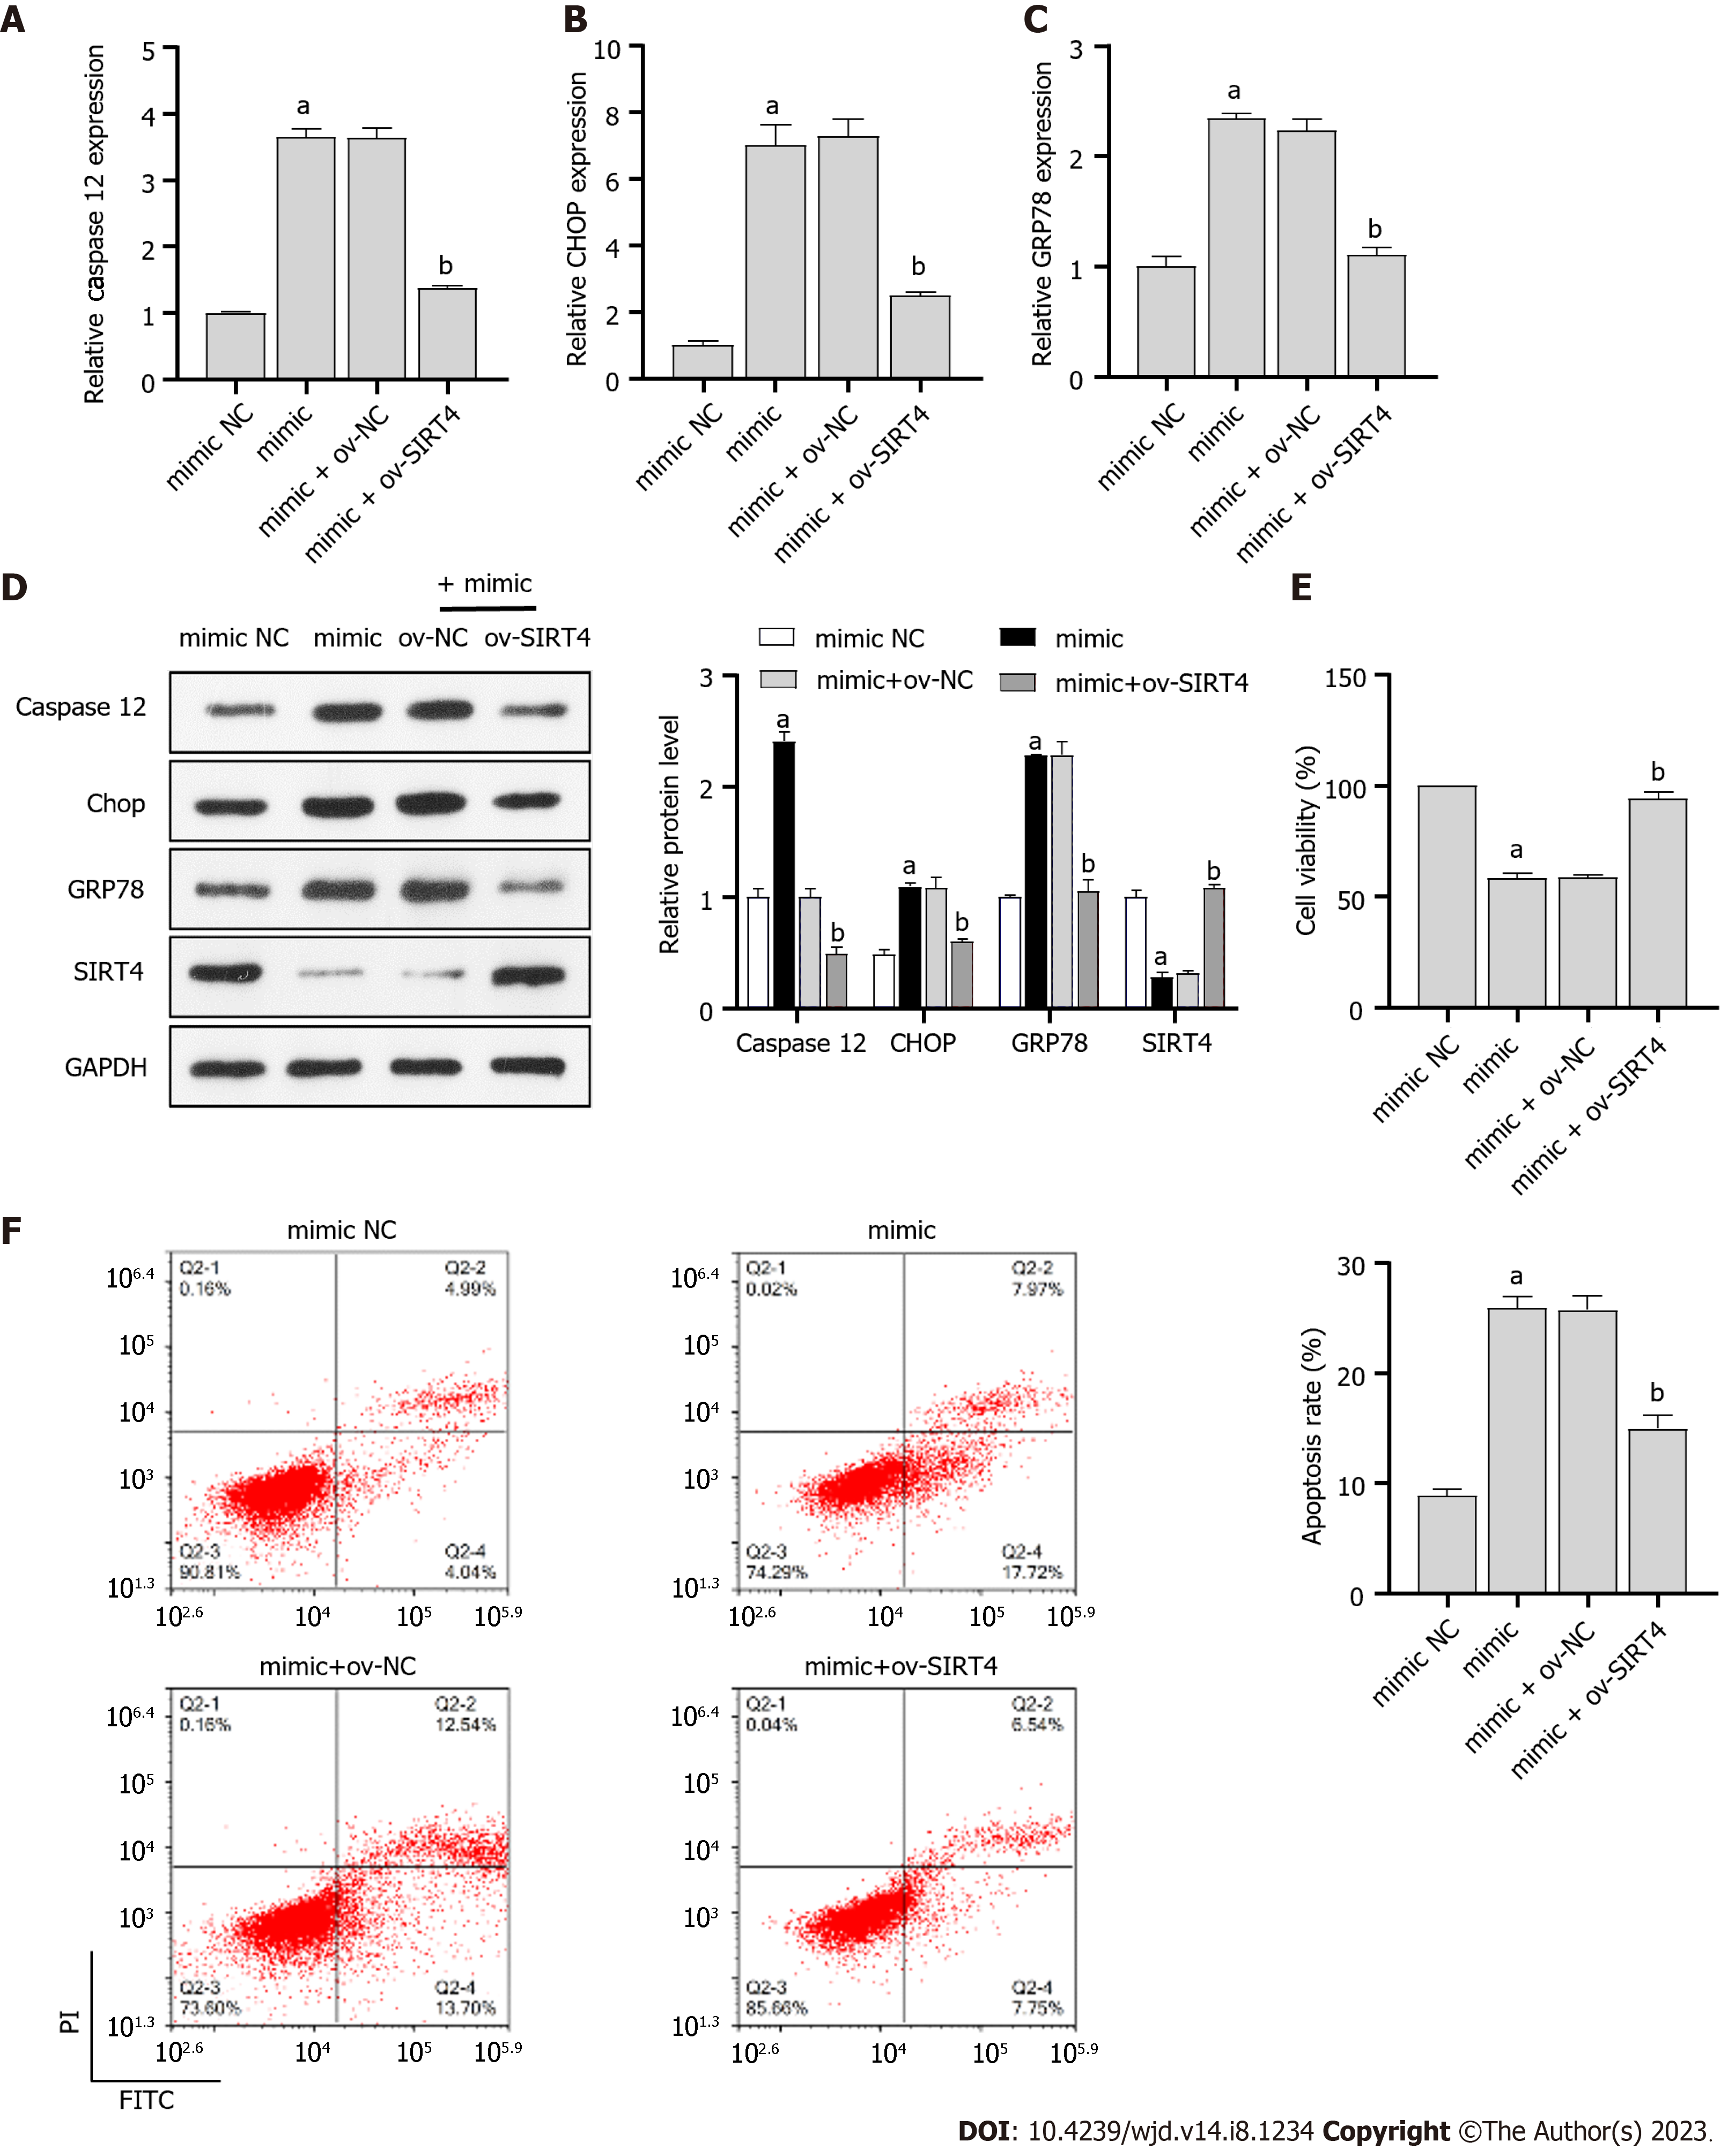
Figure 5 Icariin regulates miR-503/sirtuin 4 axis to improve high glucose-induced cell injury and endoplasmic reticulum stress.
A-C: Real-time quantitative polymerase chain reaction analysis of the effect of miR-503 mimic and ov-sirtuin 4 (SIRT4) co-transfection on Caspase 12 (A), C/EBP-homologous protein (CHOP) (B), and glucose regulated protein 78 (GRP78) (C) expression in primary rat kidney (PRKs) co-treated with high glucose (HG) and Icariin (ICA); D: Western blot analysis of the effect of miR-503 mimic and ov-SIRT4 co-transfection on Caspase 12, CHOP, and GRP78 protein levels in PRKs co-treated with HG and ICA; E: Cell Counting Kit 8 analysis of the effect of miR-503 mimic and ov-SIRT4 co-transfection on cell viability of PRKs; F: Flow cytometry analysis of the effect of miR-503 mimic and ov-SIRT4 co-transfection on apoptosis of PRKs. aP < 0.05 vs the mimic negative control (NC) group; bP < 0.05 vs the mimic + ov-NC group. HG: High glucose; miR: microRNA; NC: Negative control; RT-qPCR: Real-time quantitative polymerase chain reaction; CHOP: C/EBP-homologous protein; GRP78: Glucose regulated protein 78; SIRT4: Sirtuin 4; ICA: Icariin; FITC: Fluorescein isothiocyanate; PI: Propidium iodide; FCM: Flow cytometry; CCK8: Cell Counting Kit 8; ER: Endoplasmic reticulum.
- Citation: Su BL, Wang LL, Zhang LY, Zhang S, Li Q, Chen GY. Potential role of microRNA-503 in Icariin-mediated prevention of high glucose-induced endoplasmic reticulum stress. World J Diabetes 2023; 14(8): 1234-1248
- URL: https://www.wjgnet.com/1948-9358/full/v14/i8/1234.htm
- DOI: https://dx.doi.org/10.4239/wjd.v14.i8.1234


