Copyright
©The Author(s) 2023.
World J Diabetes. Jul 15, 2023; 14(7): 1077-1090
Published online Jul 15, 2023. doi: 10.4239/wjd.v14.i7.1077
Published online Jul 15, 2023. doi: 10.4239/wjd.v14.i7.1077
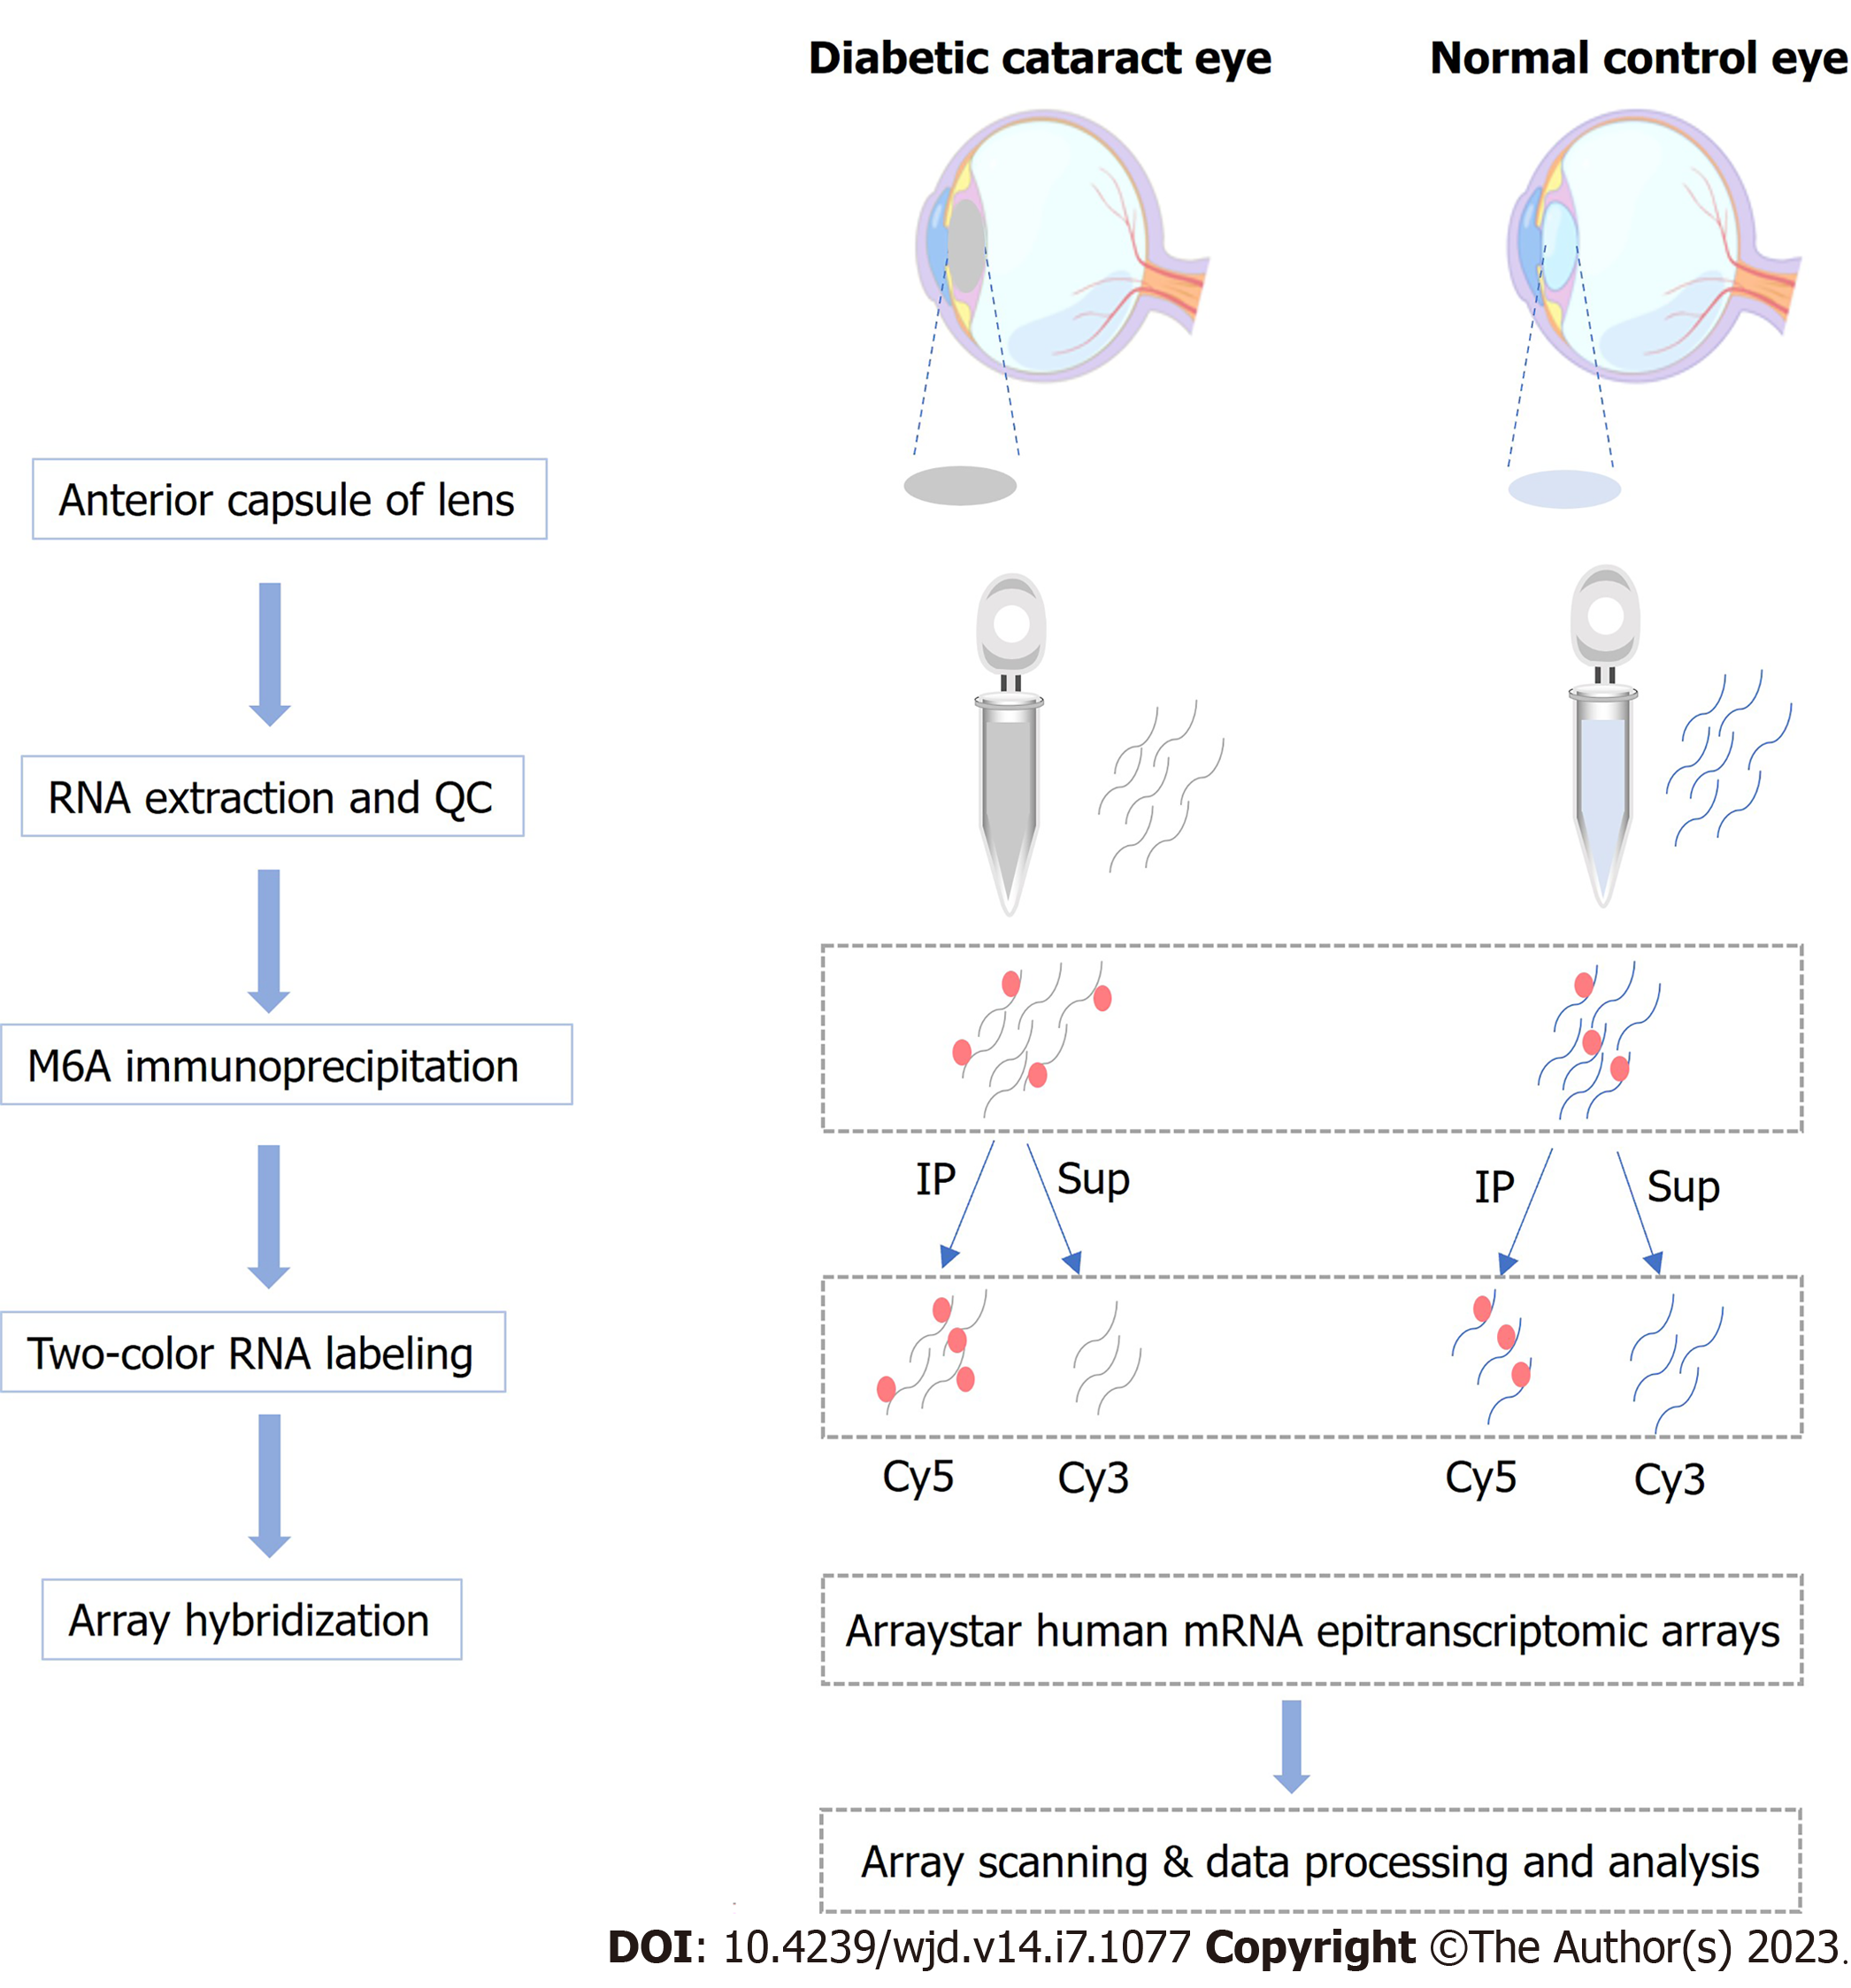
Figure 1 Workflow of the experimental design.
m6A: N6-methyladenosine; QC: Quality control; IP: Immunoprecipitation.
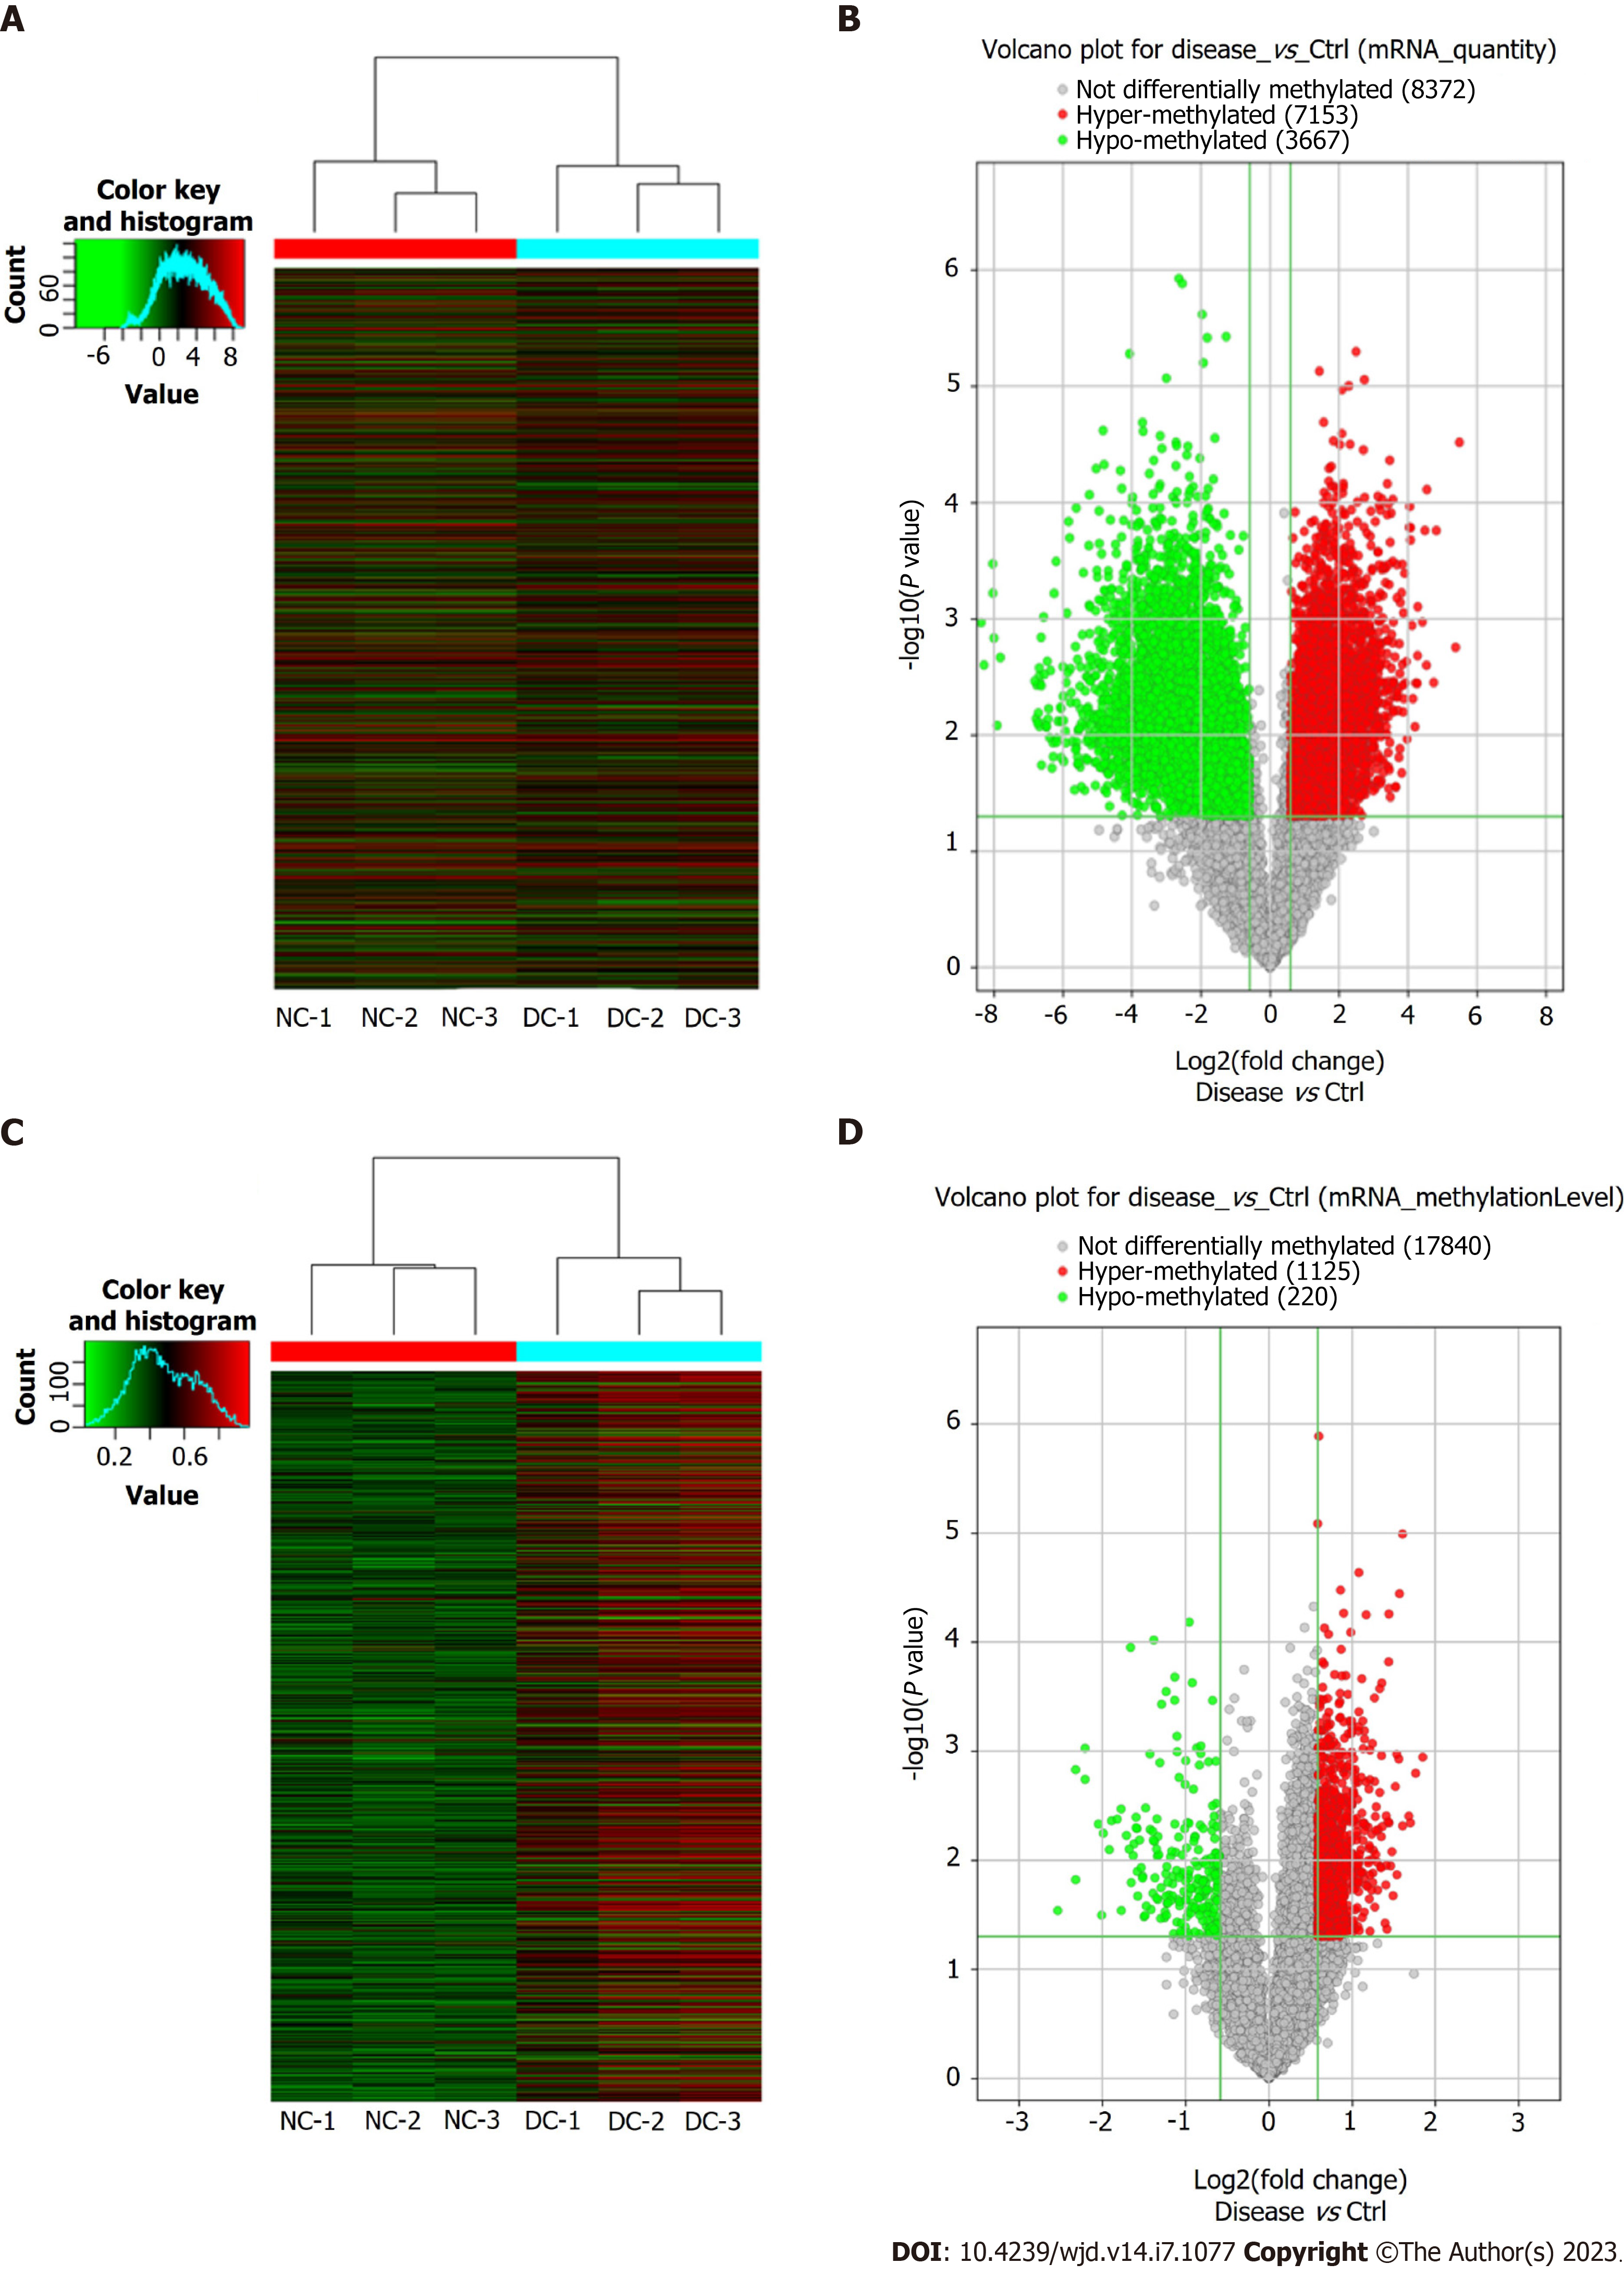
Figure 2 Microarray data analysis showing expression profile of methylated mRNAs.
A: Visualization of differential N6-methyladenosine (m6A) quantity profiles of mRNAs between the diabetic cataract (DC) and normal control (NC) groups through heat map and hierarchical clustering, where red and green colors indicate up- and down-regulated mRNAs, respectively; B: Volcano plot showing significant dysregulation of 10820 (7153 upregulated and 3667 downregulated) mRNAs in DC cases compared to NCs; C: Visualization of differential m6A mRNA methylation level profiles between DC cases and NCs through heat map and hierarchical clustering, where red and green colors indicate up- and down-regulated mRNAs, respectively; D: Volcano plot showing significant dysregulation of 1345 (1125 upregulated and 220 downregulated) methylated mRNAs in DC cases versus NCs.
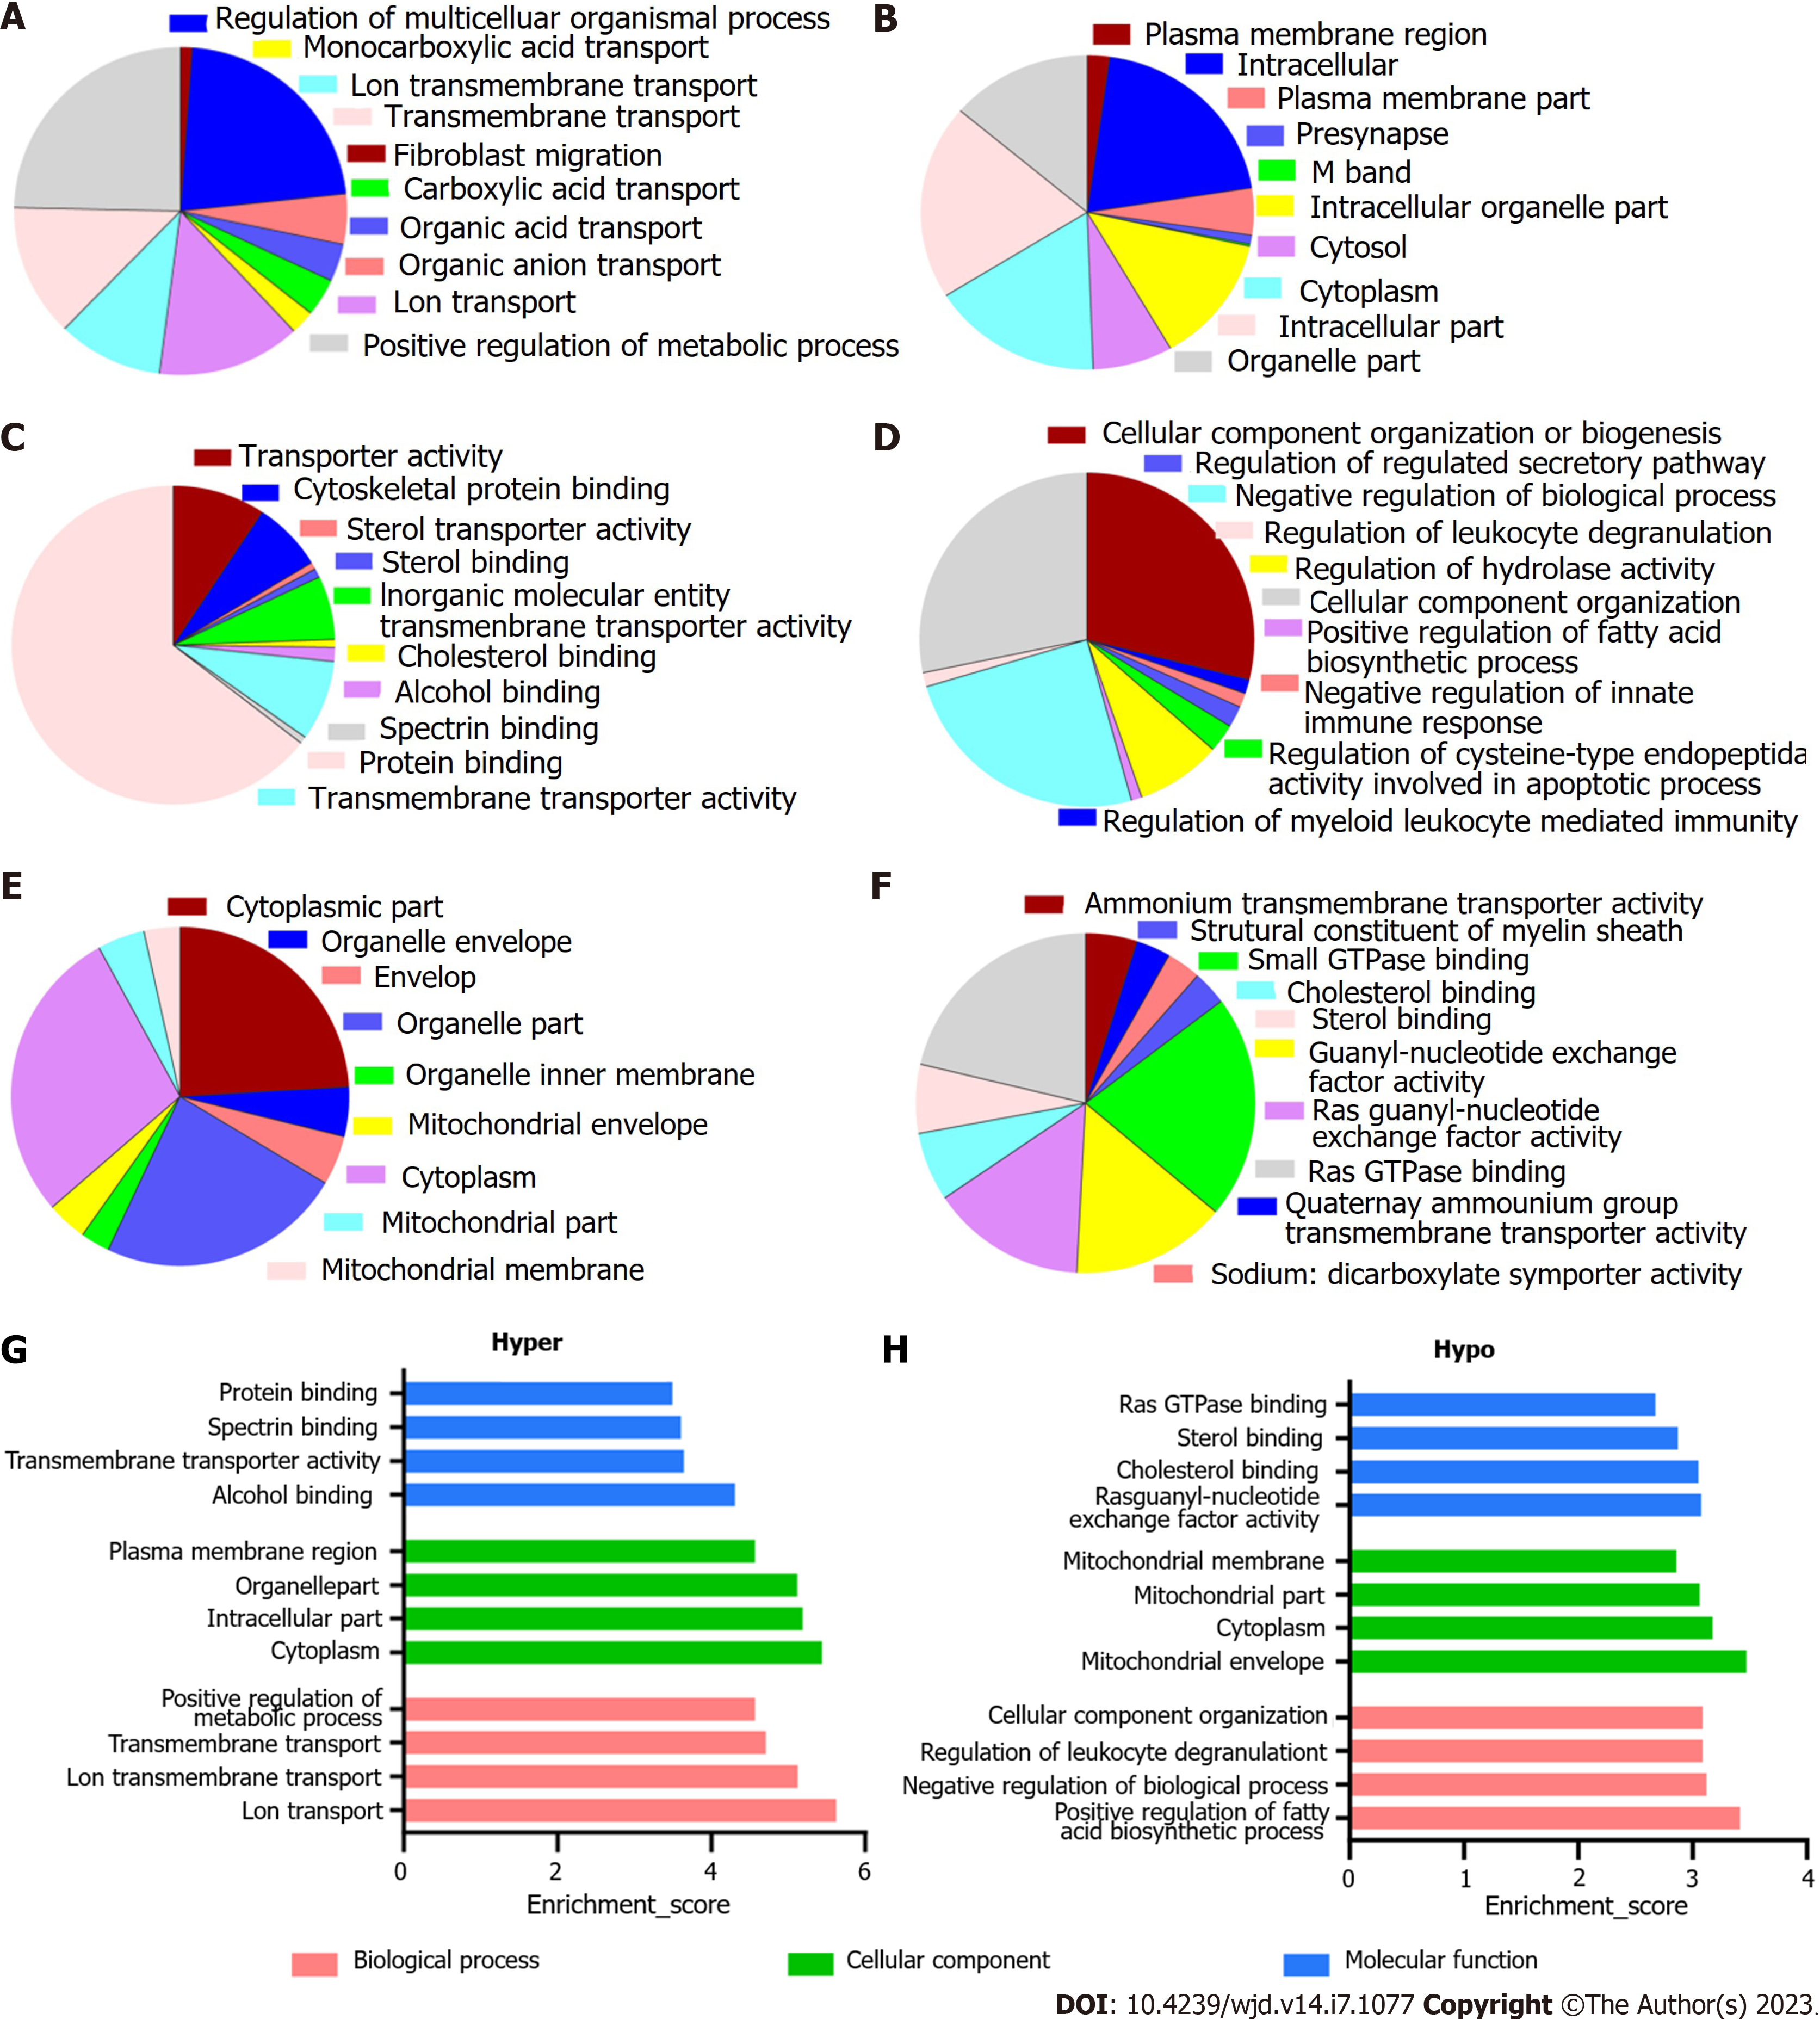
Figure 3 Overall distribution of Gene Ontology analysis.
A-C: Classification of hypermethylated mRNAs in the biological process (BP), cellular component (CC), and molecular function (MF) categories. Among the enriched Gene Ontology (GO) terms, 580 BPs, 110 CCs, and 100 MFs had higher mRNA methylation levels; D-F: Classification of hypomethylated mRNAs in the BP, CC, and MF categories. For the hypomethylated mRNAs, 288 BPs, 47 CCs, and 67 MFs were identified; G: The top four most enriched GO terms of the hypermethylated mRNAs; H: The top four most enriched GO terms of the hypomethylated mRNAs.
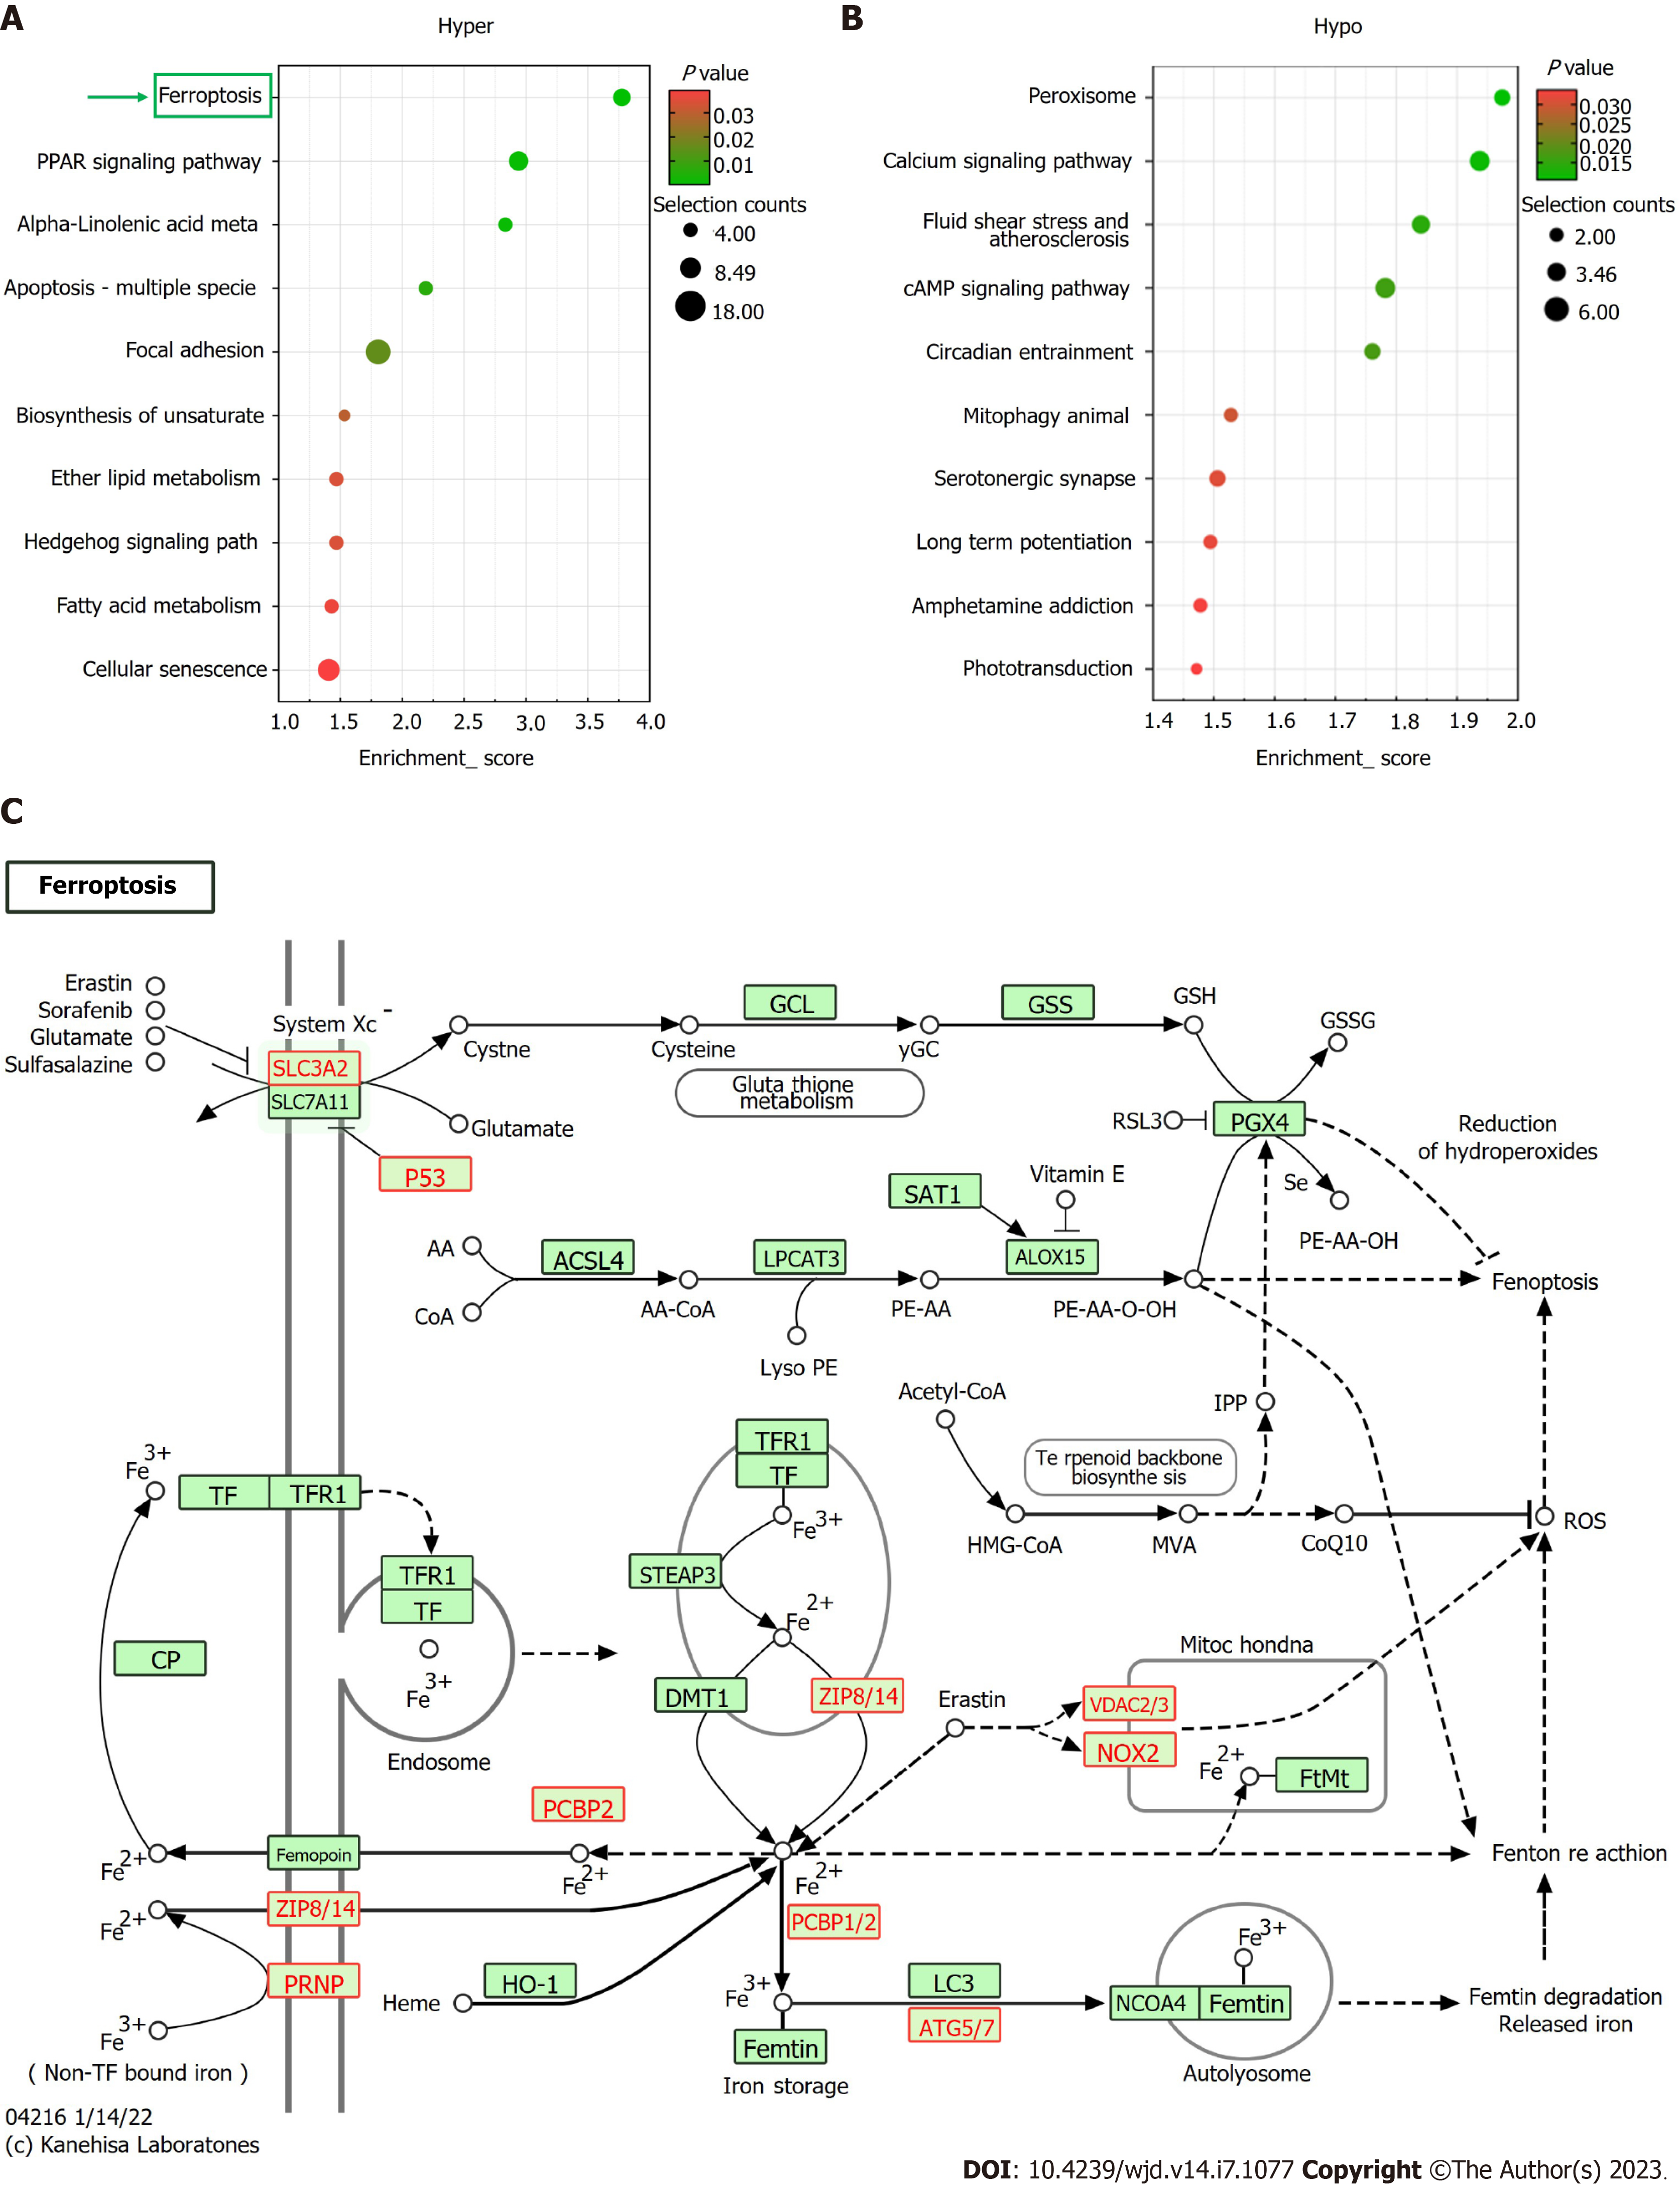
Figure 4 Kyoto encyclopedia of Genes and Genomes pathway analysis.
A: The top 10 Kyoto Encyclopedia of Genes and Genomes (KEGG) pathways of hypermethylated mRNAs; ferroptosis is the most enriched axis; B: The top 10 KEGG pathways of hypomethylated mRNAs; C: The KEGG map of ferroptosis pathway.
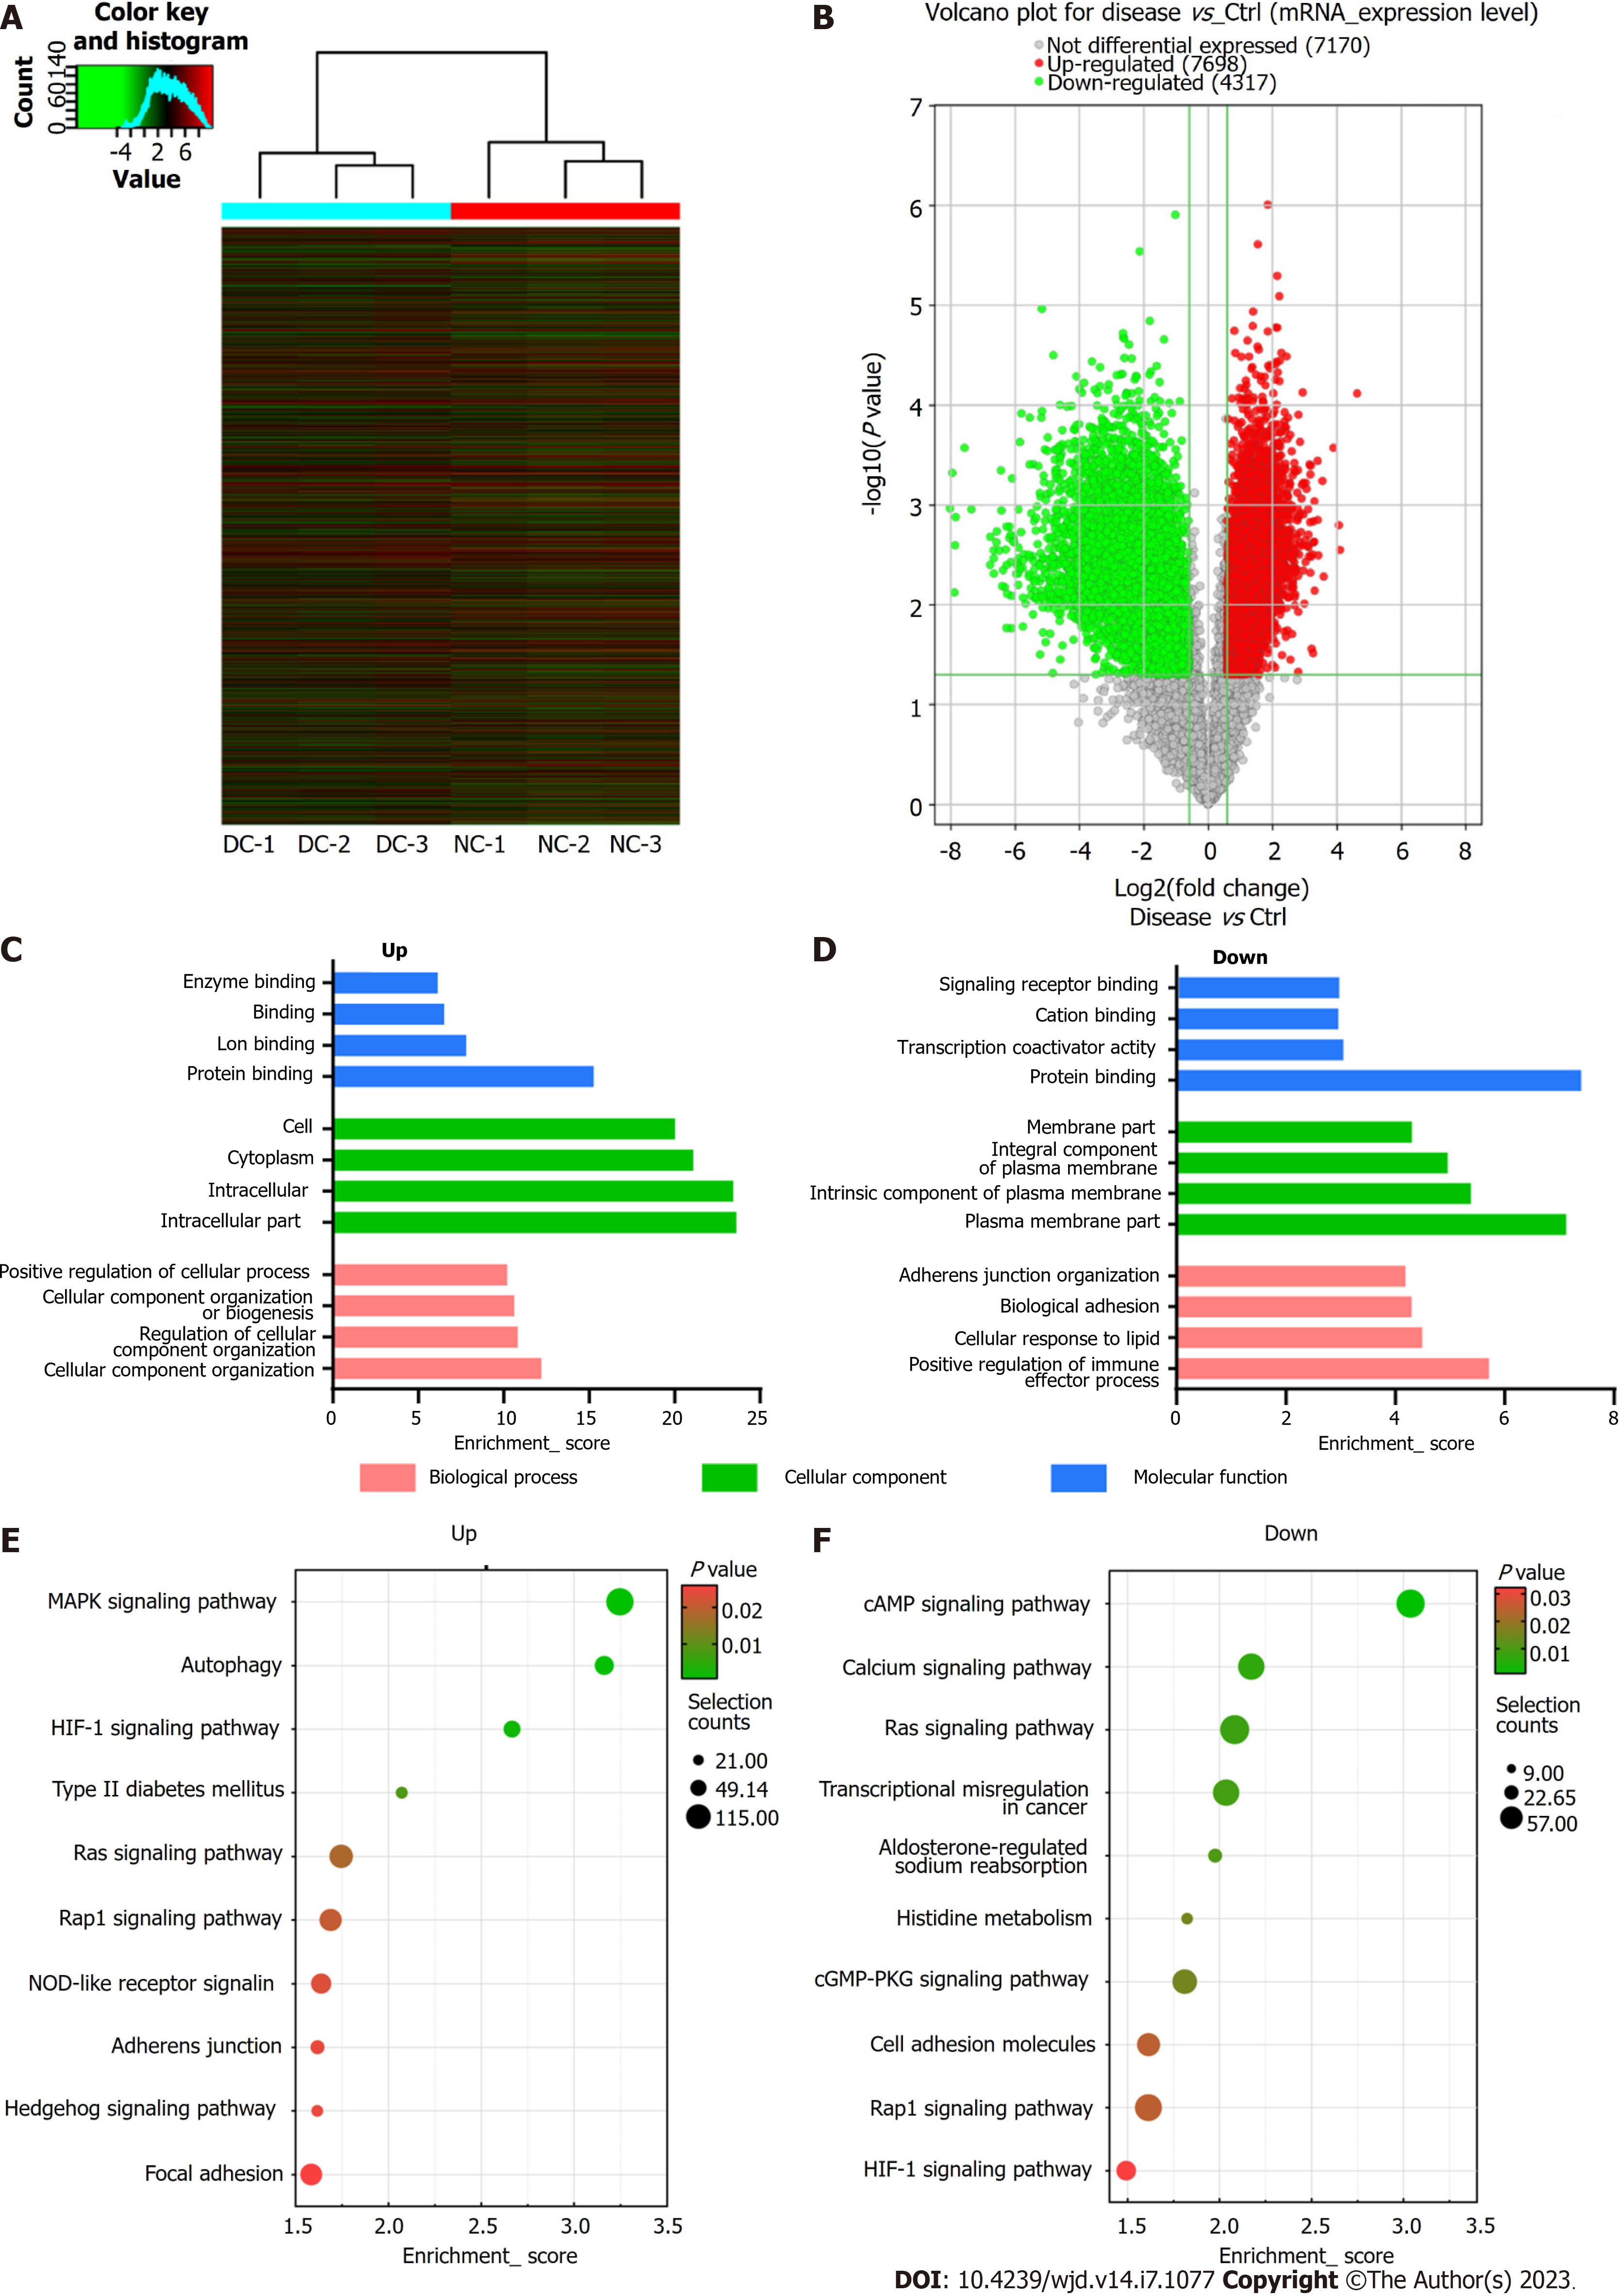
Figure 5 Microarray data showing the profiles of differentially expressed mRNAs.
A: Visualization of differentially expressed mRNAs (DEmRNAs) profiles between diabetic cataract (DC) cases and normal controls (NCs) through heat map and hierarchical clustering, where red and green colors indicate up- and down-regulated mRNAs, respectively; B: Volcano plot showing significant dysregulation of 12015 mRNAs in DC cases than in NCs; C and D: The top four most enriched Gene Ontology terms of down- (C) and up-regulated mRNAs (D); E and F: The top 10 Kyoto Encyclopedia of Genes and Genomes pathways of down (E) and up-regulated mRNAs (F).
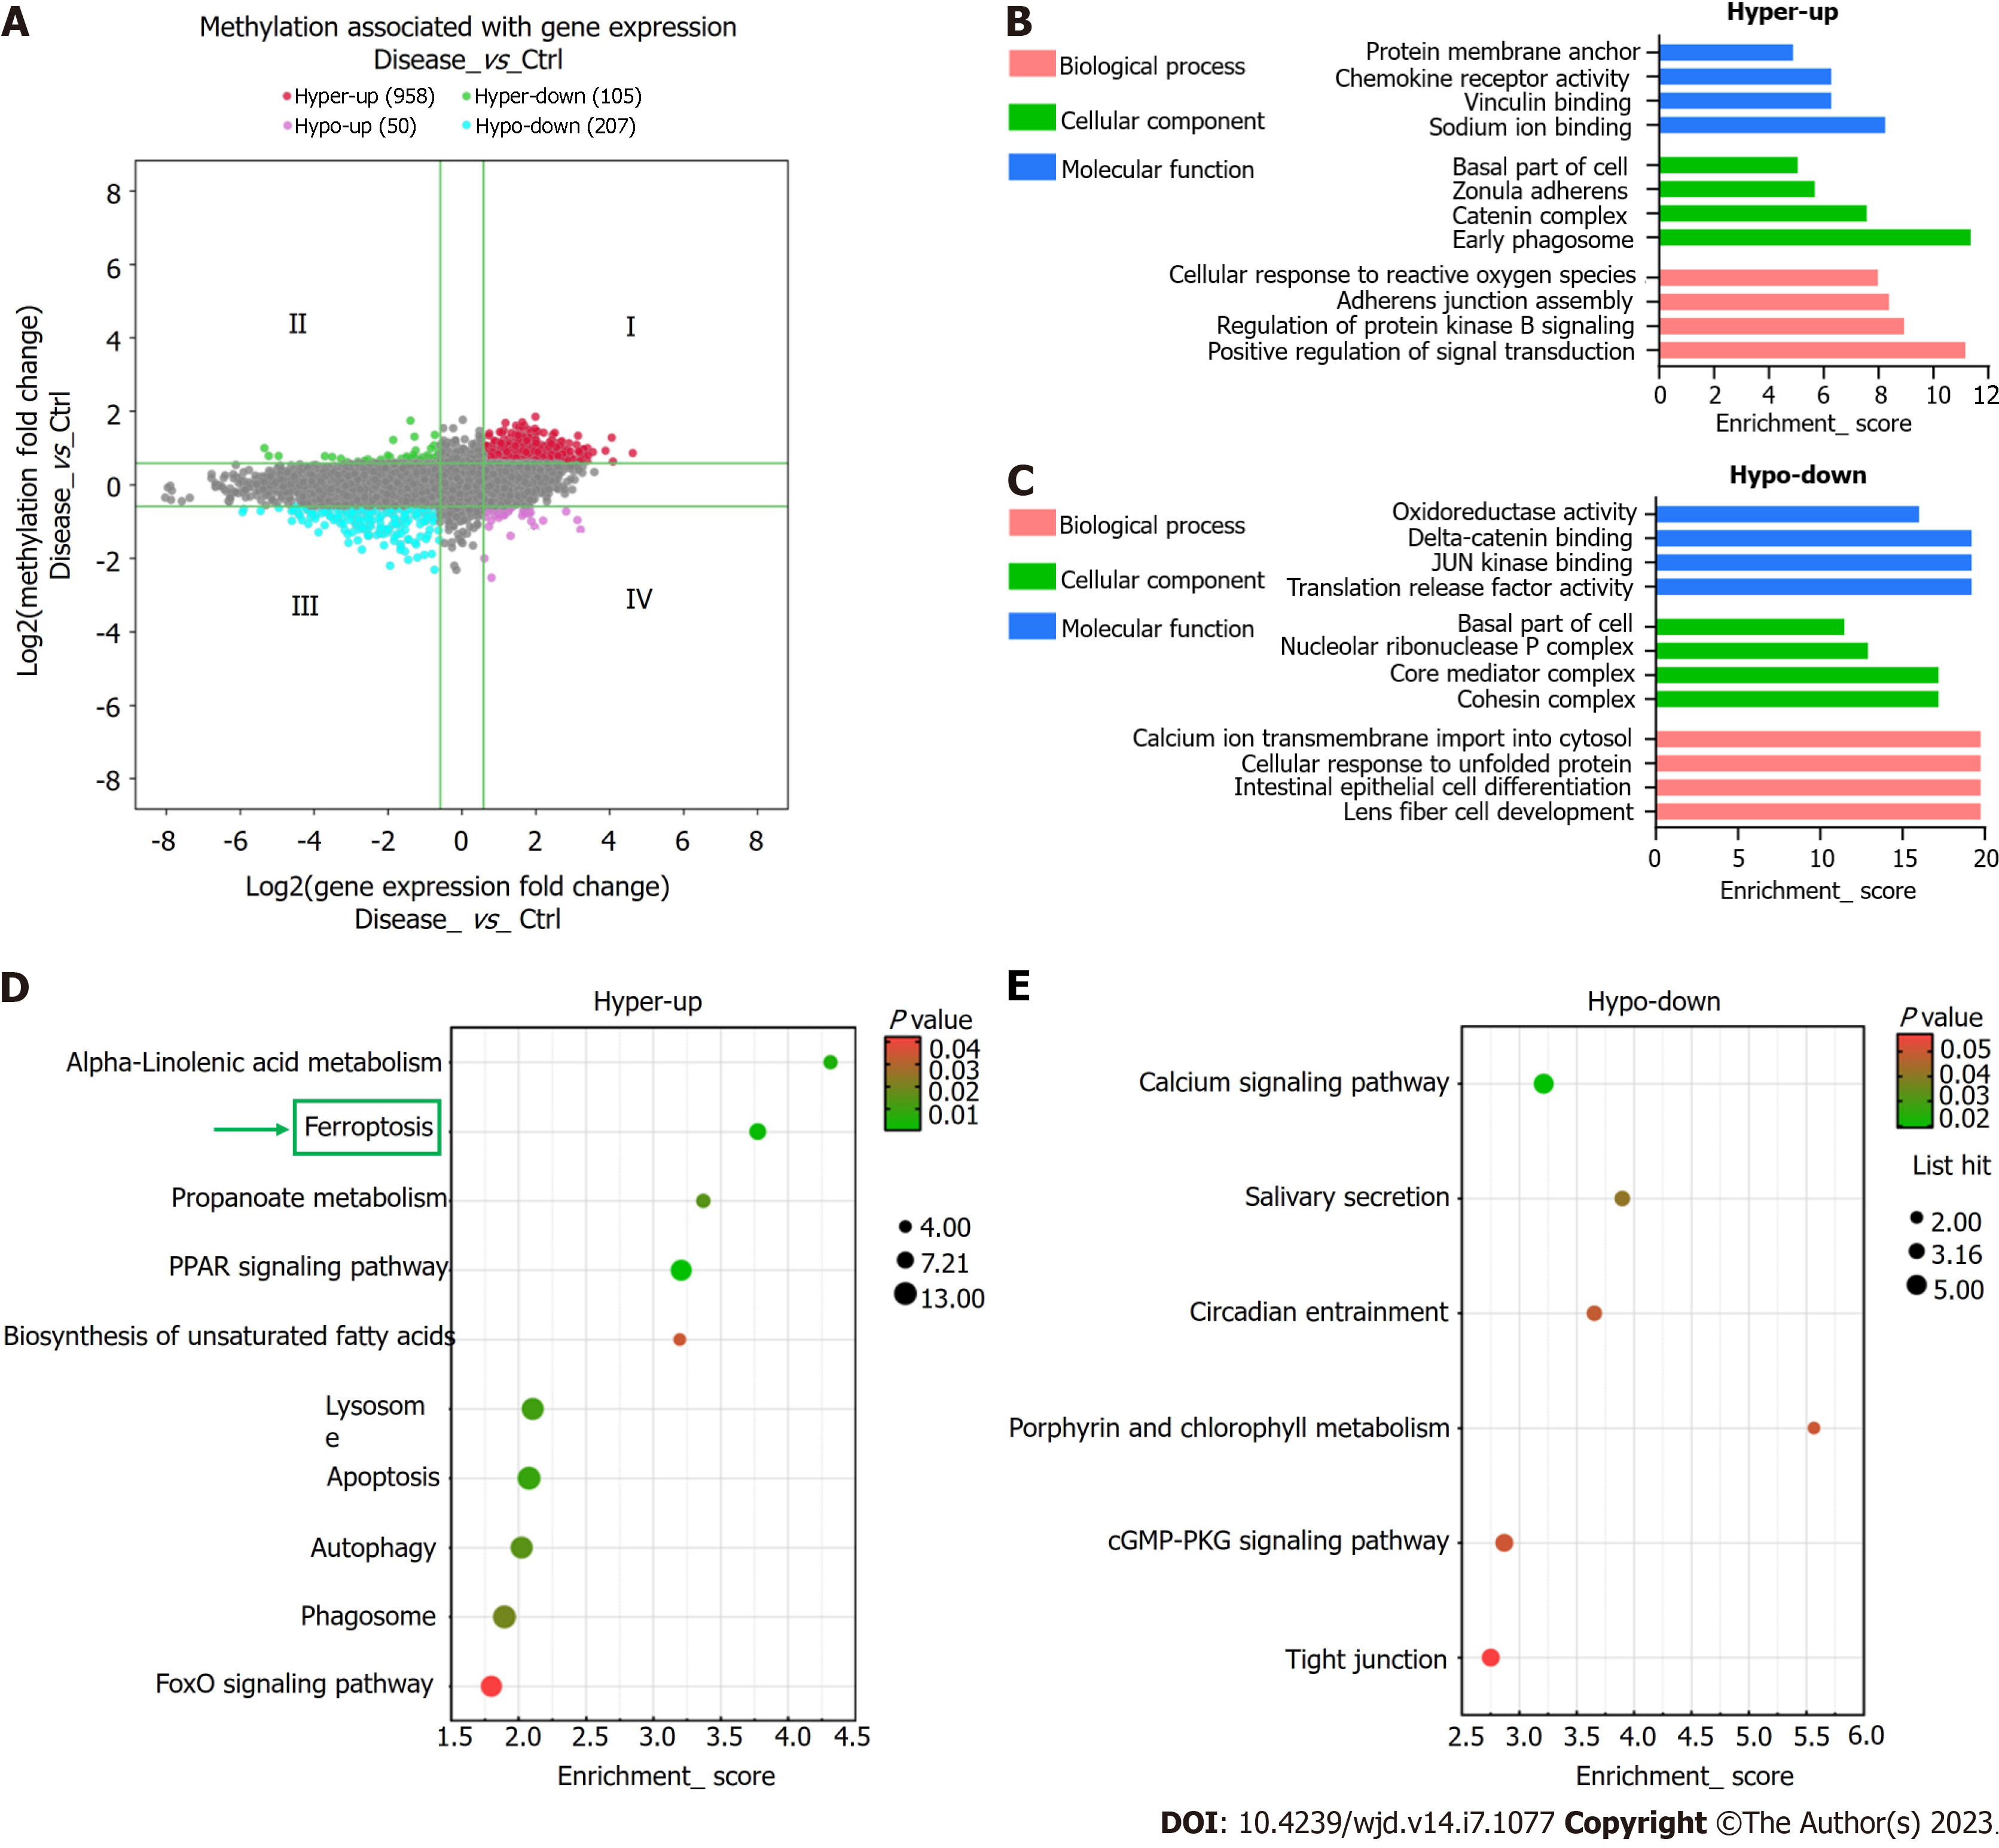
Figure 6 Combined analysis of N6-methyladenosine methylation and mRNA expression levels.
A: Visualization of the positive correlation of differential N6-methyladenosine methylation with differential mRNA expression via a four-quadrant graph; B and C: The top four Gene Ontology terms significantly enriched for the hypermethylated-upregulated (hyper-up) genes (B) and the hypomethylated-downregulated (hypo-down) genes (C); D and E: The top 10 Kyoto Encyclopedia of Genes and Genomes pathways significantly enriched for the hyper-up (D) and hypo-down genes (E).
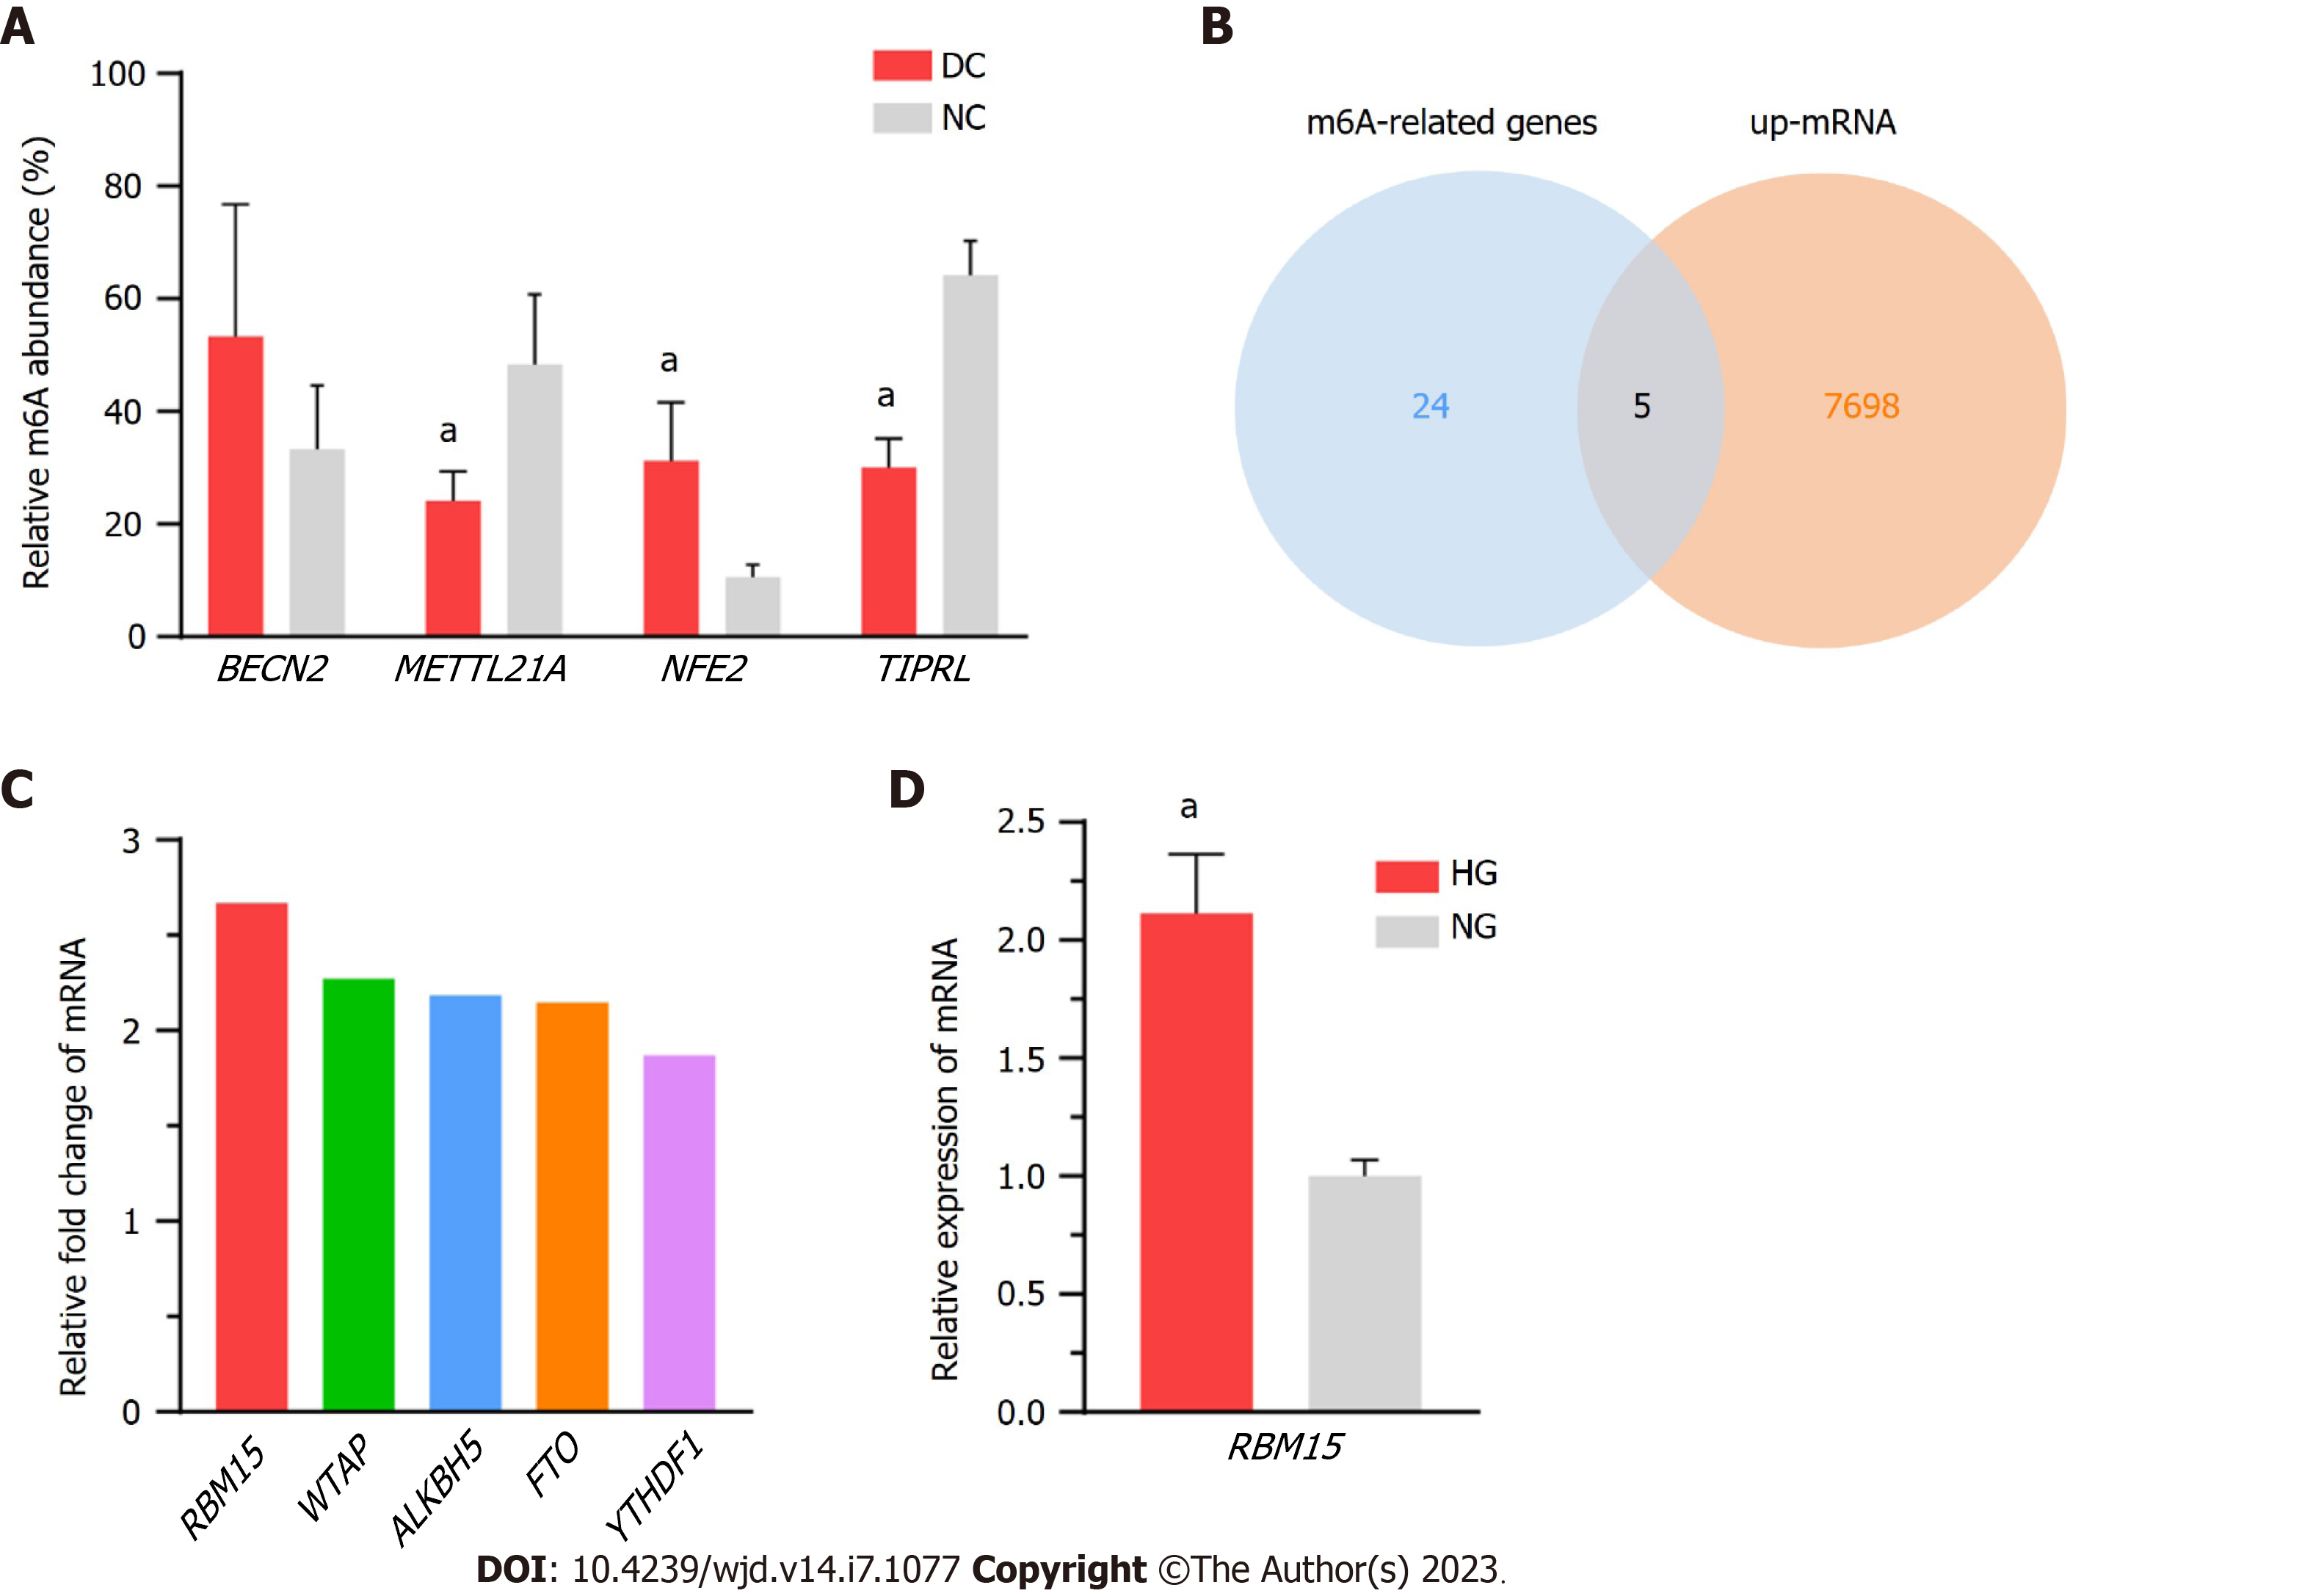
Figure 7 Validation of the diverse expression levels of methylated mRNA and RNA methyltransferase, using in vivo and in vitro models.
A: Methylation levels of BECN2, METTL21A, NFE2, and TIPRL are consistent with the microarray data for the diabetic cataract and normal control groups; B: Intersection results of upregulated mRNAs and N6-methyladenosine-related genes; C: Fold change values of five genes (RBM15, WTAP, ALKBH5, FTO, and YTHDF1) in microarray results; D: The mRNA levels of RBM15 are significantly higher in high-glucose cultured SRA01/04 cells than in normal-glucose cultured ones. DC: Diabetic cataract; NC: Normal control; HG: High-glucose; NG: Normal-glucose. aP < 0.05.
- Citation: Cai L, Han XY, Li D, Ma DM, Shi YM, Lu Y, Yang J. Analysis of N6-methyladenosine-modified mRNAs in diabetic cataract. World J Diabetes 2023; 14(7): 1077-1090
- URL: https://www.wjgnet.com/1948-9358/full/v14/i7/1077.htm
- DOI: https://dx.doi.org/10.4239/wjd.v14.i7.1077


