Copyright
©The Author(s) 2023.
World J Diabetes. Jul 15, 2023; 14(7): 1057-1076
Published online Jul 15, 2023. doi: 10.4239/wjd.v14.i7.1057
Published online Jul 15, 2023. doi: 10.4239/wjd.v14.i7.1057
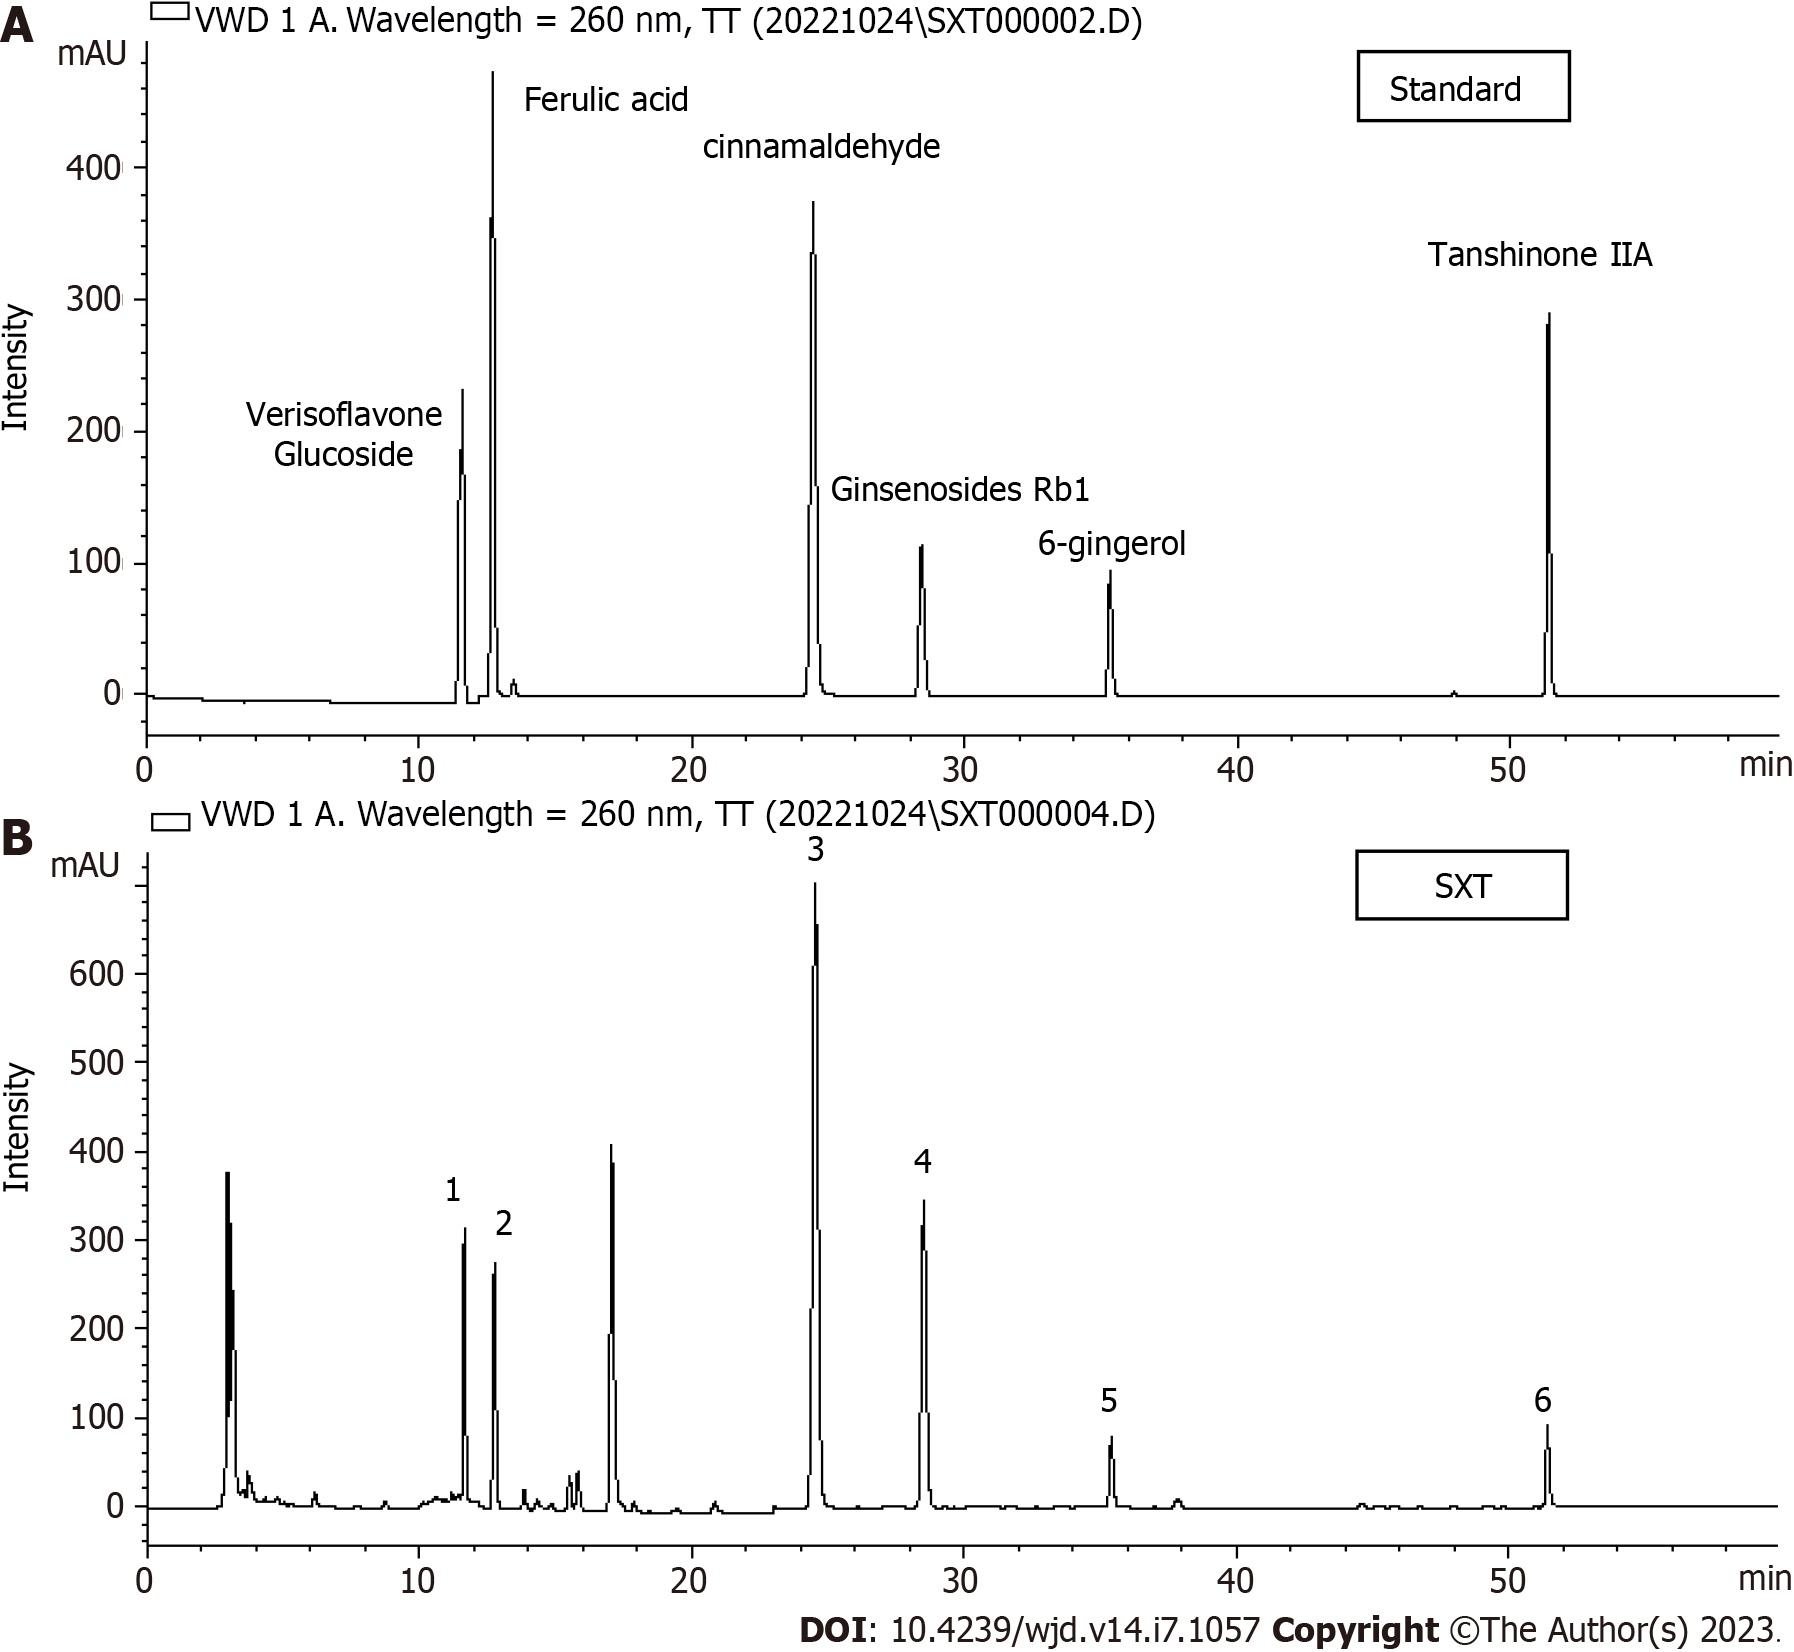
Figure 1 HPLC-VWD mass spectrometry.
A: Key components of Shuxin decoction (SXT) identified by HPLC-VWD mass spectrometry; B: HPLC-VWD mass spectrometry of SXT. 1-6 represent verisoflavone glucoside, ferulic acid, cinnamaldehyde, ginsenosides Rb1, 6-gingerol, and tanshinone ⅡA, respectively. SXT: Shuxin decoction.
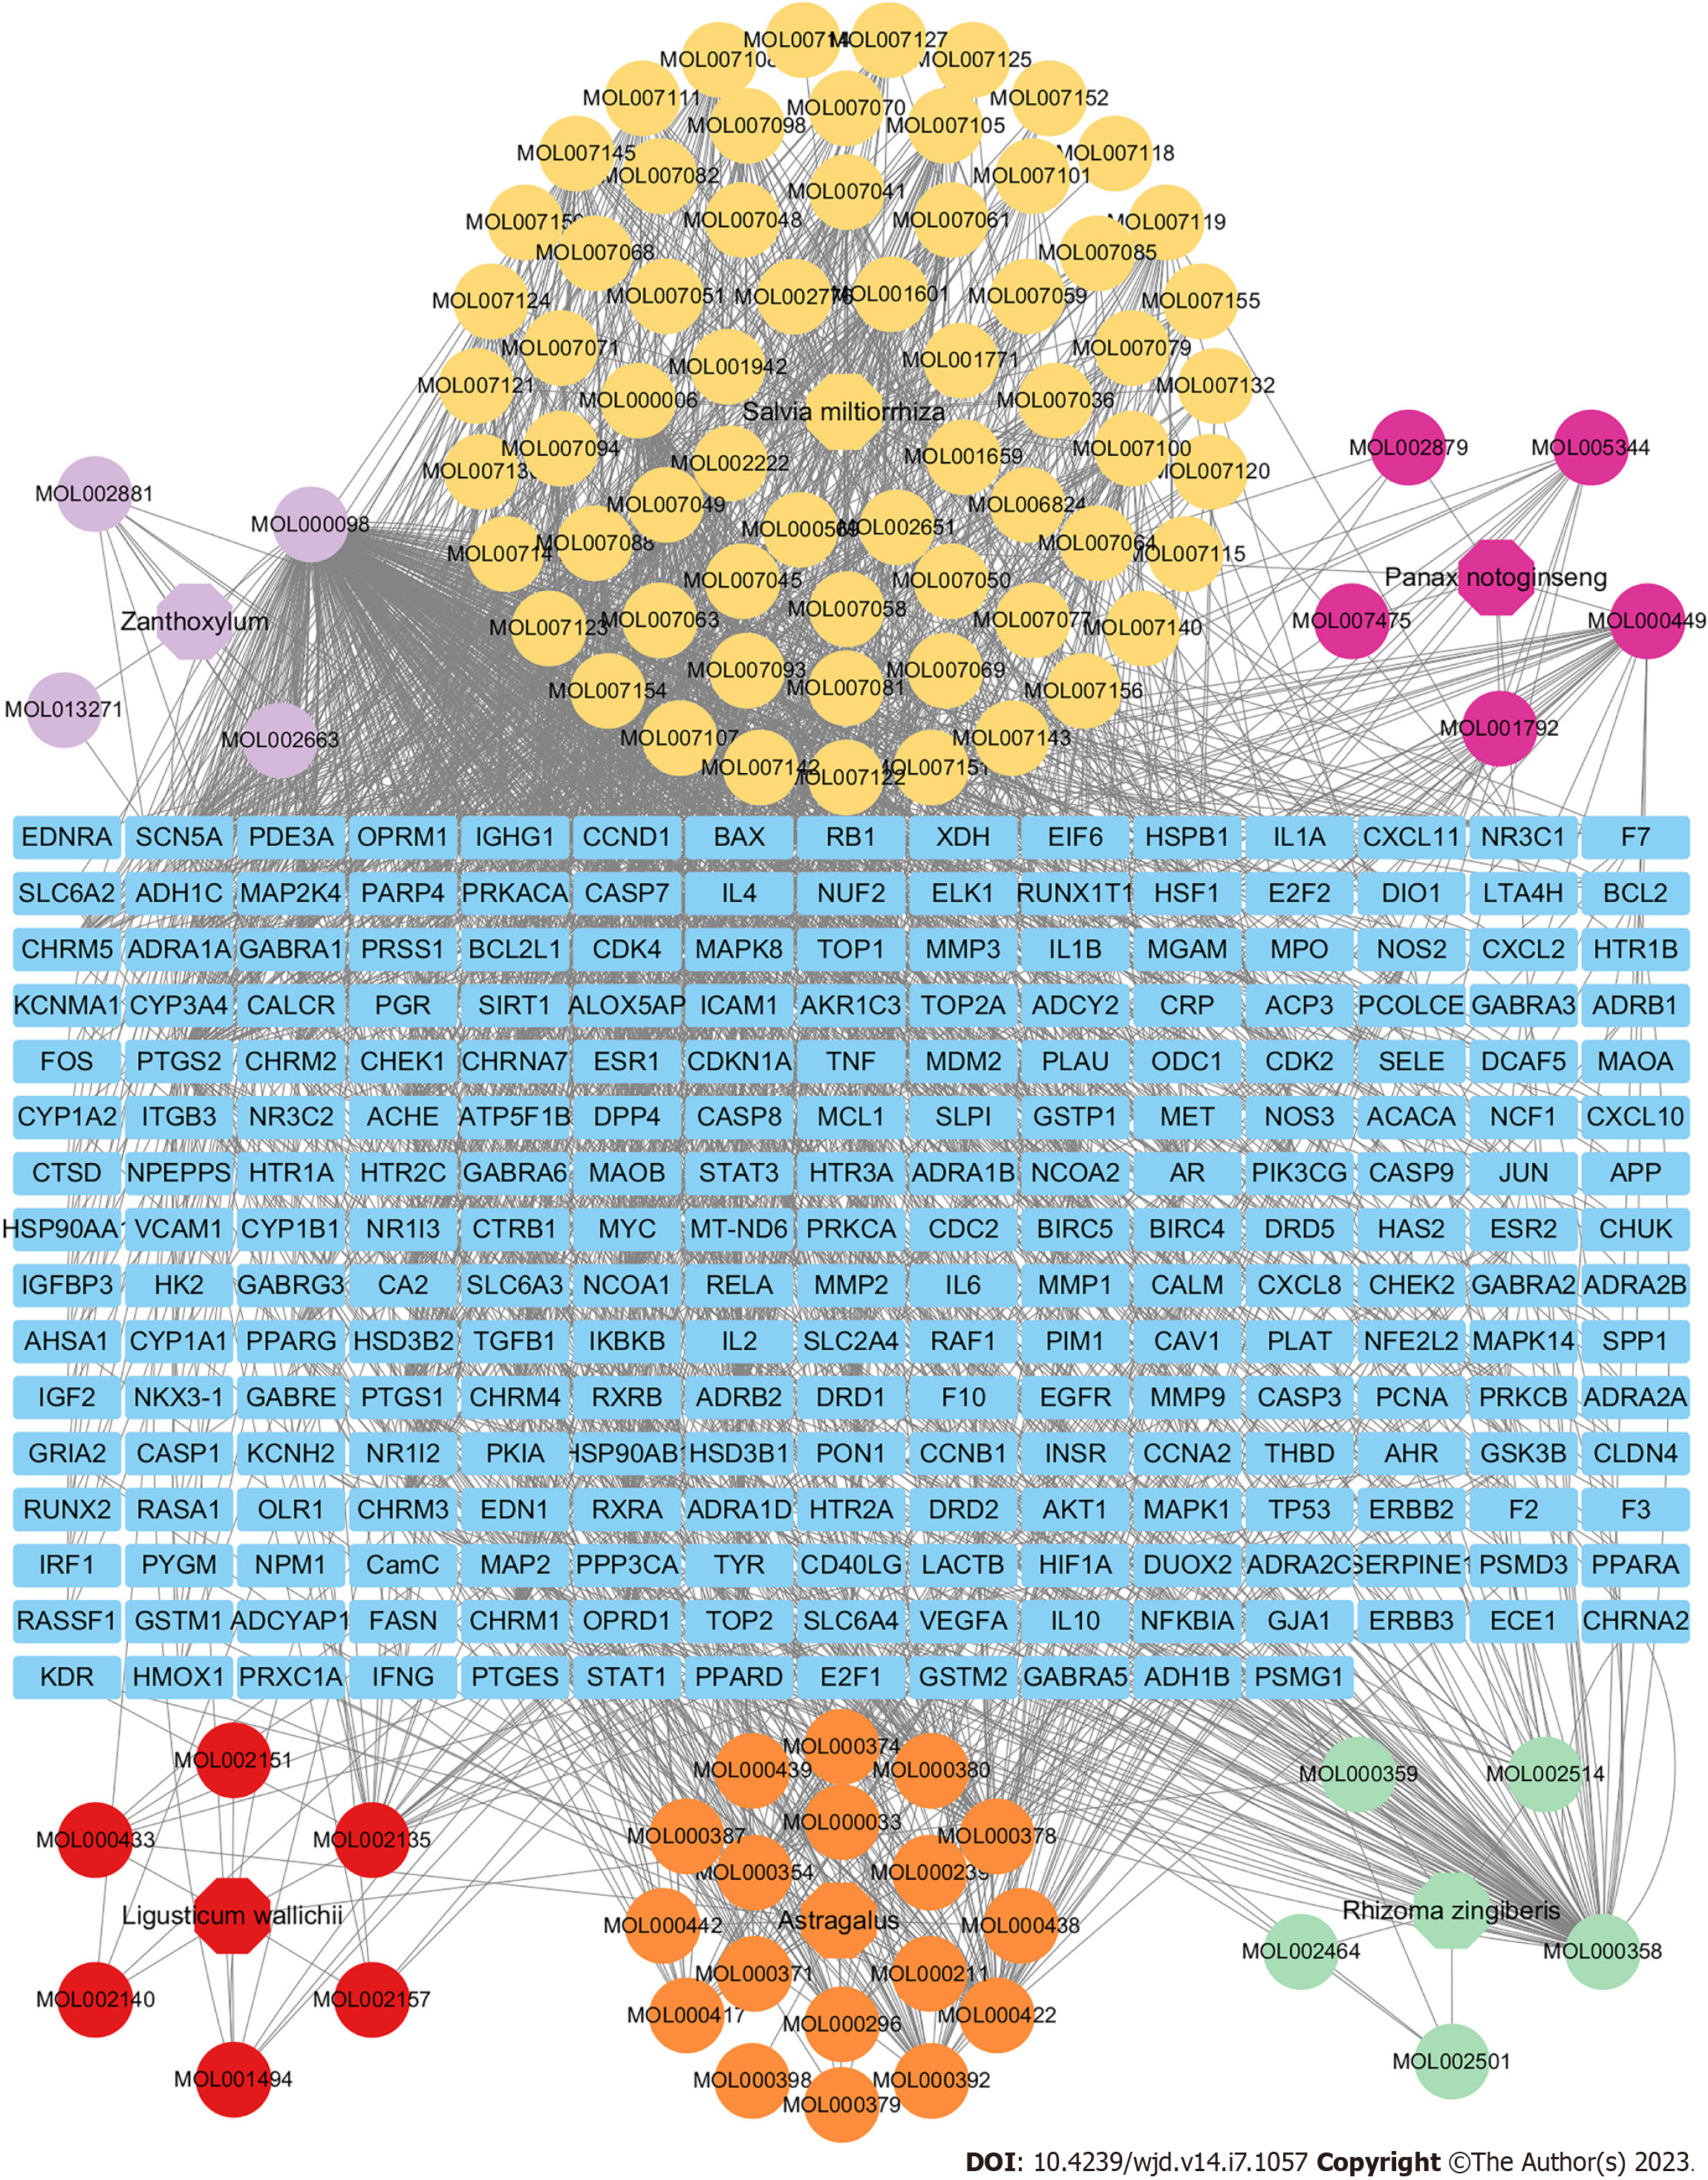
Figure 2 Relationship network among herbs, active compounds, and targets of Shuxin decoction.
In the network, blue rectangle indicates targets. The colored ellipses represent respectively the main components of six herbs: Astragalus (orange), Zanthoxylum (light purple), Rhizoma zingiberis (green), Salvia miltiorrhiza (yellow), Panax notoginseng (deep purple), and Ligusticum wallichii (red). Grey lines indicate the interrelationships among the herbs, active compounds, and targets.
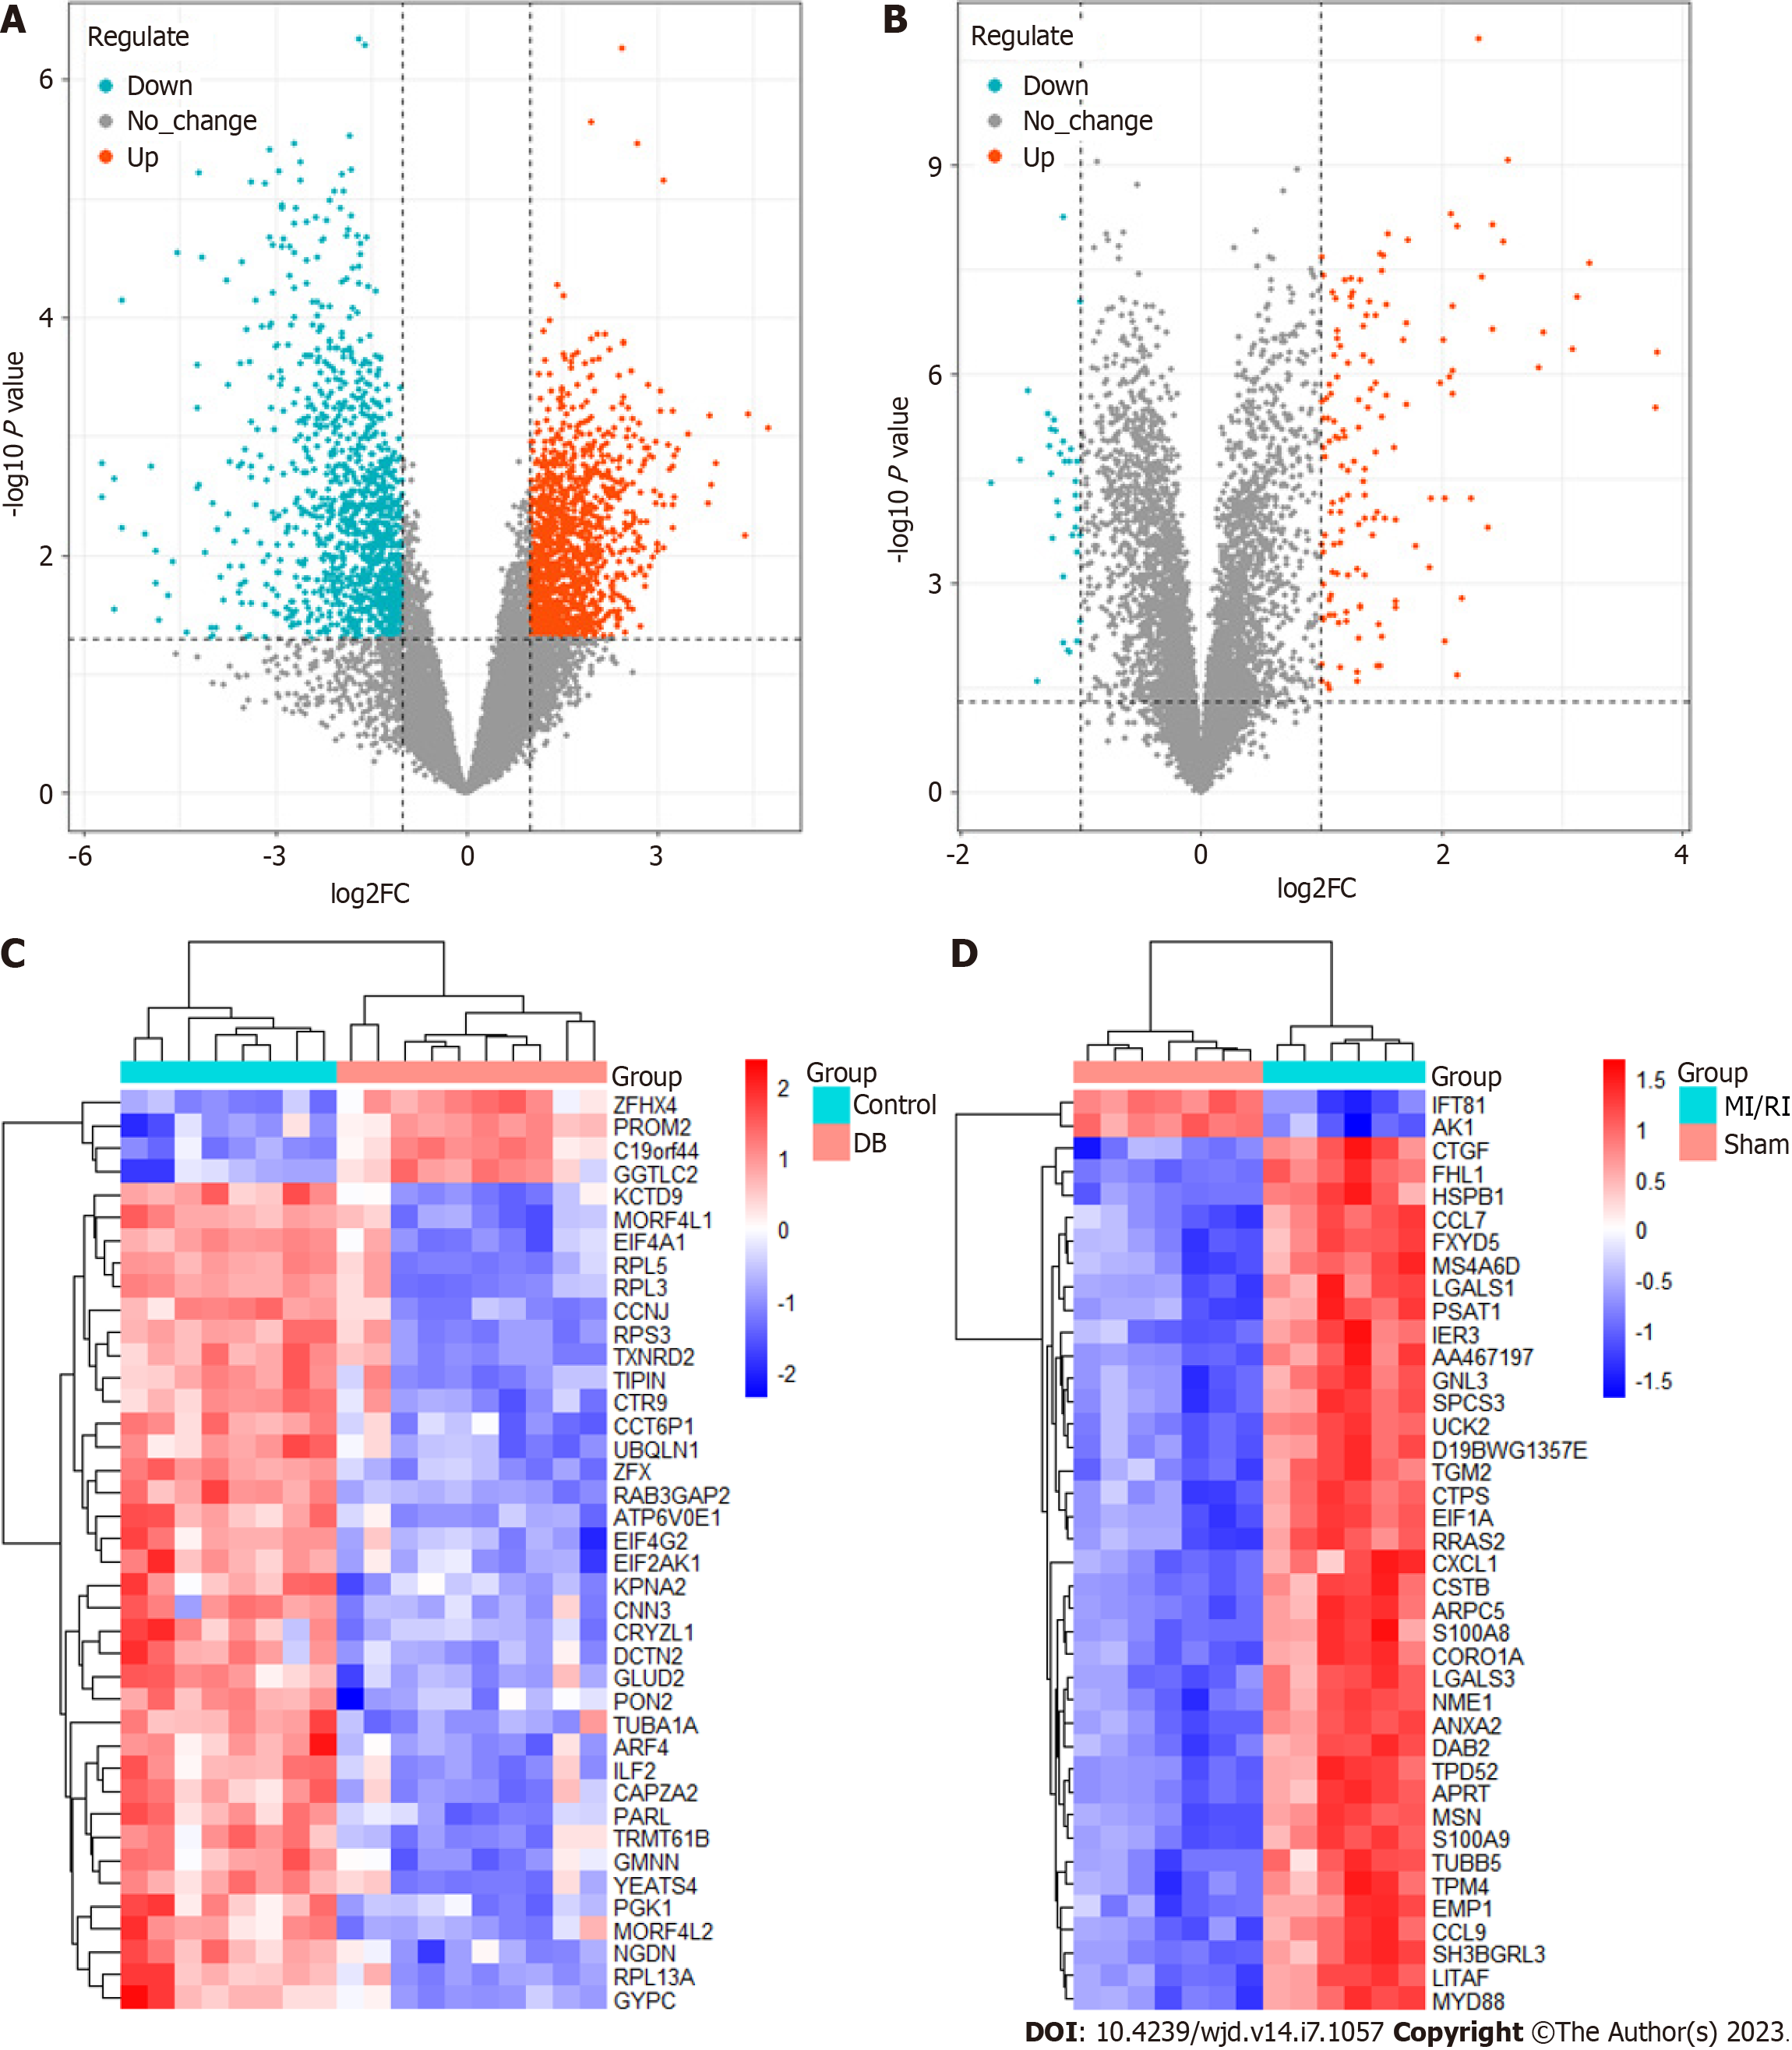
Figure 3 Differentially expressed genes related to diabetes or myocardial ischemia/reperfusion injury in Gene Expression Omnibus datasets.
A: Volcano map of differentially expressed genes (DEGs) related to diabetes (GSE118139, GSE161355, and GSE193626); B: Volcano map of DEGs related to myocardial ischemia/reperfusion injury (MI/RI) (GSE36875 and GSE210611); C: Heat map of DEGs related to diabetes (GSE118139, GSE161355, and GSE193626); D: Heat map of DEGs related to MI/RI (GSE36875 and GSE210611). MI/RI: Myocardial ischemia/reperfusion injury.
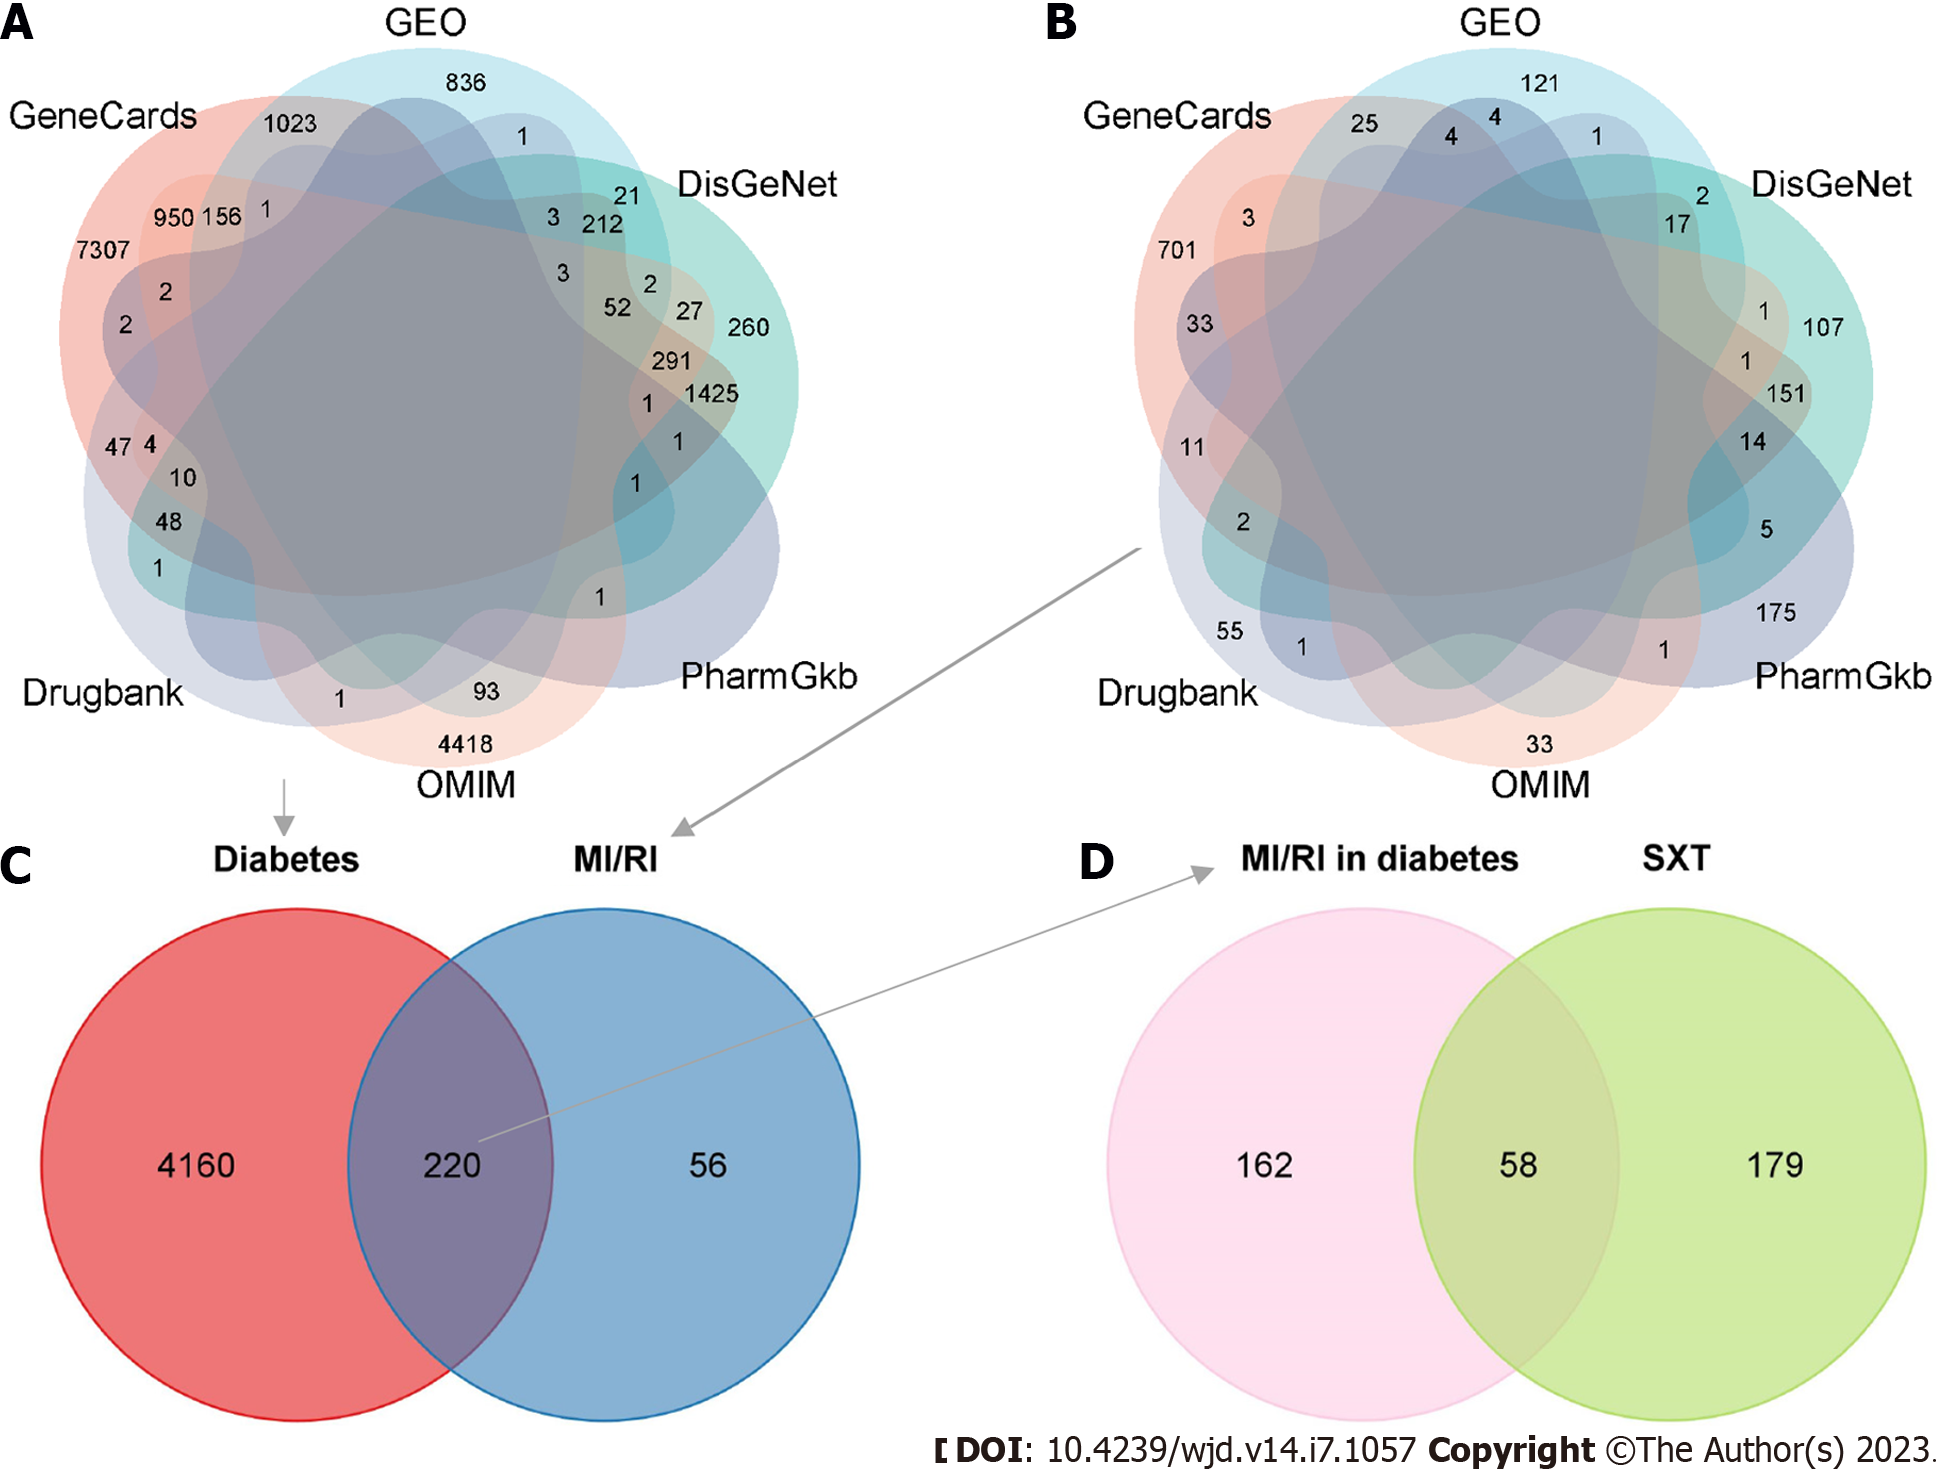
Figure 4 Targets related to Shuxin decoction for attenuating myocardial ischemia/reperfusion injury in diabetes.
A: Venn diagram of diabetes therapeutic targets in six disease databases; B: Venn diagram of myocardial ischemia/reperfusion injury (MI/RI) therapeutic targets in six disease databases; C: Venn diagram of diabetes related targets and MI/RI related targets; D: Venn diagram of the targets in at least two databases in C and the therapeutic targets of Shuxin decoction. MI/RI: Myocardial ischemia/reperfusion injury; SXT: Shuxin decoction; GEO: Gene Expression Omnibus.
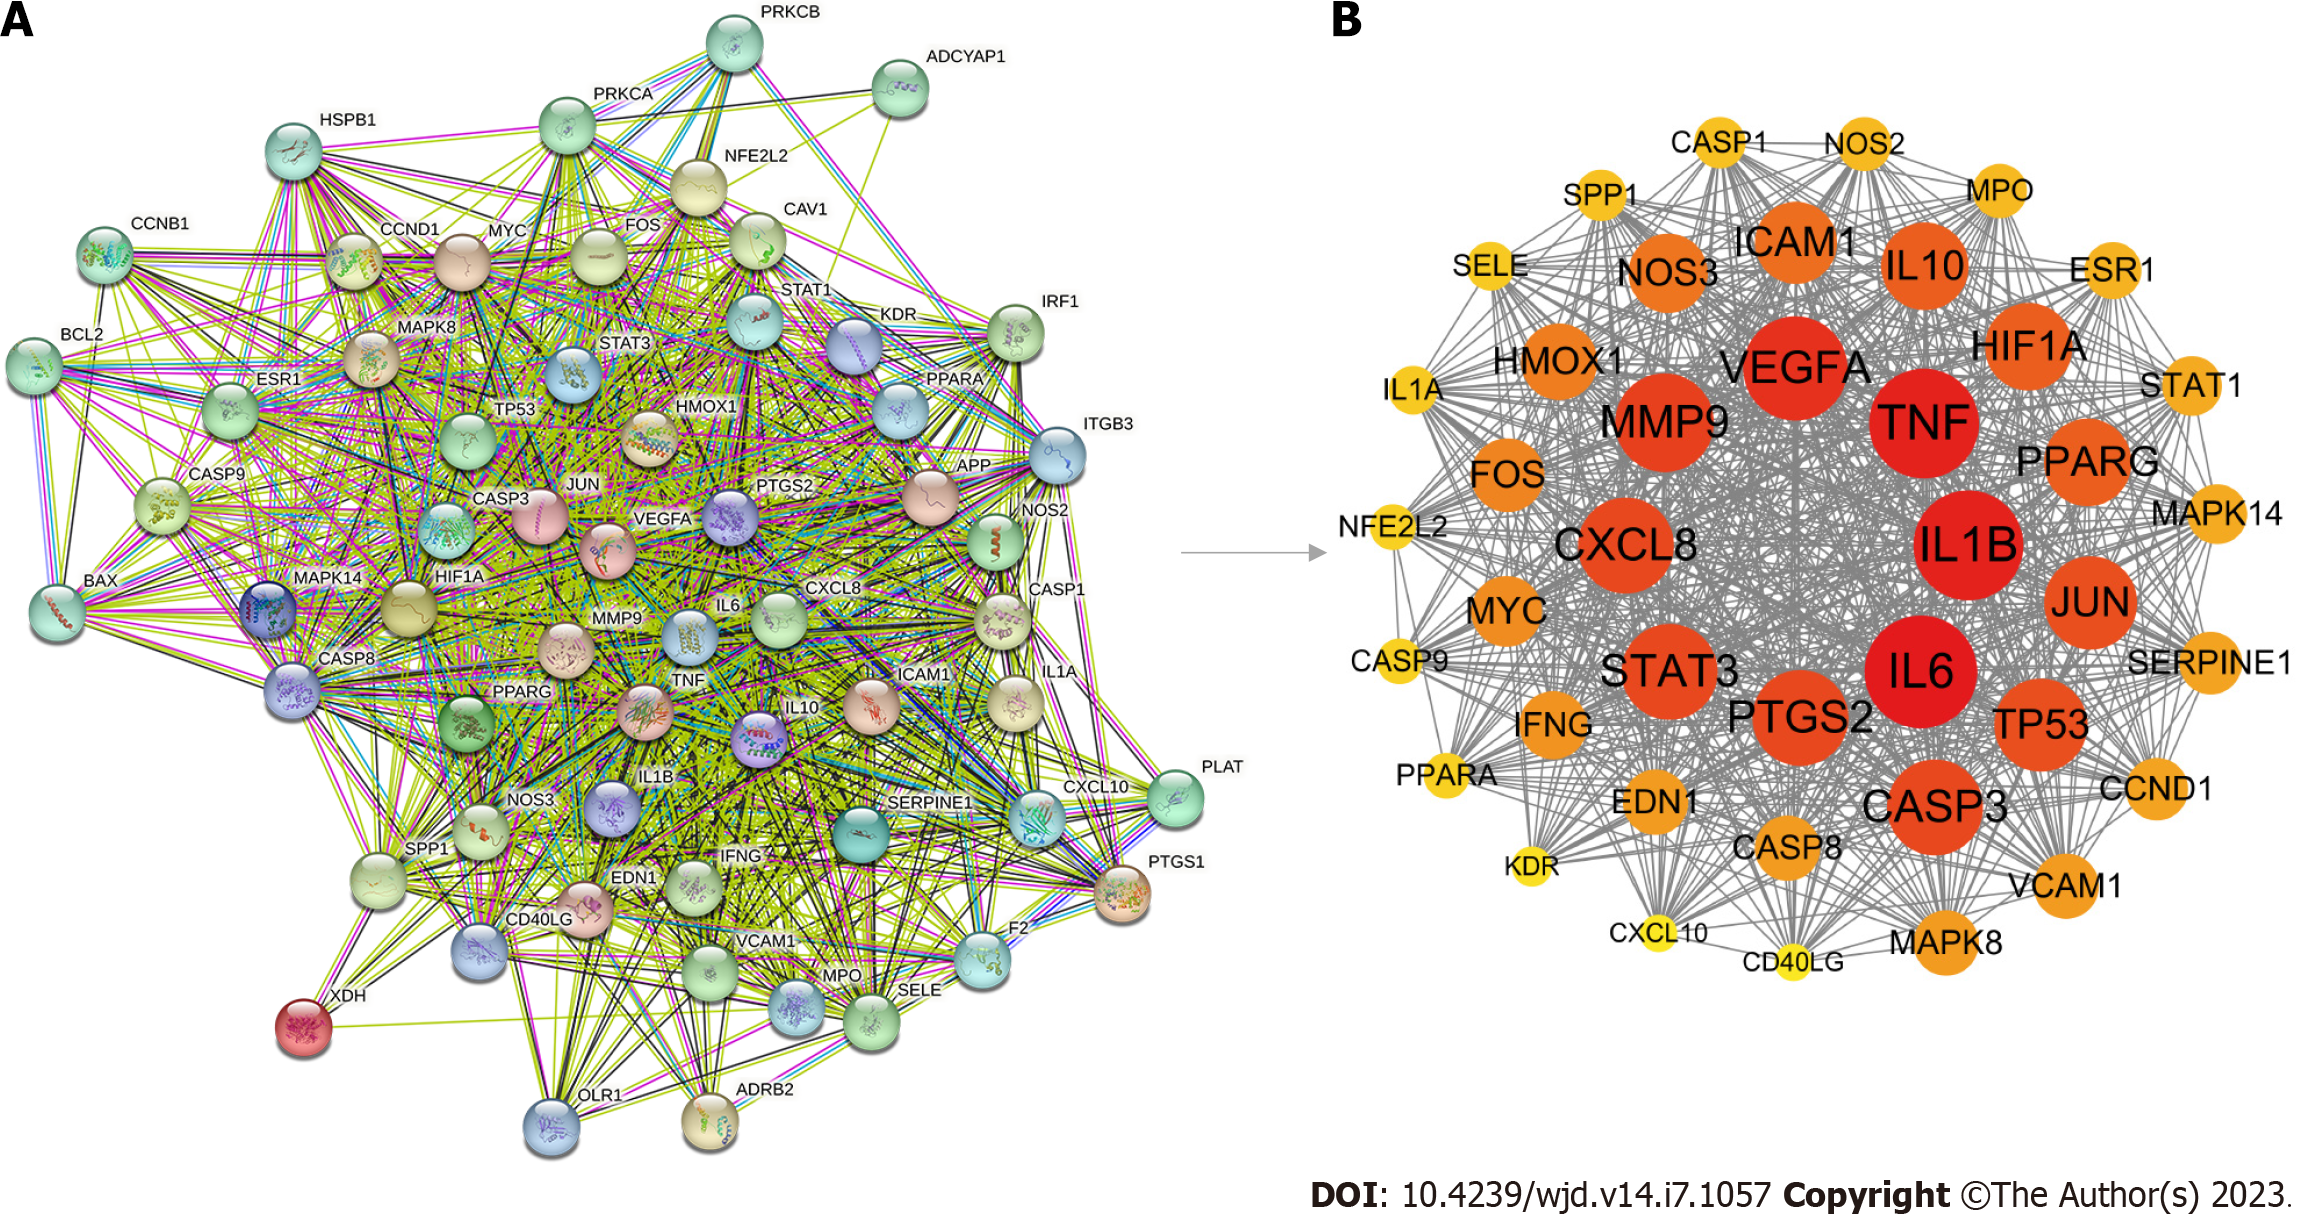
Figure 5 Protein-protein interaction network of targets related to Shuxin decoction for attenuating myocardial ischemia/reperfusion injury in diabetes.
A: Protein-protein interaction (PPI) network of 58 targets generated by STRING 11.5; B: PPI network of 41 key therapeutic targets constructed via Cytoscape 3.9.0 software. In accordance with the degree value, the targets are organized in a descending order, ranging from the highest degree to the lowest degree.
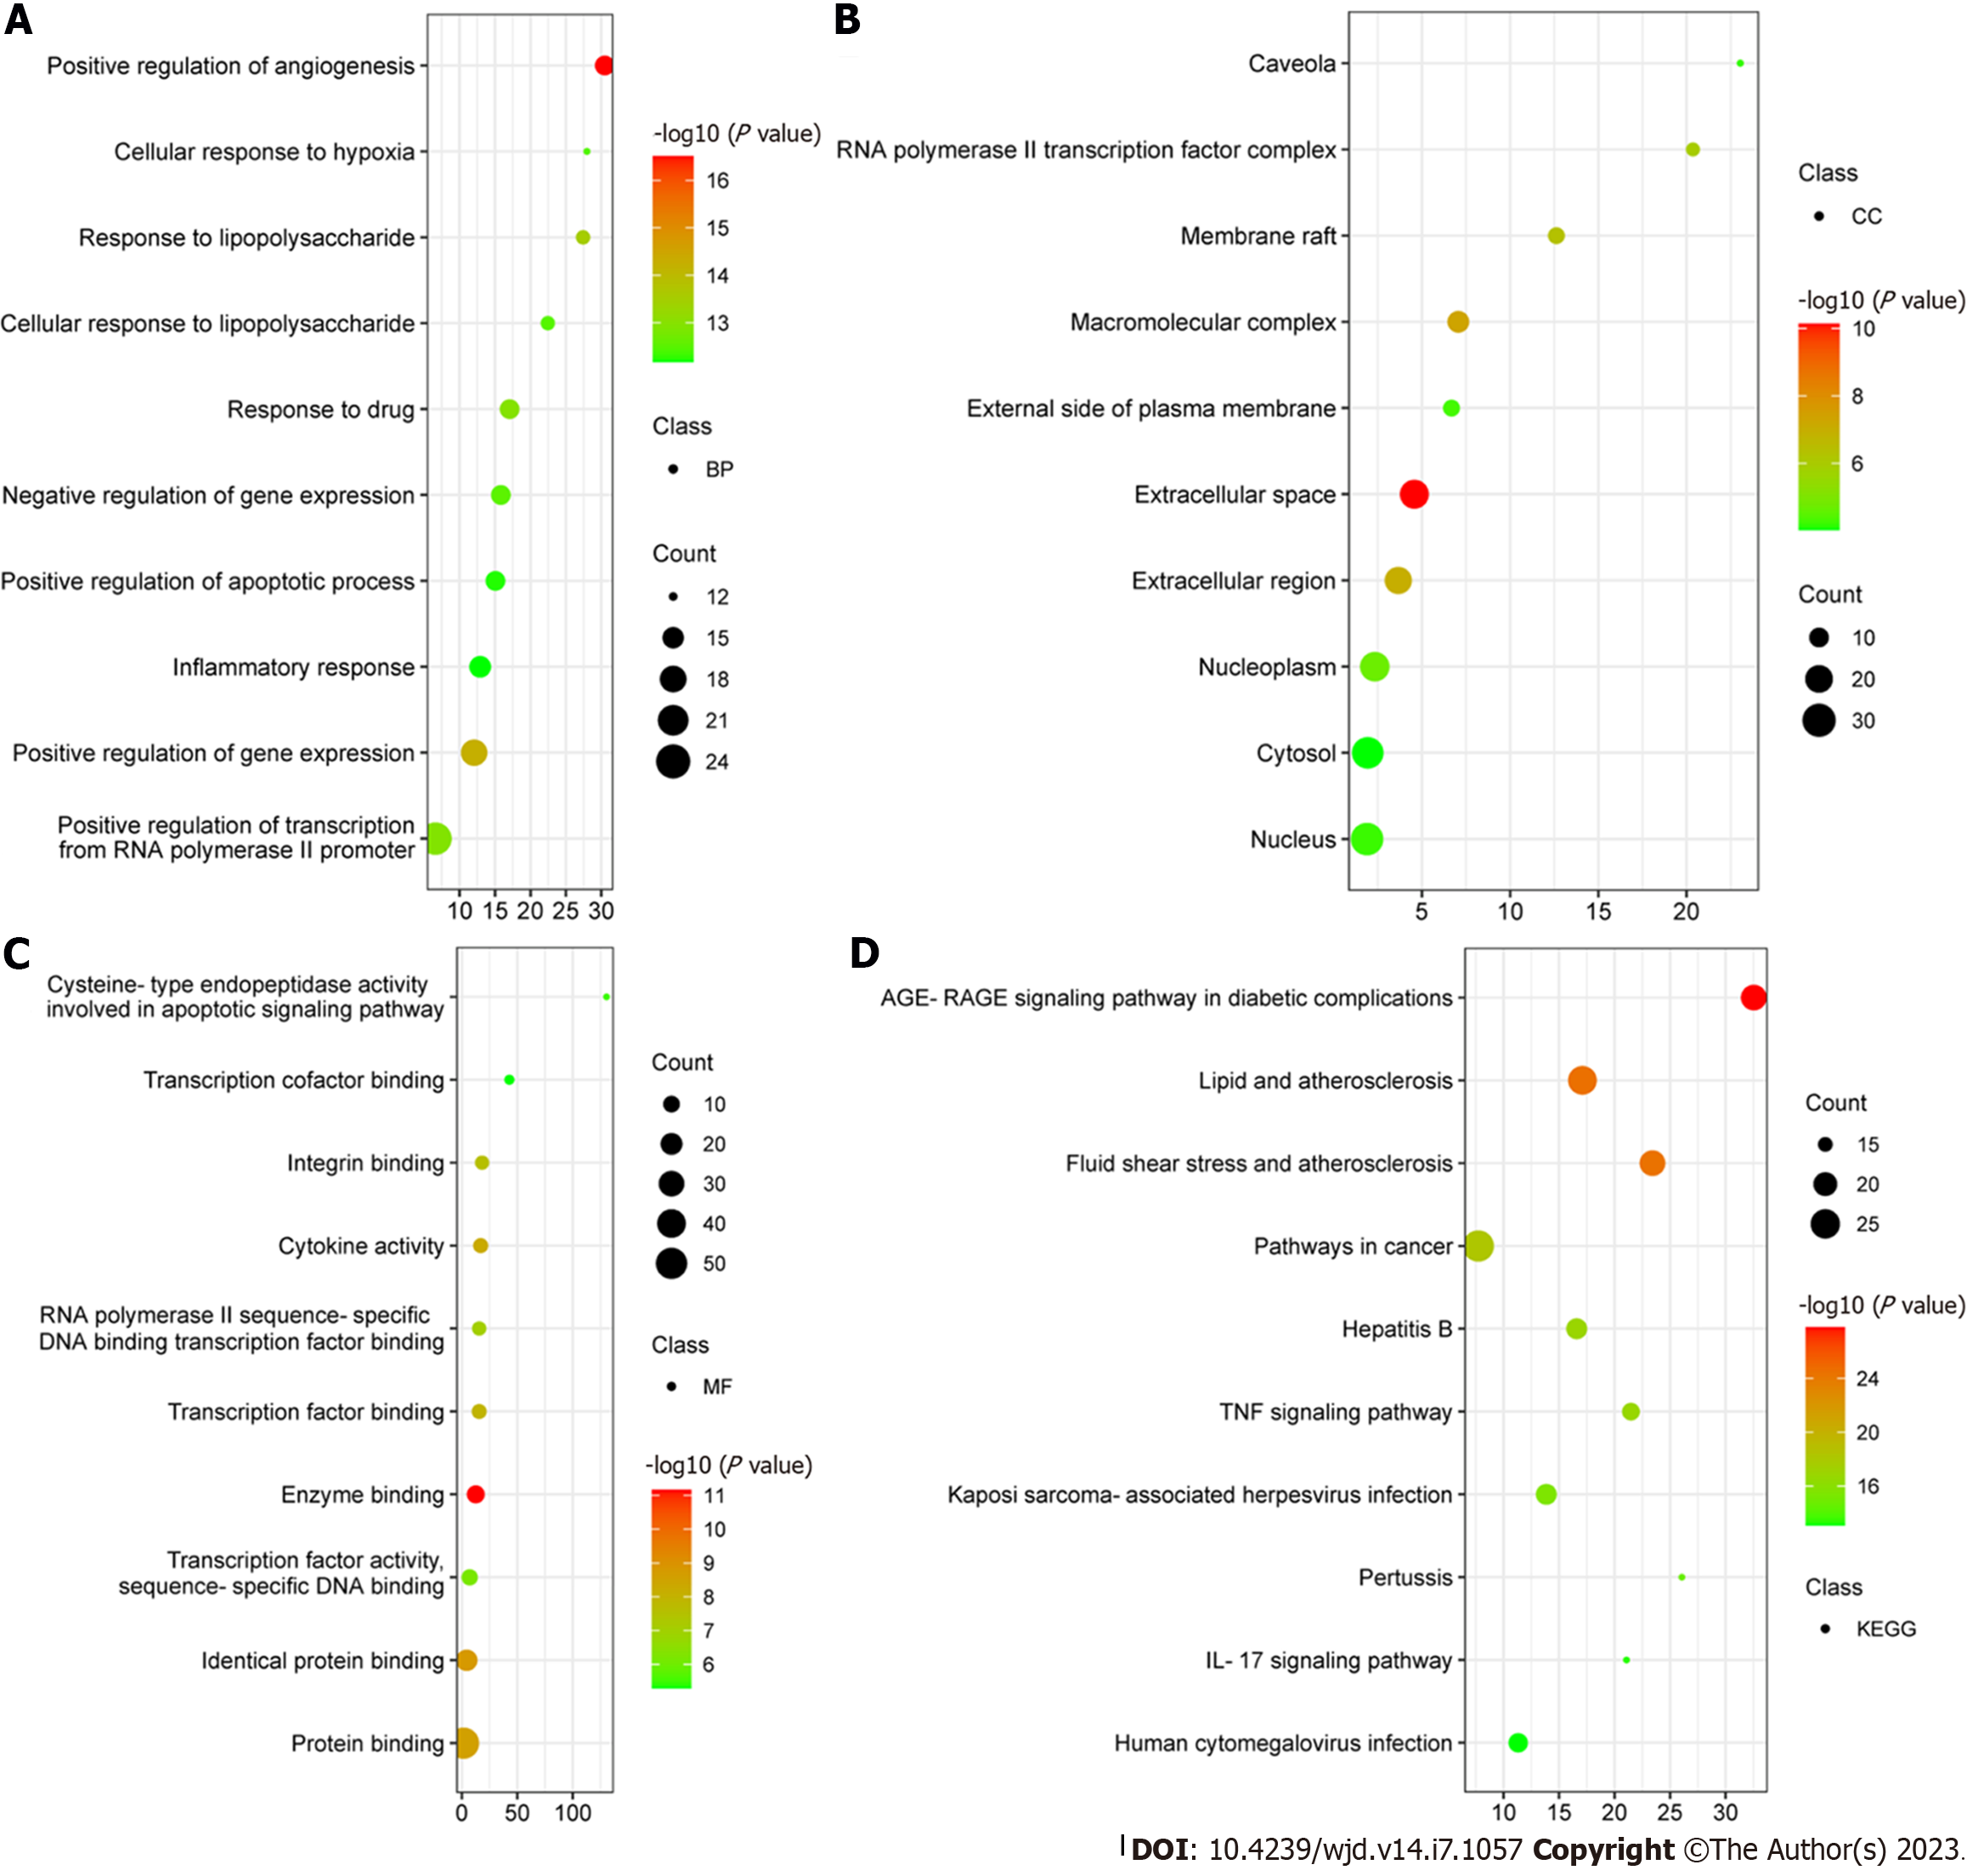
Figure 6 Gene Ontology and Kyoto Encyclopedia of Genes and Genomes enrichment analysis.
A: Top ten biological process terms according to the degree value; B: Top ten cellular component terms according to the degree value; C: Top ten molecular function terms according to the degree value; D: Top ten Kyoto Encyclopedia of Genes and Genomes terms according to the degree value. BP: Biological process; CC: Cellular component; MF: Molecular function; KEGG: Kyoto Encyclopedia of Genes and Genomes; IL: Interleukin; TNF: Tumor necrosis factor.
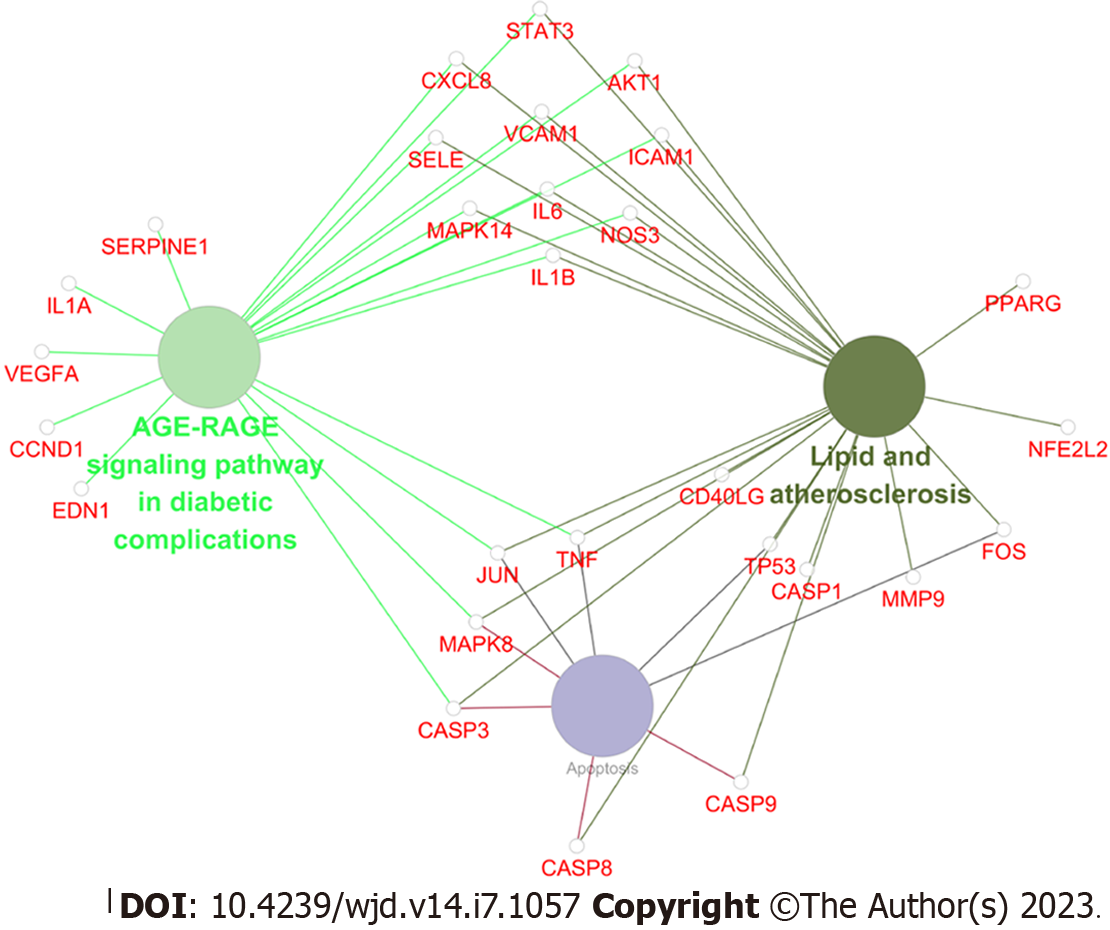
Figure 7 Forty-one key therapeutic targets enriched in advanced glycation end products-receptor for advanced glycation end products signaling pathway in diabetic complications, lipids and atherosclerosis signaling pathway, and apoptosis.
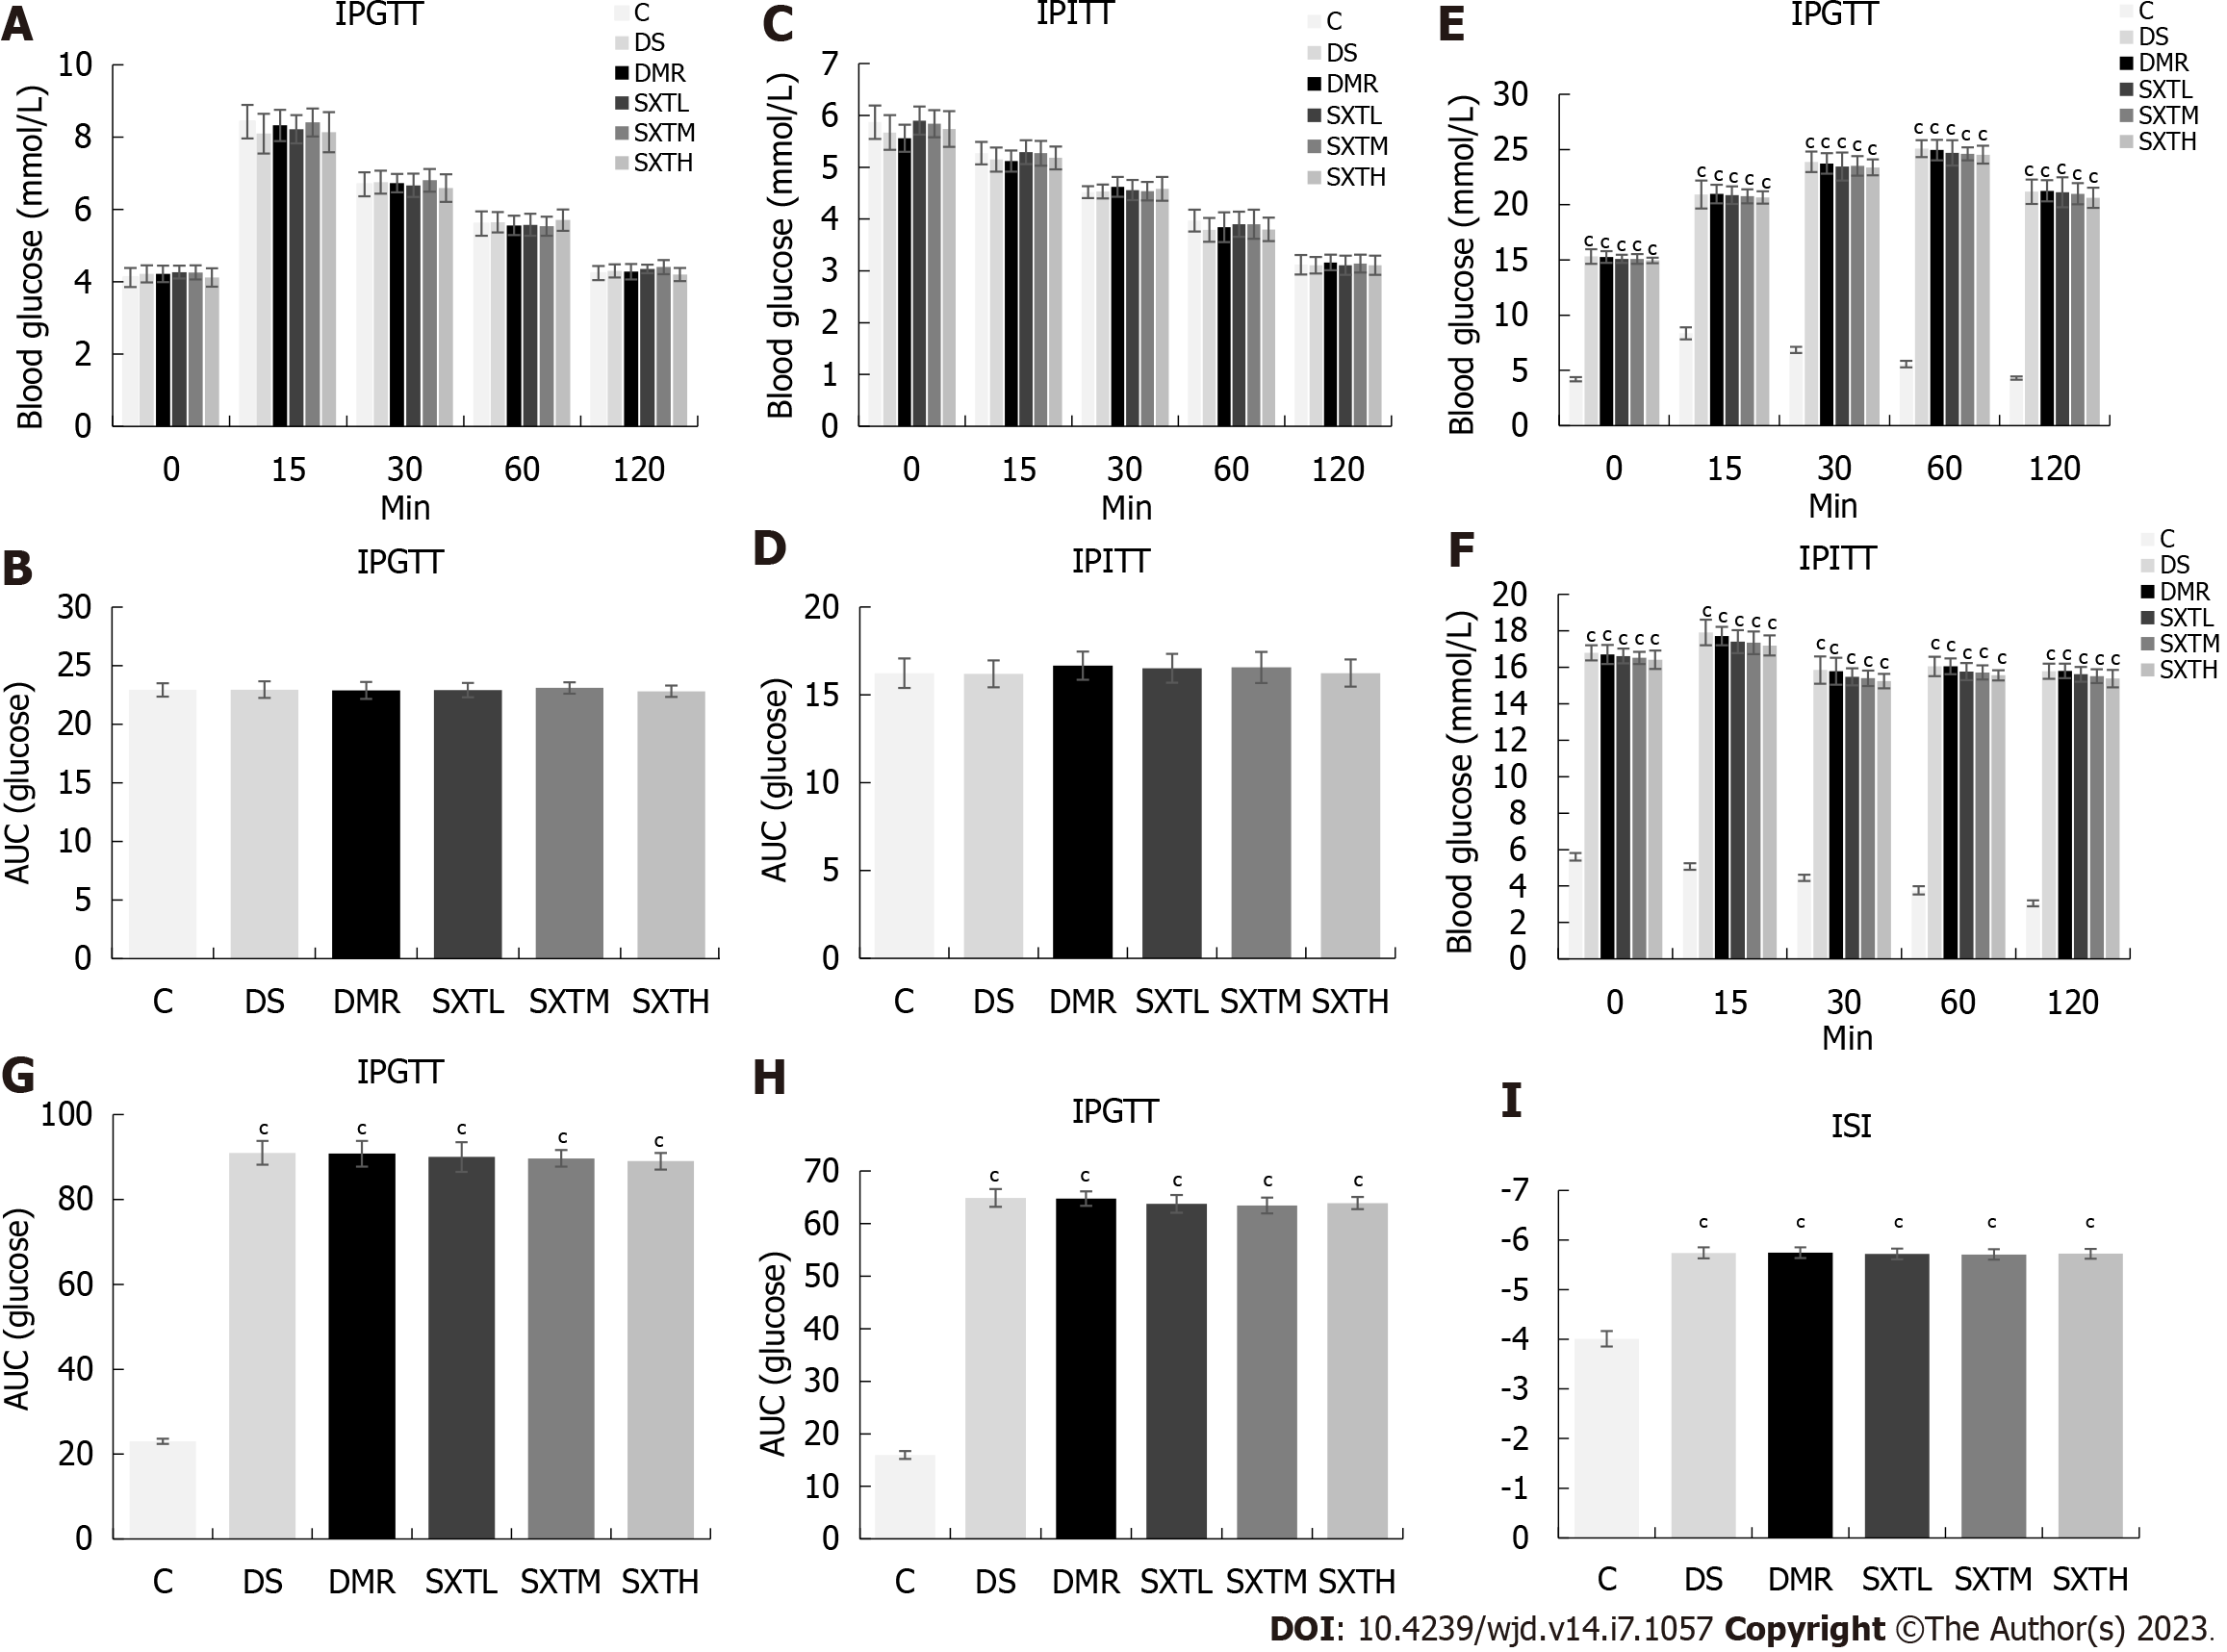
Figure 8 Intraperitoneal glucose tolerance test, intraperitoneal insulin tolerance test, and international sensitivity index of rats.
A: Intraperitoneal glucose tolerance test (IPGTT) at baseline; B: Average area under the curve (AUC) of IPGTT at baseline; C: Intraperitoneal insulin tolerance test (IPITT) at baseline; D: Average AUC of IPITT at baseline; E: IPGTT at the end of the experiment; F: IPITT at the end of the experiment; G: Average AUC of IPGTT at the end of the experiment; H: Average AUC of IPITT at the end of the experiment; I: International sensitivity index (ISI) at the end of the experiment. ISI = 1(/Log FPG × Log FINS). cP < 0.001 vs group C (n = 8-10 rats per group). IPGTT: Intraperitoneal glucose tolerance test; IPITT: Intraperitoneal insulin tolerance test; C: Normal control group; DS: Diabetic rats with sham operation group; MI/RI: Myocardial ischemia/reperfusion injury; DMR: MI/RI in diabetes group; SXTL: MI/RI in diabetic rats receiving SXT 0.7 g/kg/d group; SXTM: MI/RI in diabetic rats receiving SXT 1.4 g/kg/d group; SXTH: MI/RI in diabetic rats receiving SXT 2.8 g/kg/d group; AUC: Area under the curve.
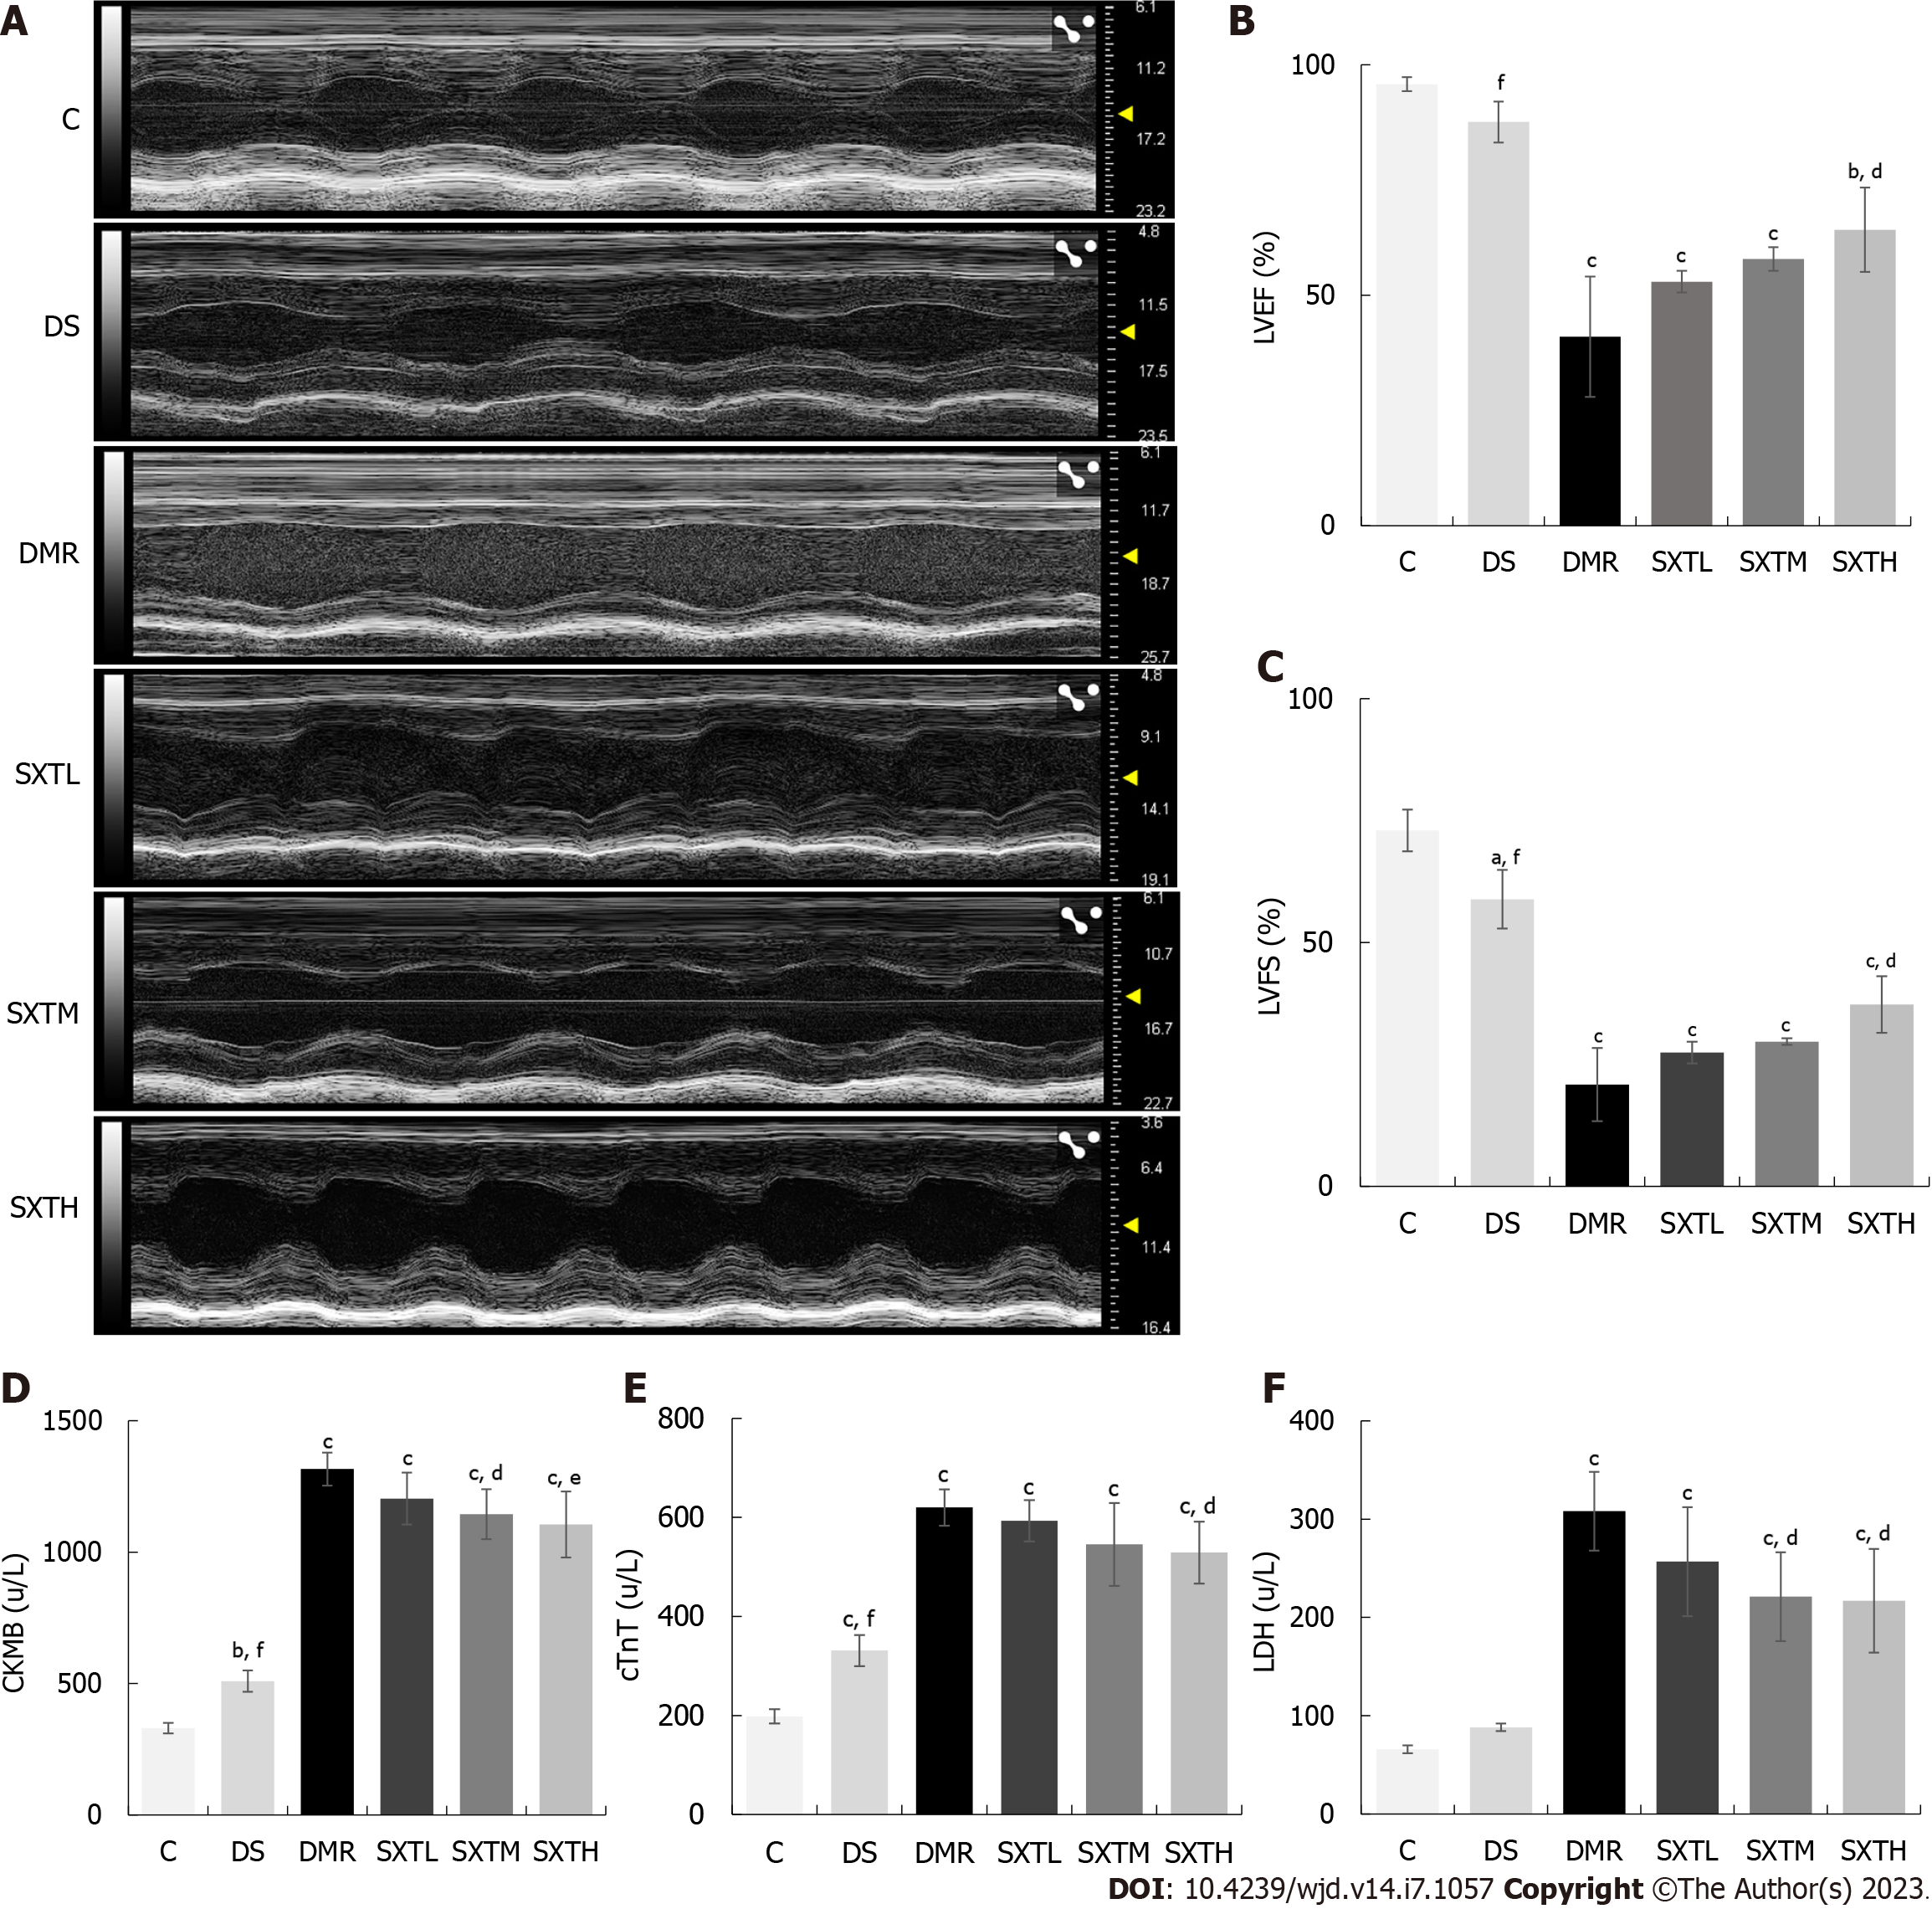
Figure 9 Echocardiography and cardiac damage markers.
A: Echocardiography after 2 h reperfusion; B: Left ventricular ejection fraction after 2 h reperfusion; C: Left ventricular fractional shortening after 2 h reperfusion; D: Creatine kinase isoenzyme MB at the end of the experiment; E: Troponin T at the end of the experiment; F: Lactate dehydrogenase at the end of the experiment. aP < 0.05, bP < 0.01, cP < 0.001 vs group C. dP < 0.05, eP < 0.01, fP < 0.001 vs myocardial ischemia/reperfusion injury in diabetes group (n = 3 rats per group). C: Normal control group; DS: Diabetic rats with sham operation group; MI/RI: Myocardial ischemia/reperfusion injury; DMR: MI/RI in diabetes group; SXTL: MI/RI in diabetic rats receiving SXT 0.7 g/kg/d group; SXTM: MI/RI in diabetic rats receiving SXT 1.4 g/kg/d group; SXTH: MI/RI in diabetic rats receiving SXT 2.8 g/kg/d group; LVEF: Left ventricular ejection fraction; LVFS: Left ventricular fractional shortening; CKMB: Creatine kinase isoenzyme MB; cTnT: Troponin T; LDH: Lactate dehydrogenase.
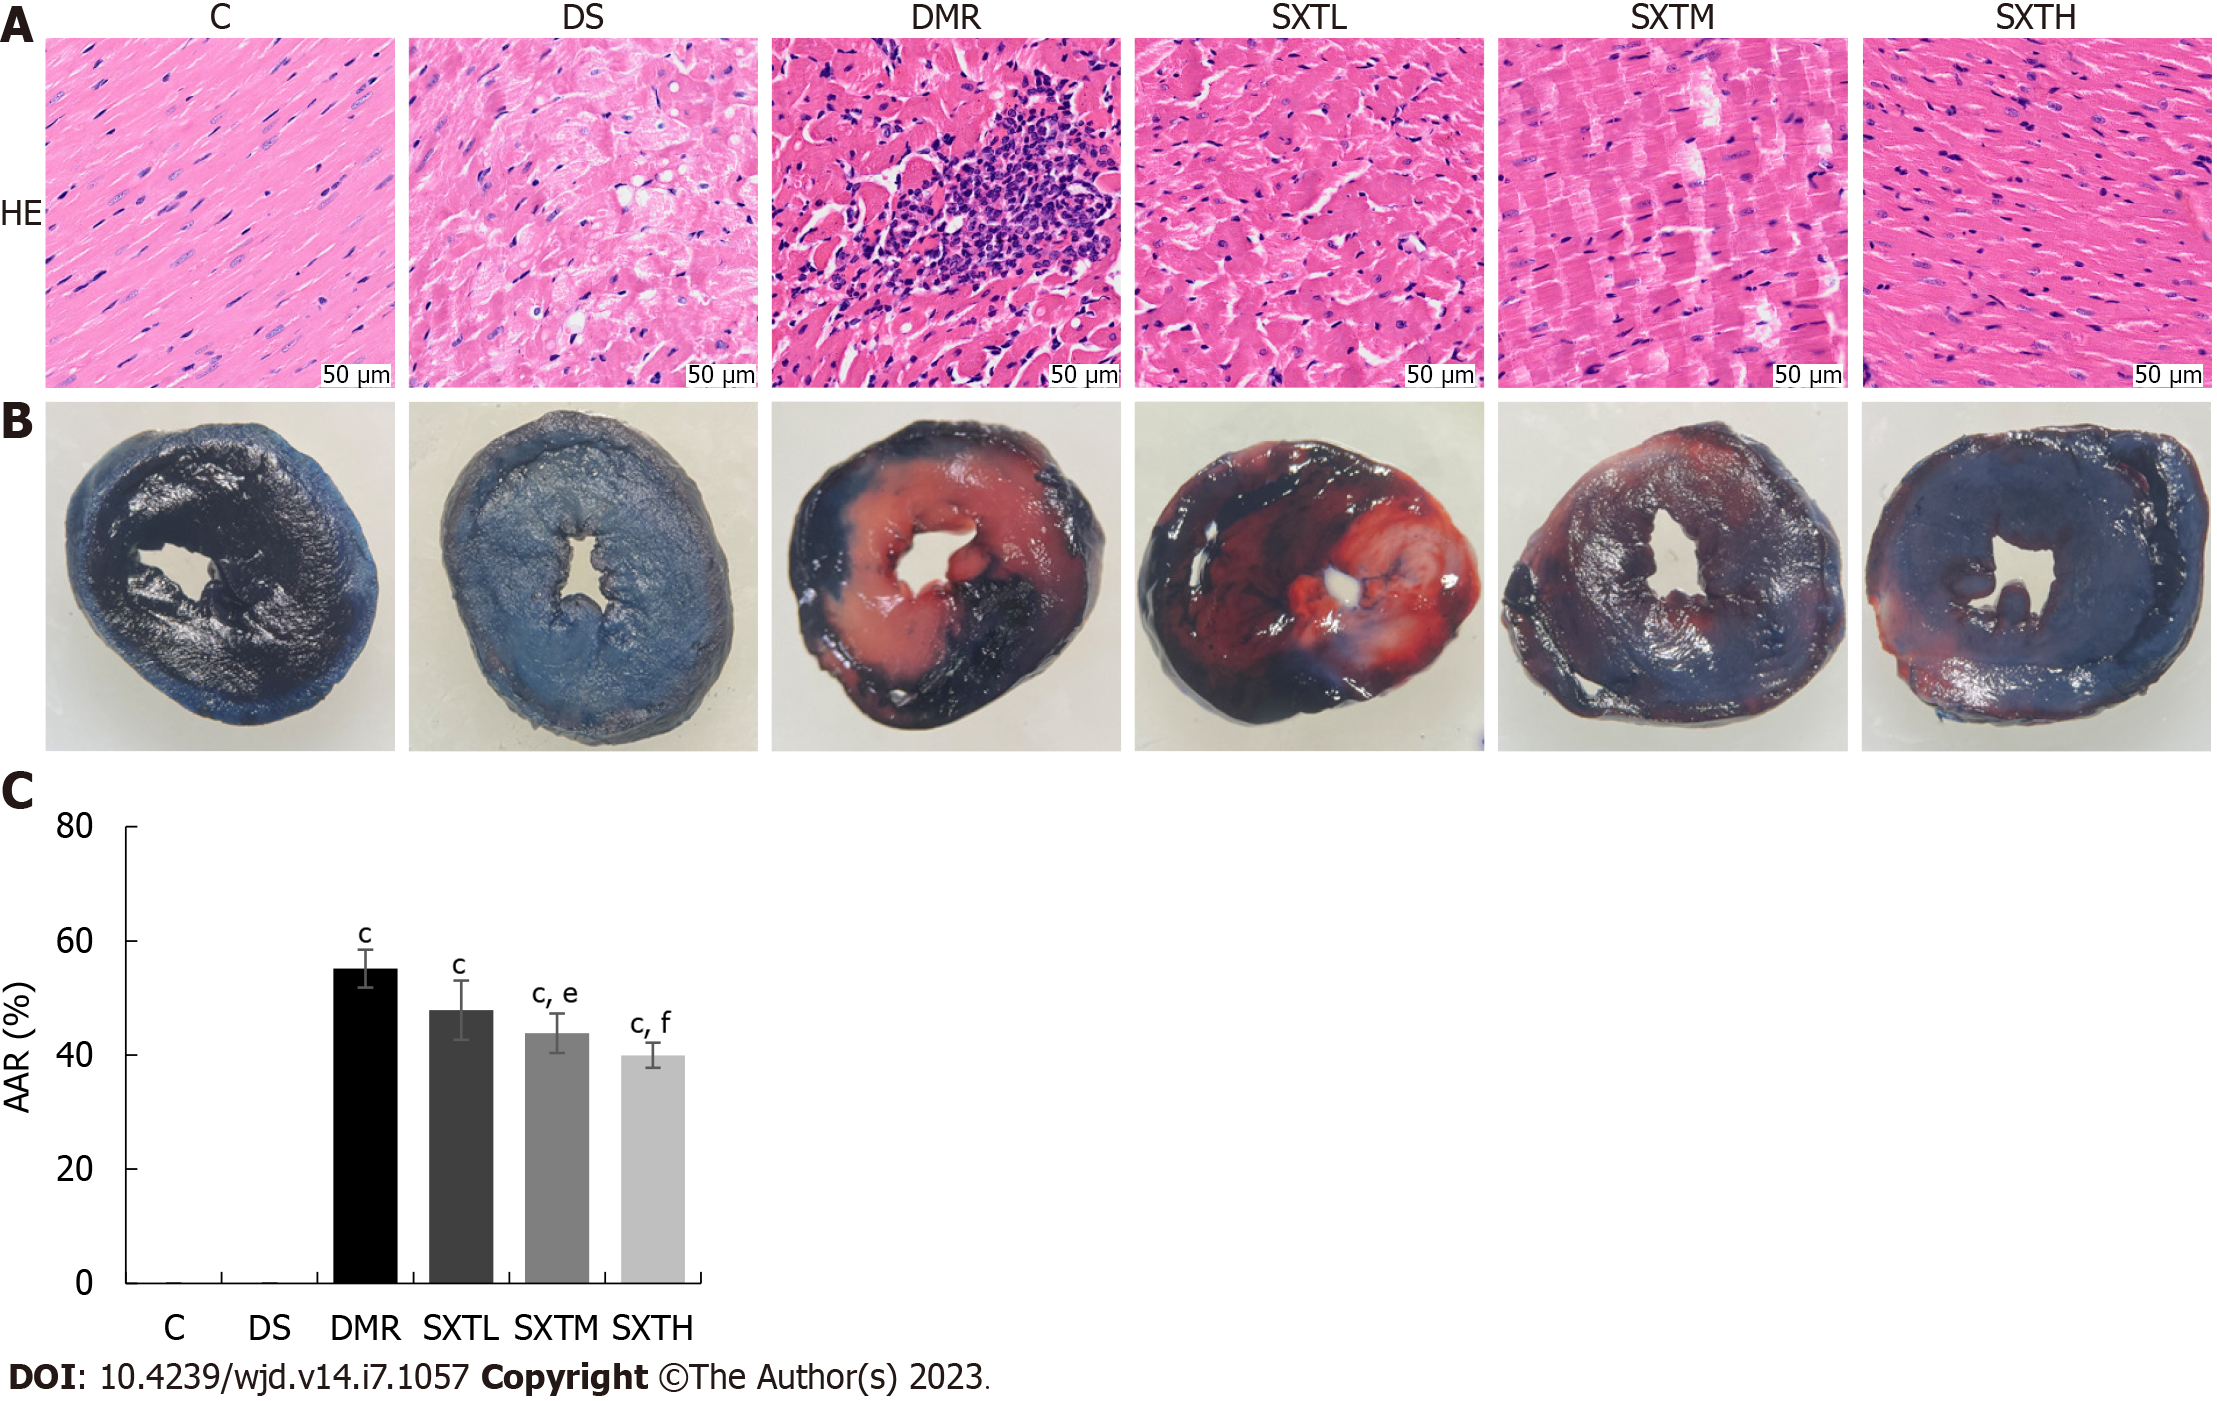
Figure 10 Pathological staining.
A: Hematoxylin and eosin staining; B: Evan’s blue-triphenyltetrazolium chloride double-staining; C: Proportion of areas at risk. cP < 0.001 vs group C. eP < 0.01, fP < 0.001 vs myocardial ischemia/reperfusion injury in diabetes group (n = 3 rats per group). C: Normal control group; DS: Diabetic rats with sham operation group; MI/RI: Myocardial ischemia/reperfusion injury; DMR: MI/RI in diabetes group; SXTL: MI/RI in diabetic rats receiving SXT 0.7 g/kg/d group; SXTM: MI/RI in diabetic rats receiving SXT 1.4 g/kg/d group; SXTH: MI/RI in diabetic rats receiving SXT 2.8 g/kg/d group; AAR: Areas at risk; HE: Hematoxylin and eosin.
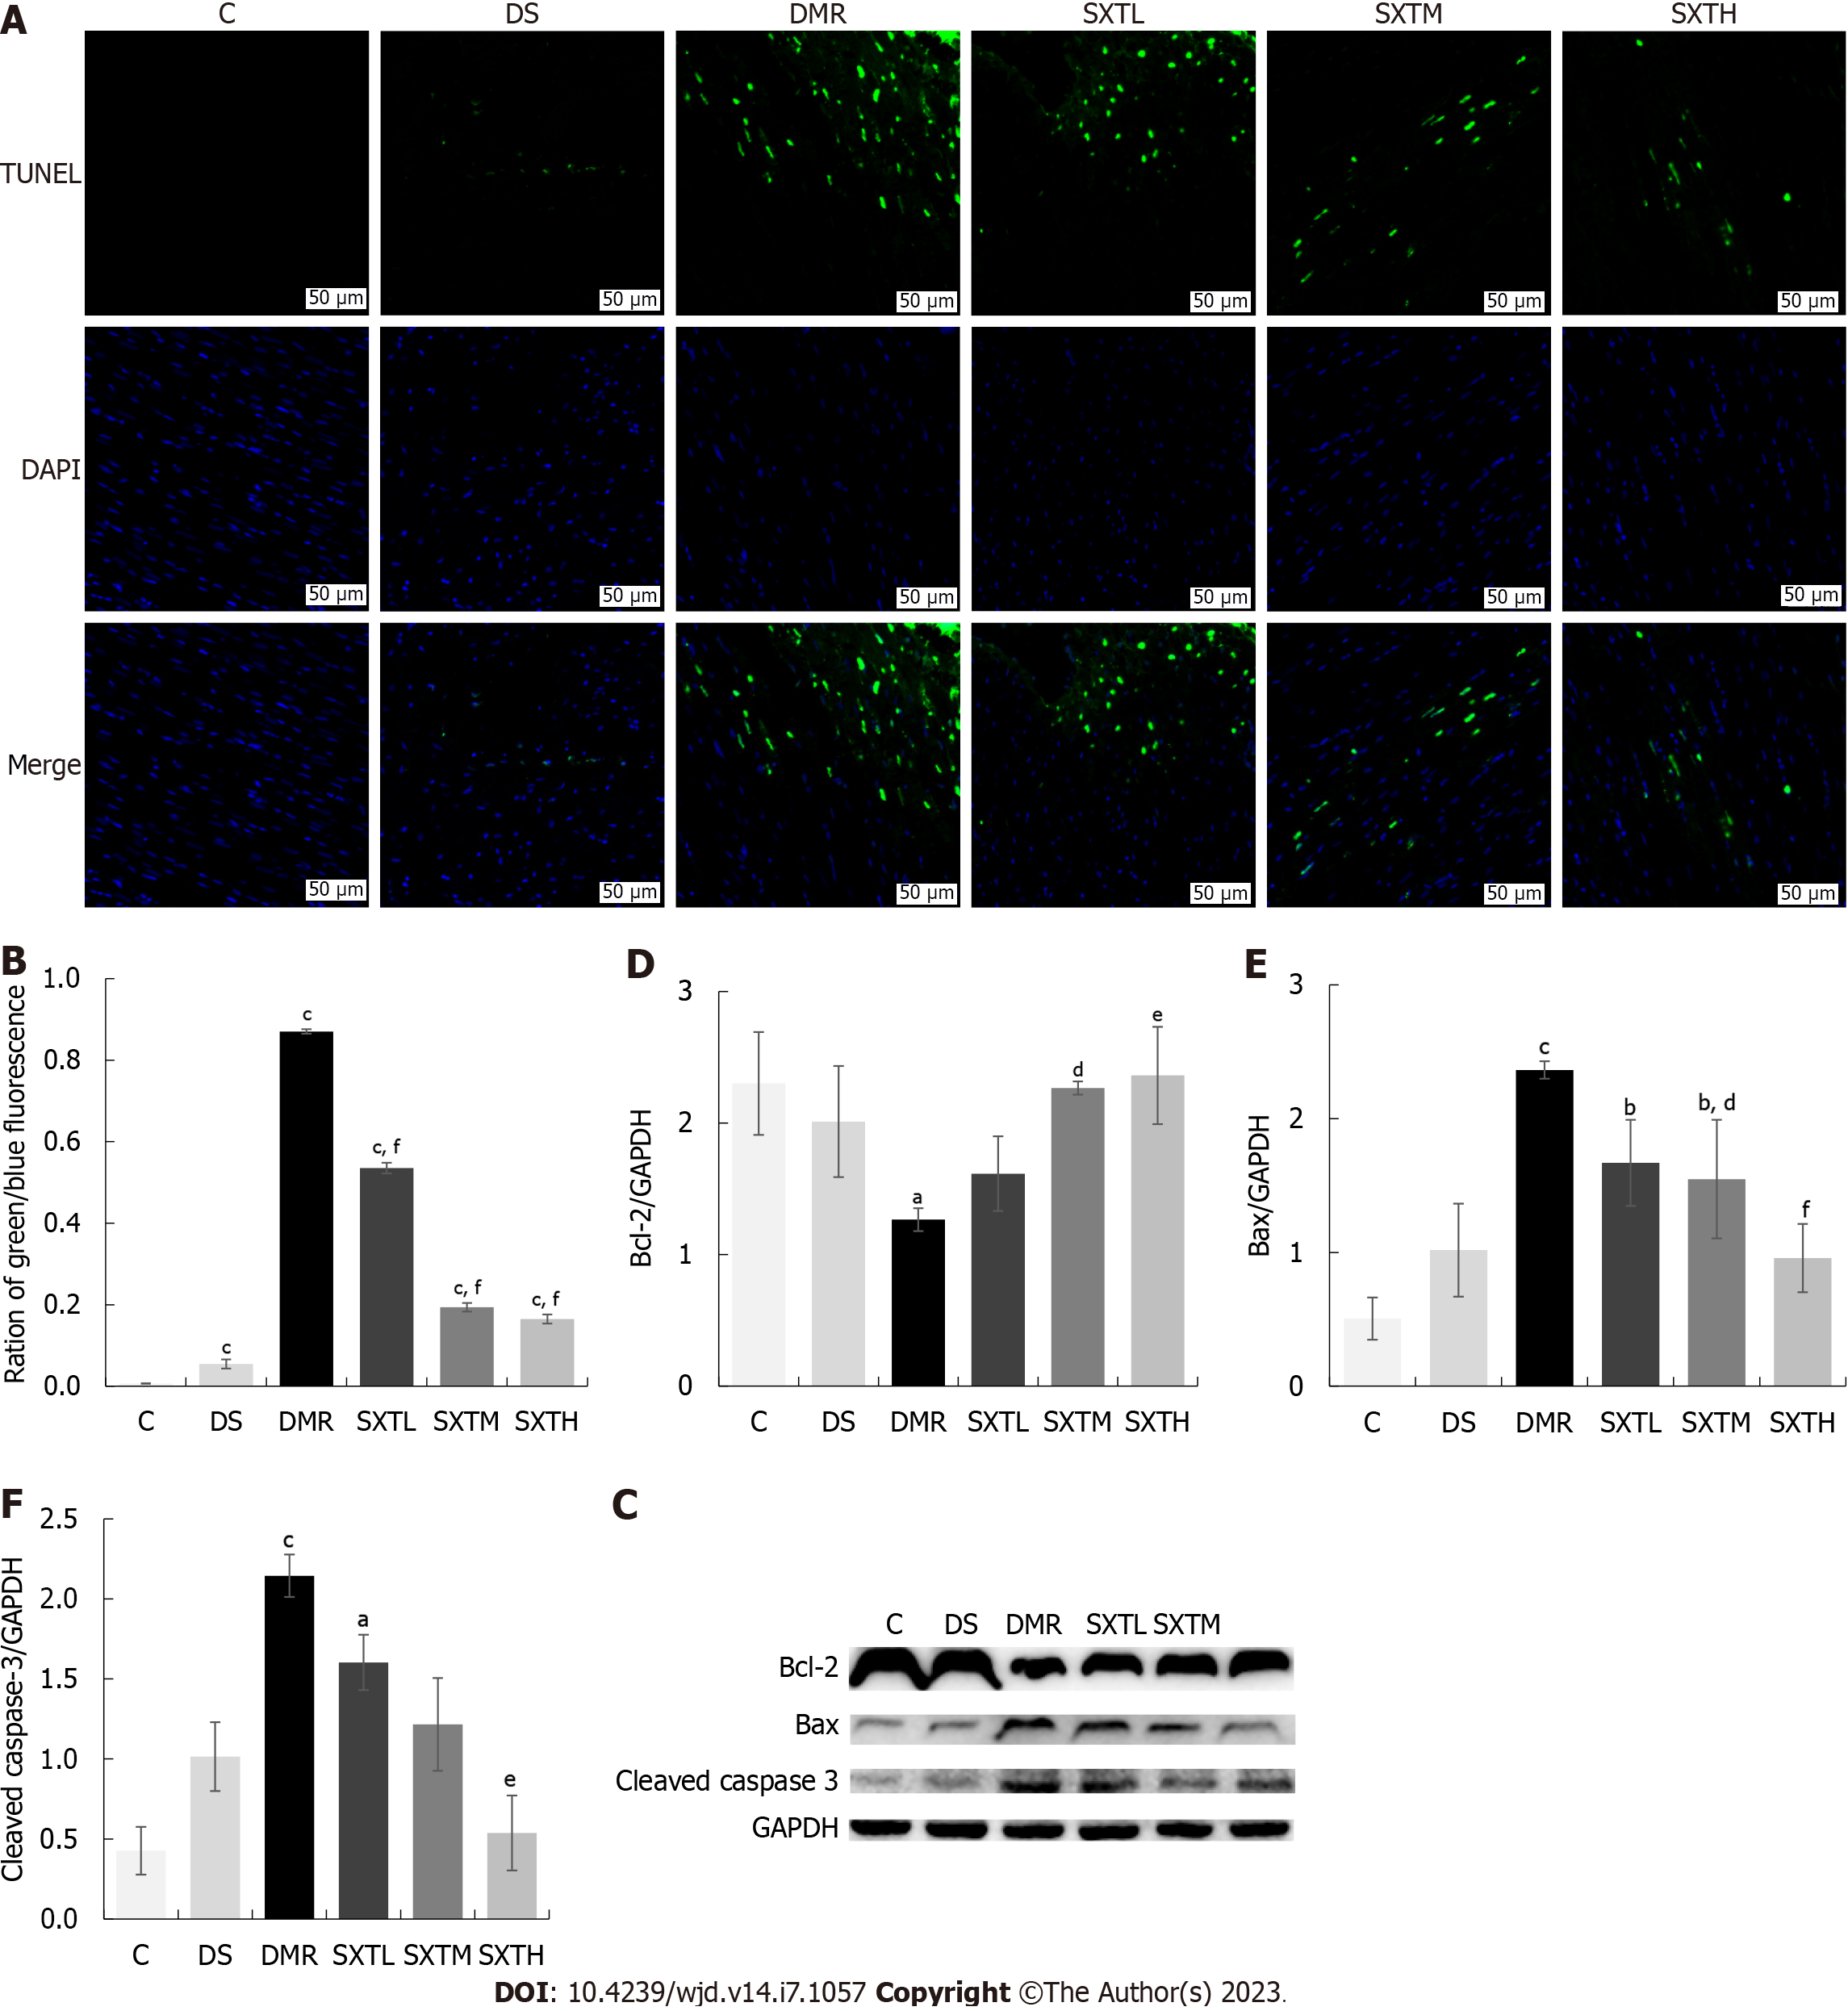
Figure 11 Shuxin decoction attenuates myocardial apoptosis in diabetic rats with myocardial ischemia/reperfusion injury.
A: TUNEL staining. TUNEL-positive nuclei are stained green, while nuclei of cardiomyocytes are blue; B: Percentage of positive apoptosis cardiomyocyte (green/blue fluorescence, magnification × 20, scale bars, 50 μM); C: Bcl-2, Bax, and cleaved caspase-3 protein levels detected by Western blot; D: Statistics of gray value of Bcl-2/GAPDH based on Western blot; E: Statistics of gray value of Bax/GAPDH based on Western blot; F: Statistics of gray value of cleaved caspase-3/GAPDH based on Western blot. aP < 0.05, bP < 0.01, cP < 0.001 vs group C. dP < 0.05, eP < 0.01, fP < 0.001 vs myocardial ischemia/reperfusion injury in diabetes group (n = 3 rats per group). C: Normal control group; DS: Diabetic rats with sham operation group; MI/RI: Myocardial ischemia/reperfusion injury; DMR: MI/RI in diabetes group; SXTL: MI/RI in diabetic rats receiving SXT 0.7 g/kg/d group; SXTM: MI/RI in diabetic rats receiving SXT 1.4 g/kg/d group; SXTH: MI/RI in diabetic rats receiving SXT 2.8 g/kg/d group.
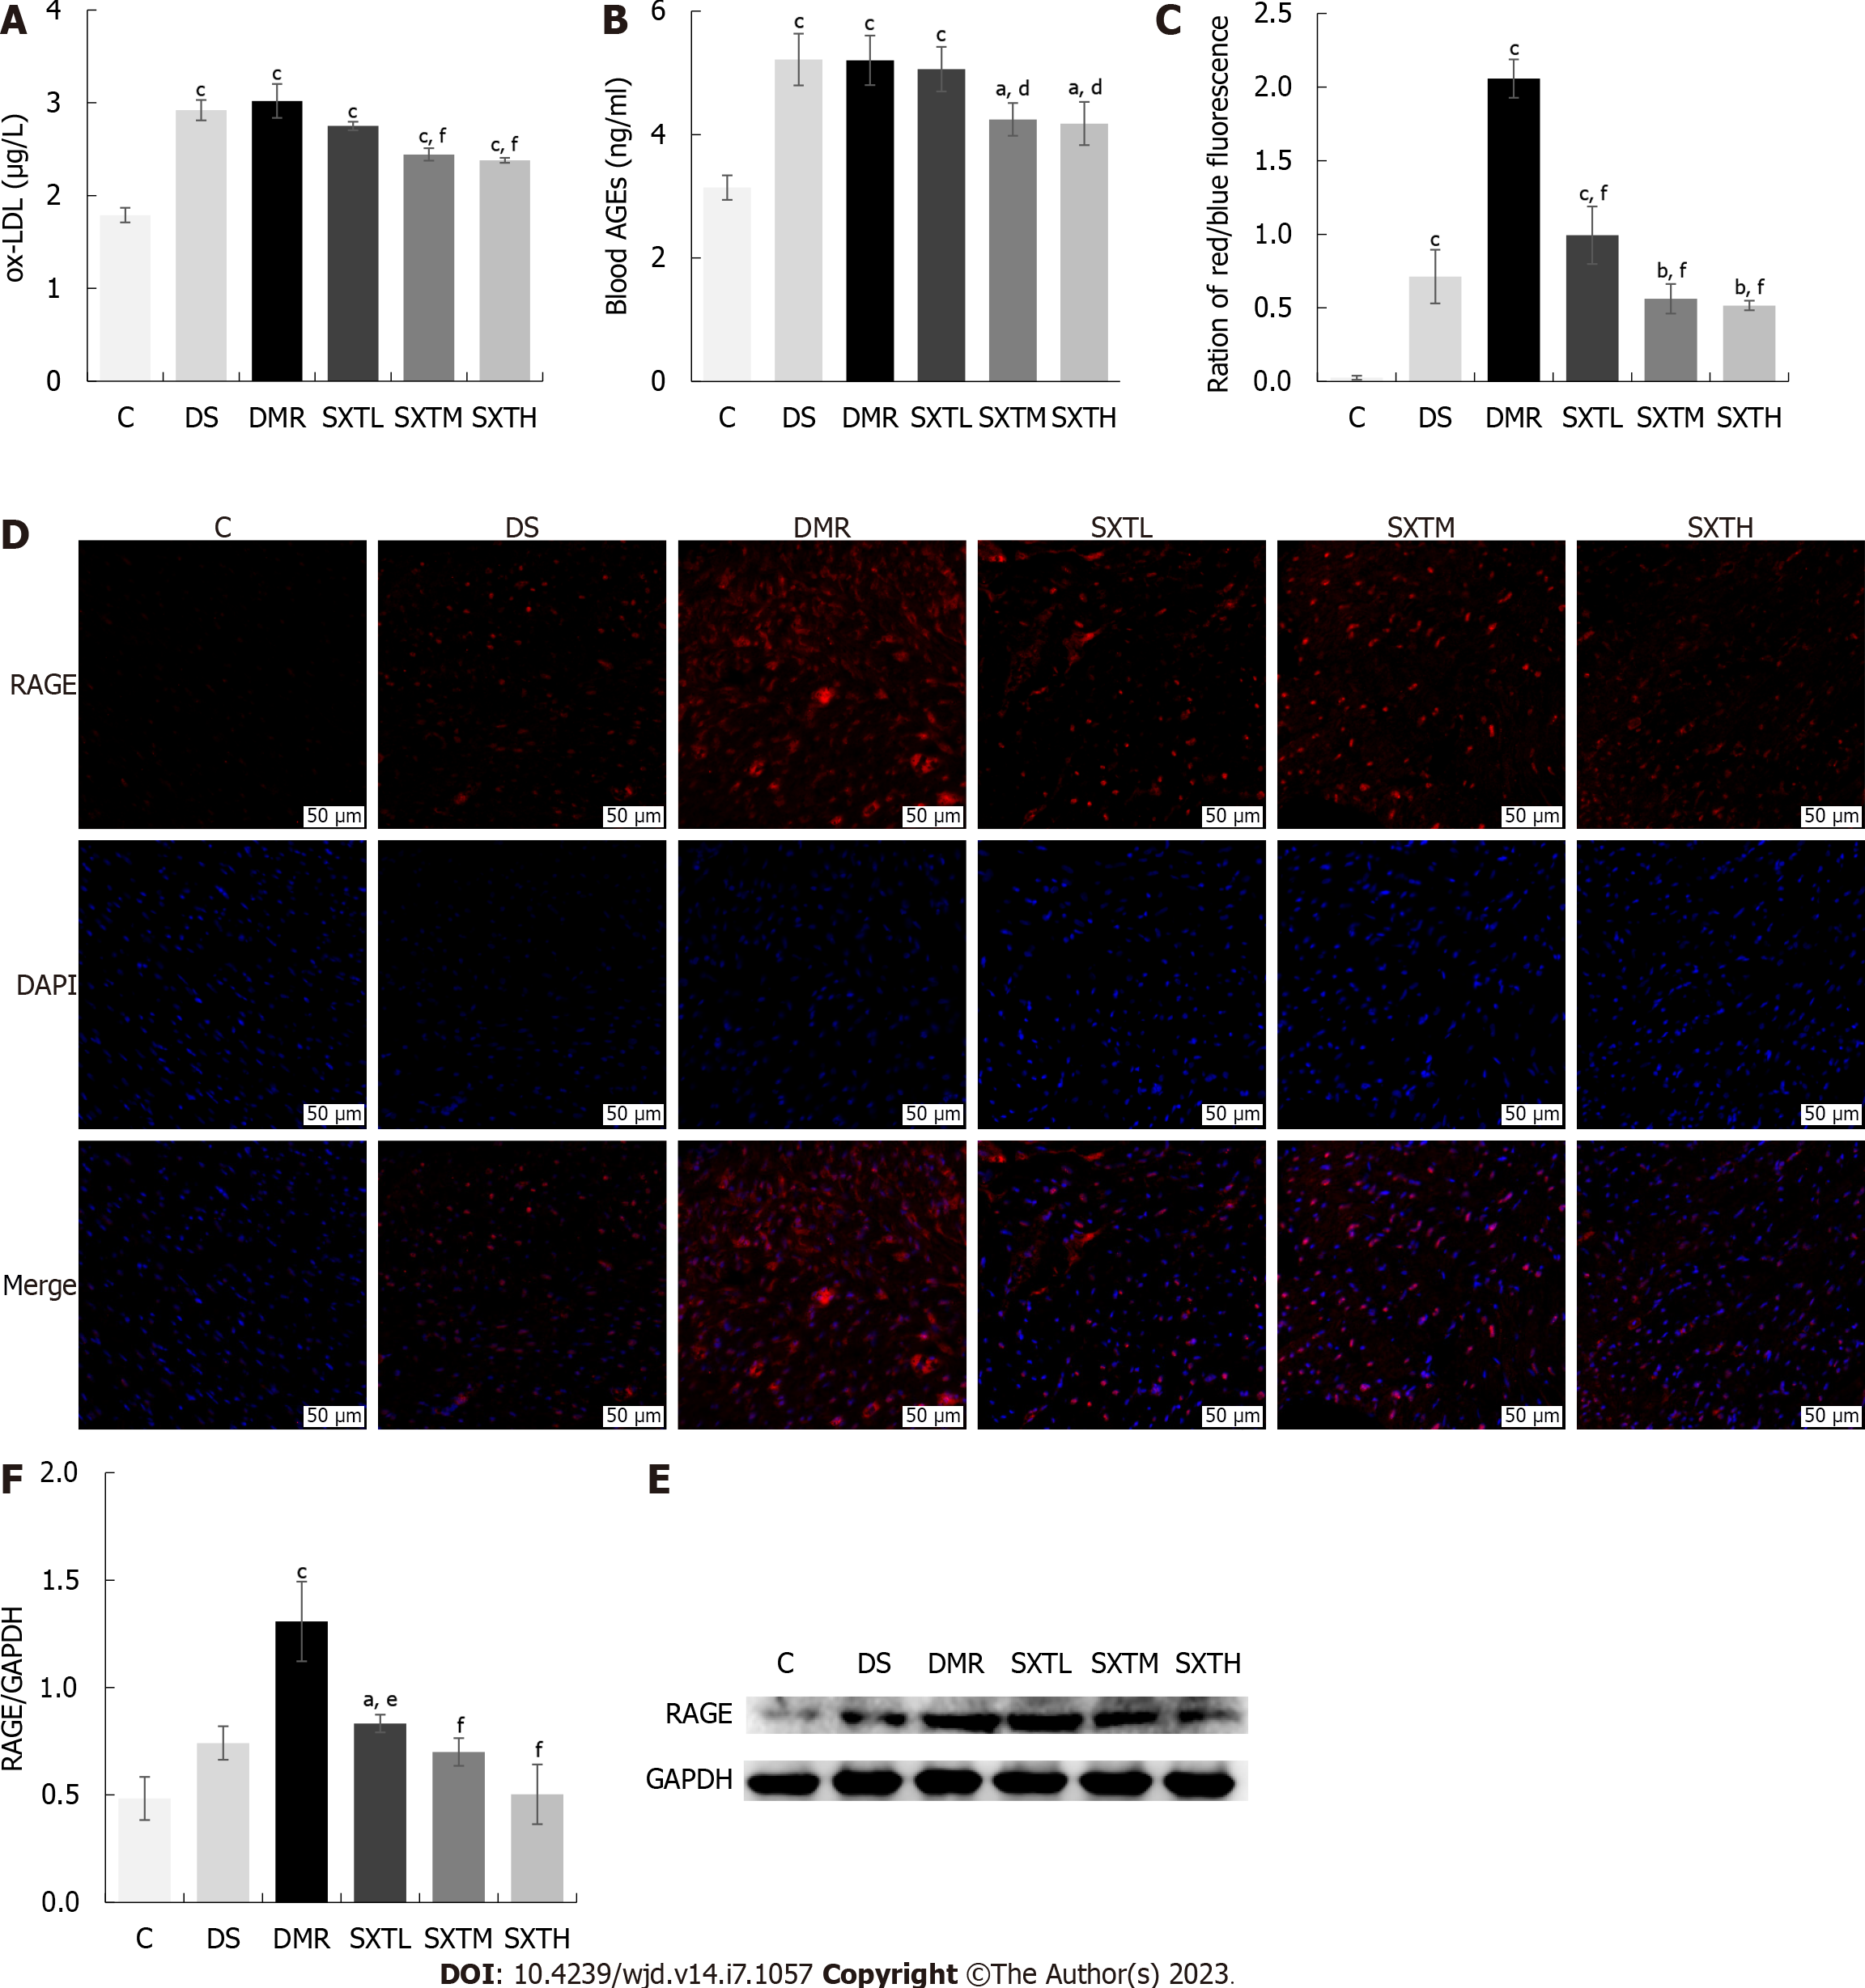
Figure 12 Shuxin decoction reduces oxidized low density lipoprotein and activates advanced glycation end products-receptor for advanced glycation end products signaling pathway.
A: Oxidized low density lipoprotein levels at the end of the experiment; B: Blood advanced glycation end products (AGEs) at the end of the experiment; C: Percentage of positive receptor for AGE (RAGE) (red/blue fluorescence, magnification × 20, scale bars, 50 μM); D: Immunofluorescence of RAGE. The RAGE-positive cells are stained red, while nuclei of cardiomyocytes are blue; E: RAGE protein levels detected by Western blot; F: Statistics of gray value of RAGE/GAPDH based on Western blot. aP < 0.05, bP < 0.01, cP < 0.001 vs group C. dP < 0.05, eP < 0.01, fP < 0.001 vs myocardial ischemia/reperfusion injury in diabetes group (n = 3 rats per group). C: Normal control group; DS: Diabetic rats with sham operation group; MI/RI: Myocardial ischemia/reperfusion injury; DMR: MI/RI in diabetes group; SXTL: MI/RI in diabetic rats receiving SXT 0.7 g/kg/d group; SXTM: MI/RI in diabetic rats receiving SXT 1.4 g/kg/d group; SXTH: MI/RI in diabetic rats receiving SXT 2.8 g/kg/d group; ox-LDL: Oxidized low density lipoprotein.
- Citation: Yang L, Jian Y, Zhang ZY, Qi BW, Li YB, Long P, Yang Y, Wang X, Huang S, Huang J, Zhou LF, Ma J, Jiang CQ, Hu YH, Xiao WJ. Network-pharmacology-based research on protective effects and underlying mechanism of Shuxin decoction against myocardial ischemia/reperfusion injury with diabetes. World J Diabetes 2023; 14(7): 1057-1076
- URL: https://www.wjgnet.com/1948-9358/full/v14/i7/1057.htm
- DOI: https://dx.doi.org/10.4239/wjd.v14.i7.1057


