Copyright
©The Author(s) 2023.
World J Diabetes. Mar 15, 2023; 14(3): 255-270
Published online Mar 15, 2023. doi: 10.4239/wjd.v14.i3.255
Published online Mar 15, 2023. doi: 10.4239/wjd.v14.i3.255
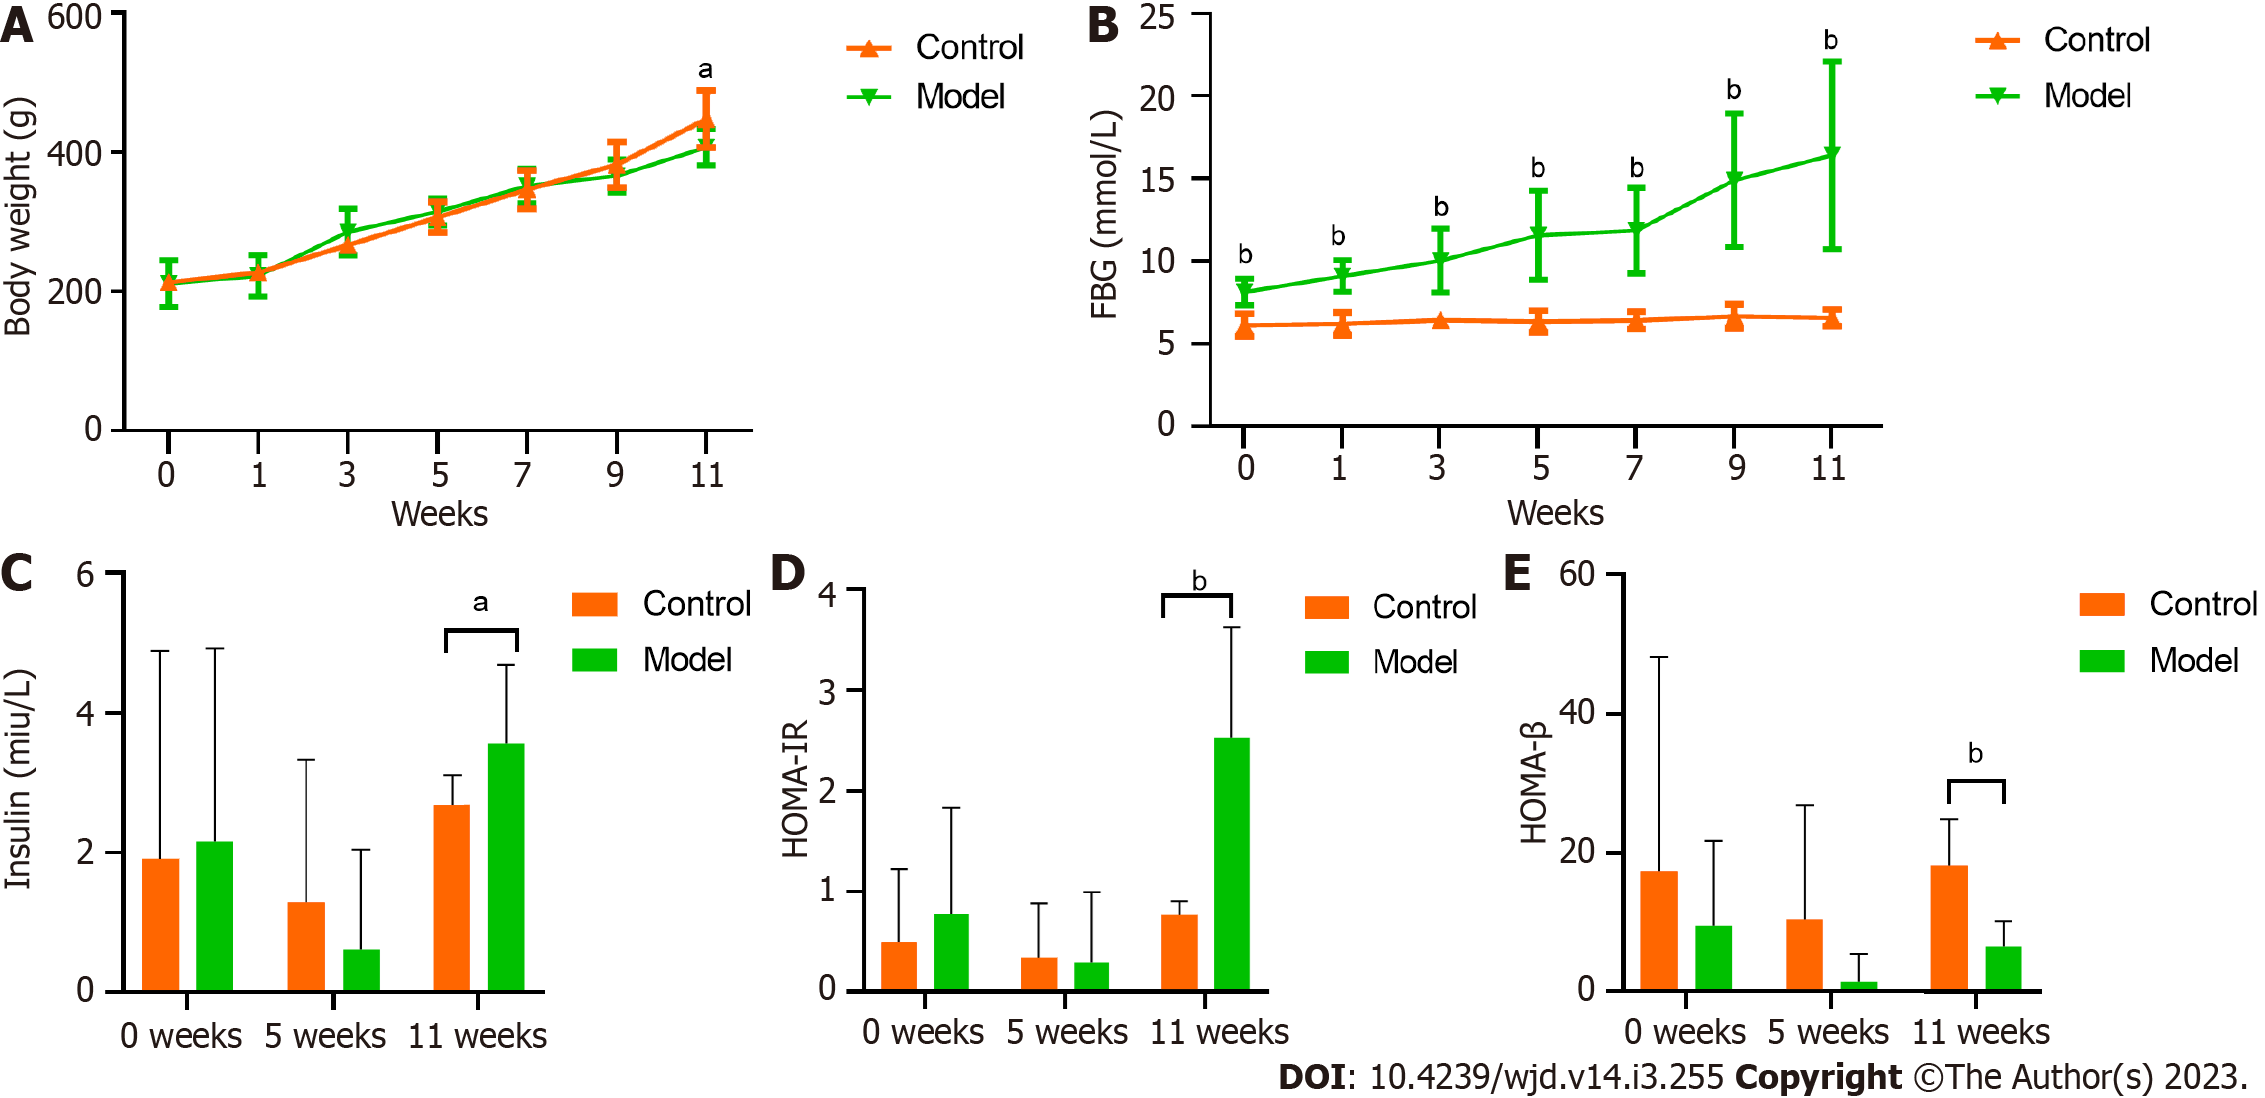
Figure 1 Comparison of body weight, fasting blood glucose and insulin resistance levels.
A: Comparison of body weight; B: Comparison of fasting blood glucose levels; C: Comparison of insulin levels; D: Comparison of homeostasis model assessment of insulin resistance index; E: Comparison of homeostasis model assessment of β cell index. aP < 0.05, bP < 0.01 vs the control group. FBG: Fasting blood glucose.
Figure 2 Comparison of the gut microbiota structure by principal coordinate analysis.
A: Comparison of the gut microbiota structure by principal coordinate analysis; B: Distribution of different groups on the first principal component axis.
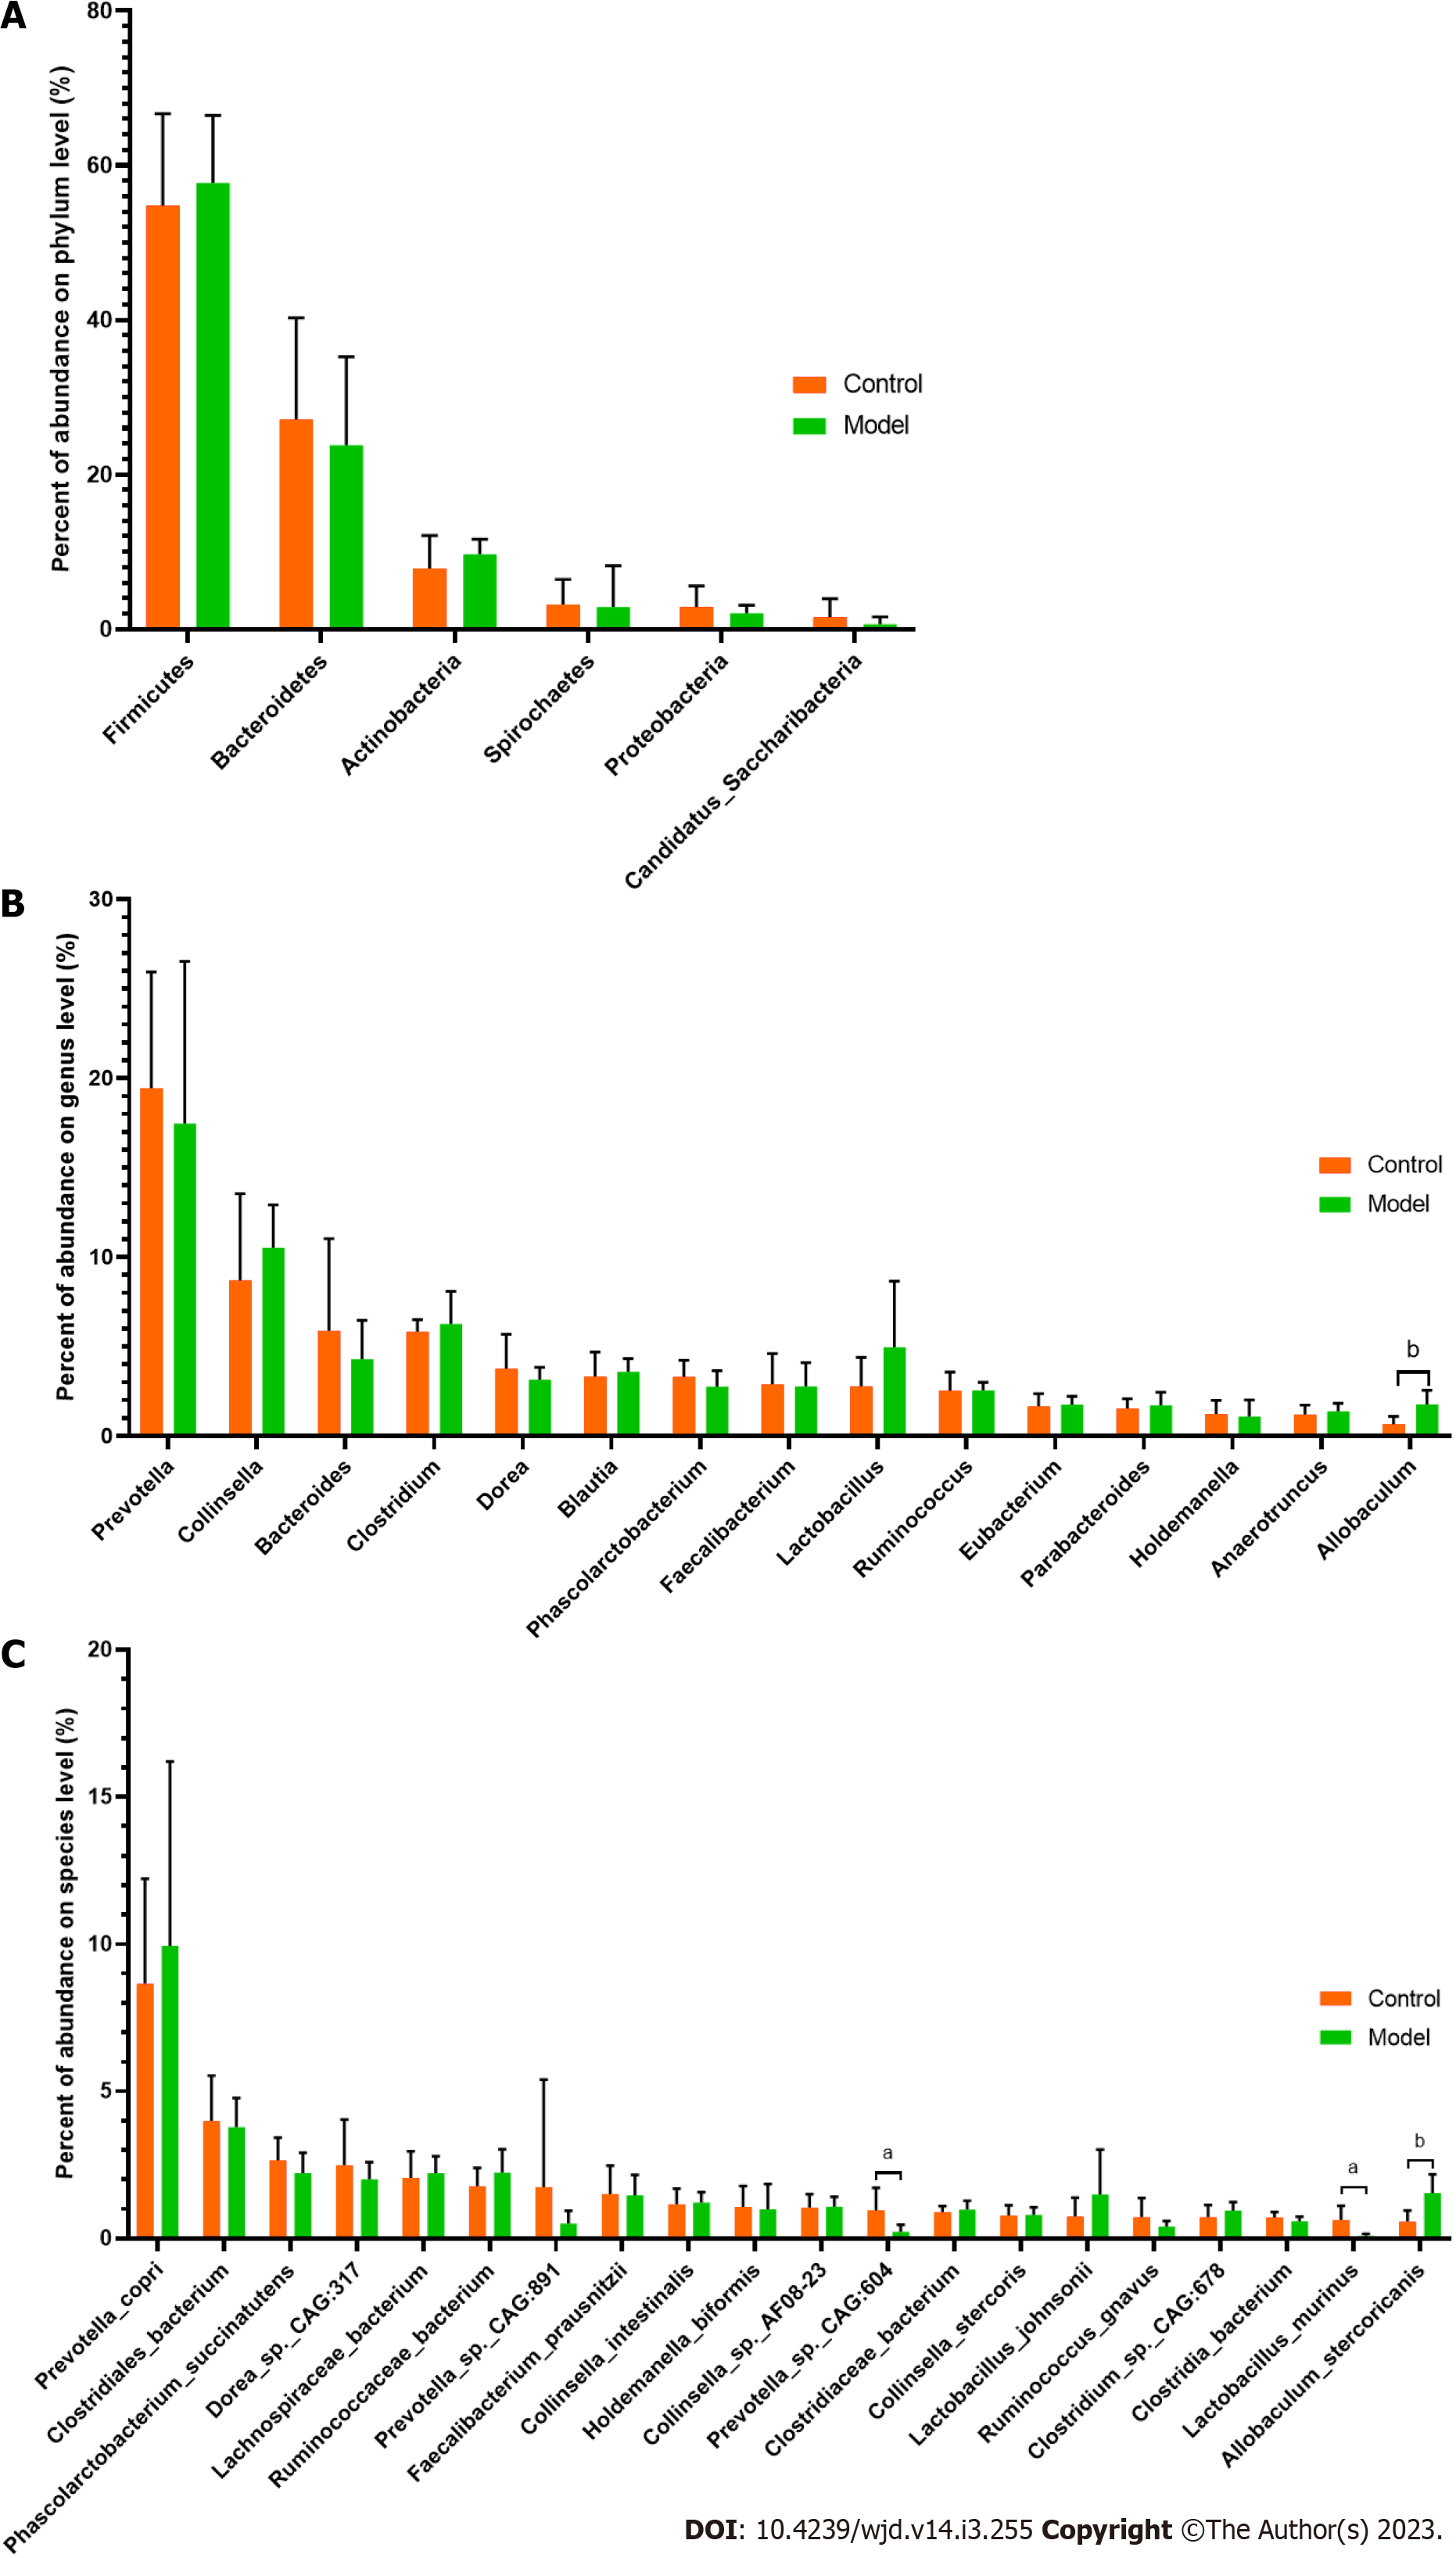
Figure 3 Comparison of the relative abundances of phylum, genus and species.
A: Comparison of the relative abundances of phylum; B: Comparison of the relative abundances of genus; C: Comparison of the relative abundances of species. aP < 0.05, bP < 0.01 vs the control group.
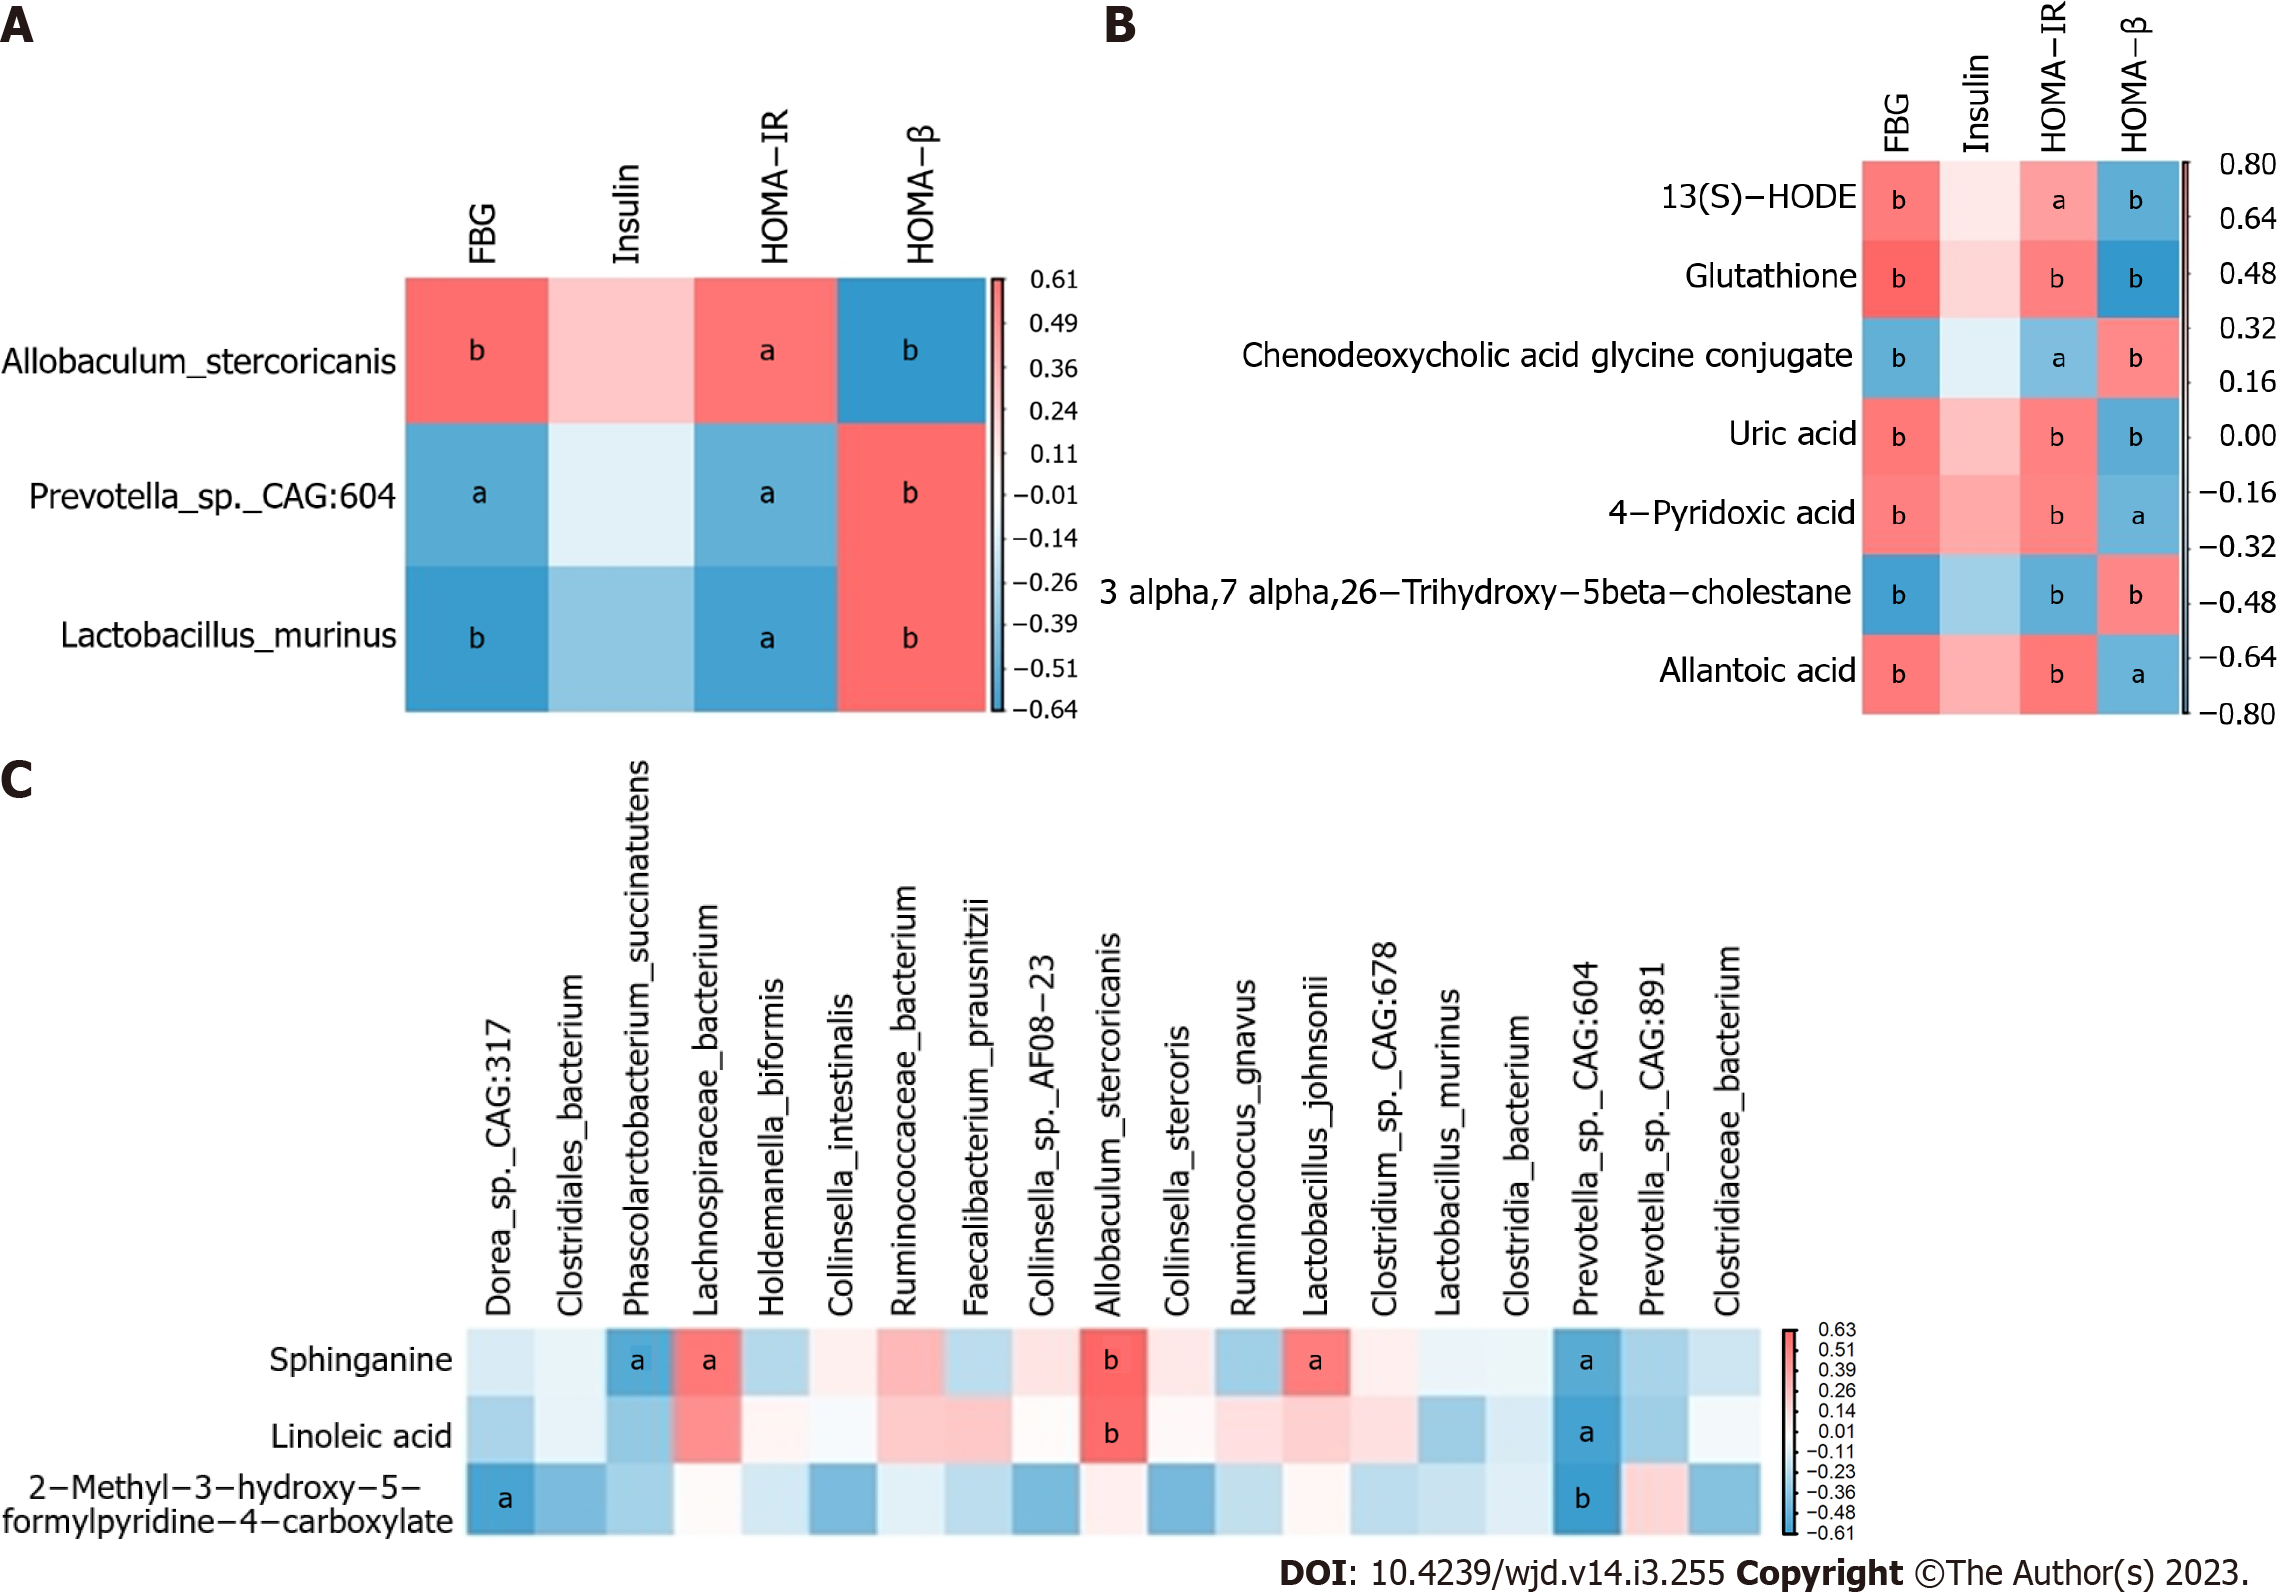
Figure 4 Correlation the relationship between glucose factors, gut microbiota at the species level and metabolites.
A: Correlation between glucose factors and the gut microbiota at the species level; B: Correlation between glucose factors and metabolites; C: Correlation between metabolites and the gut microbiota at the species level. aP < 0.05, bP < 0.01 vs the control group. The range of r values is noted. FBG: Fasting blood glucose.
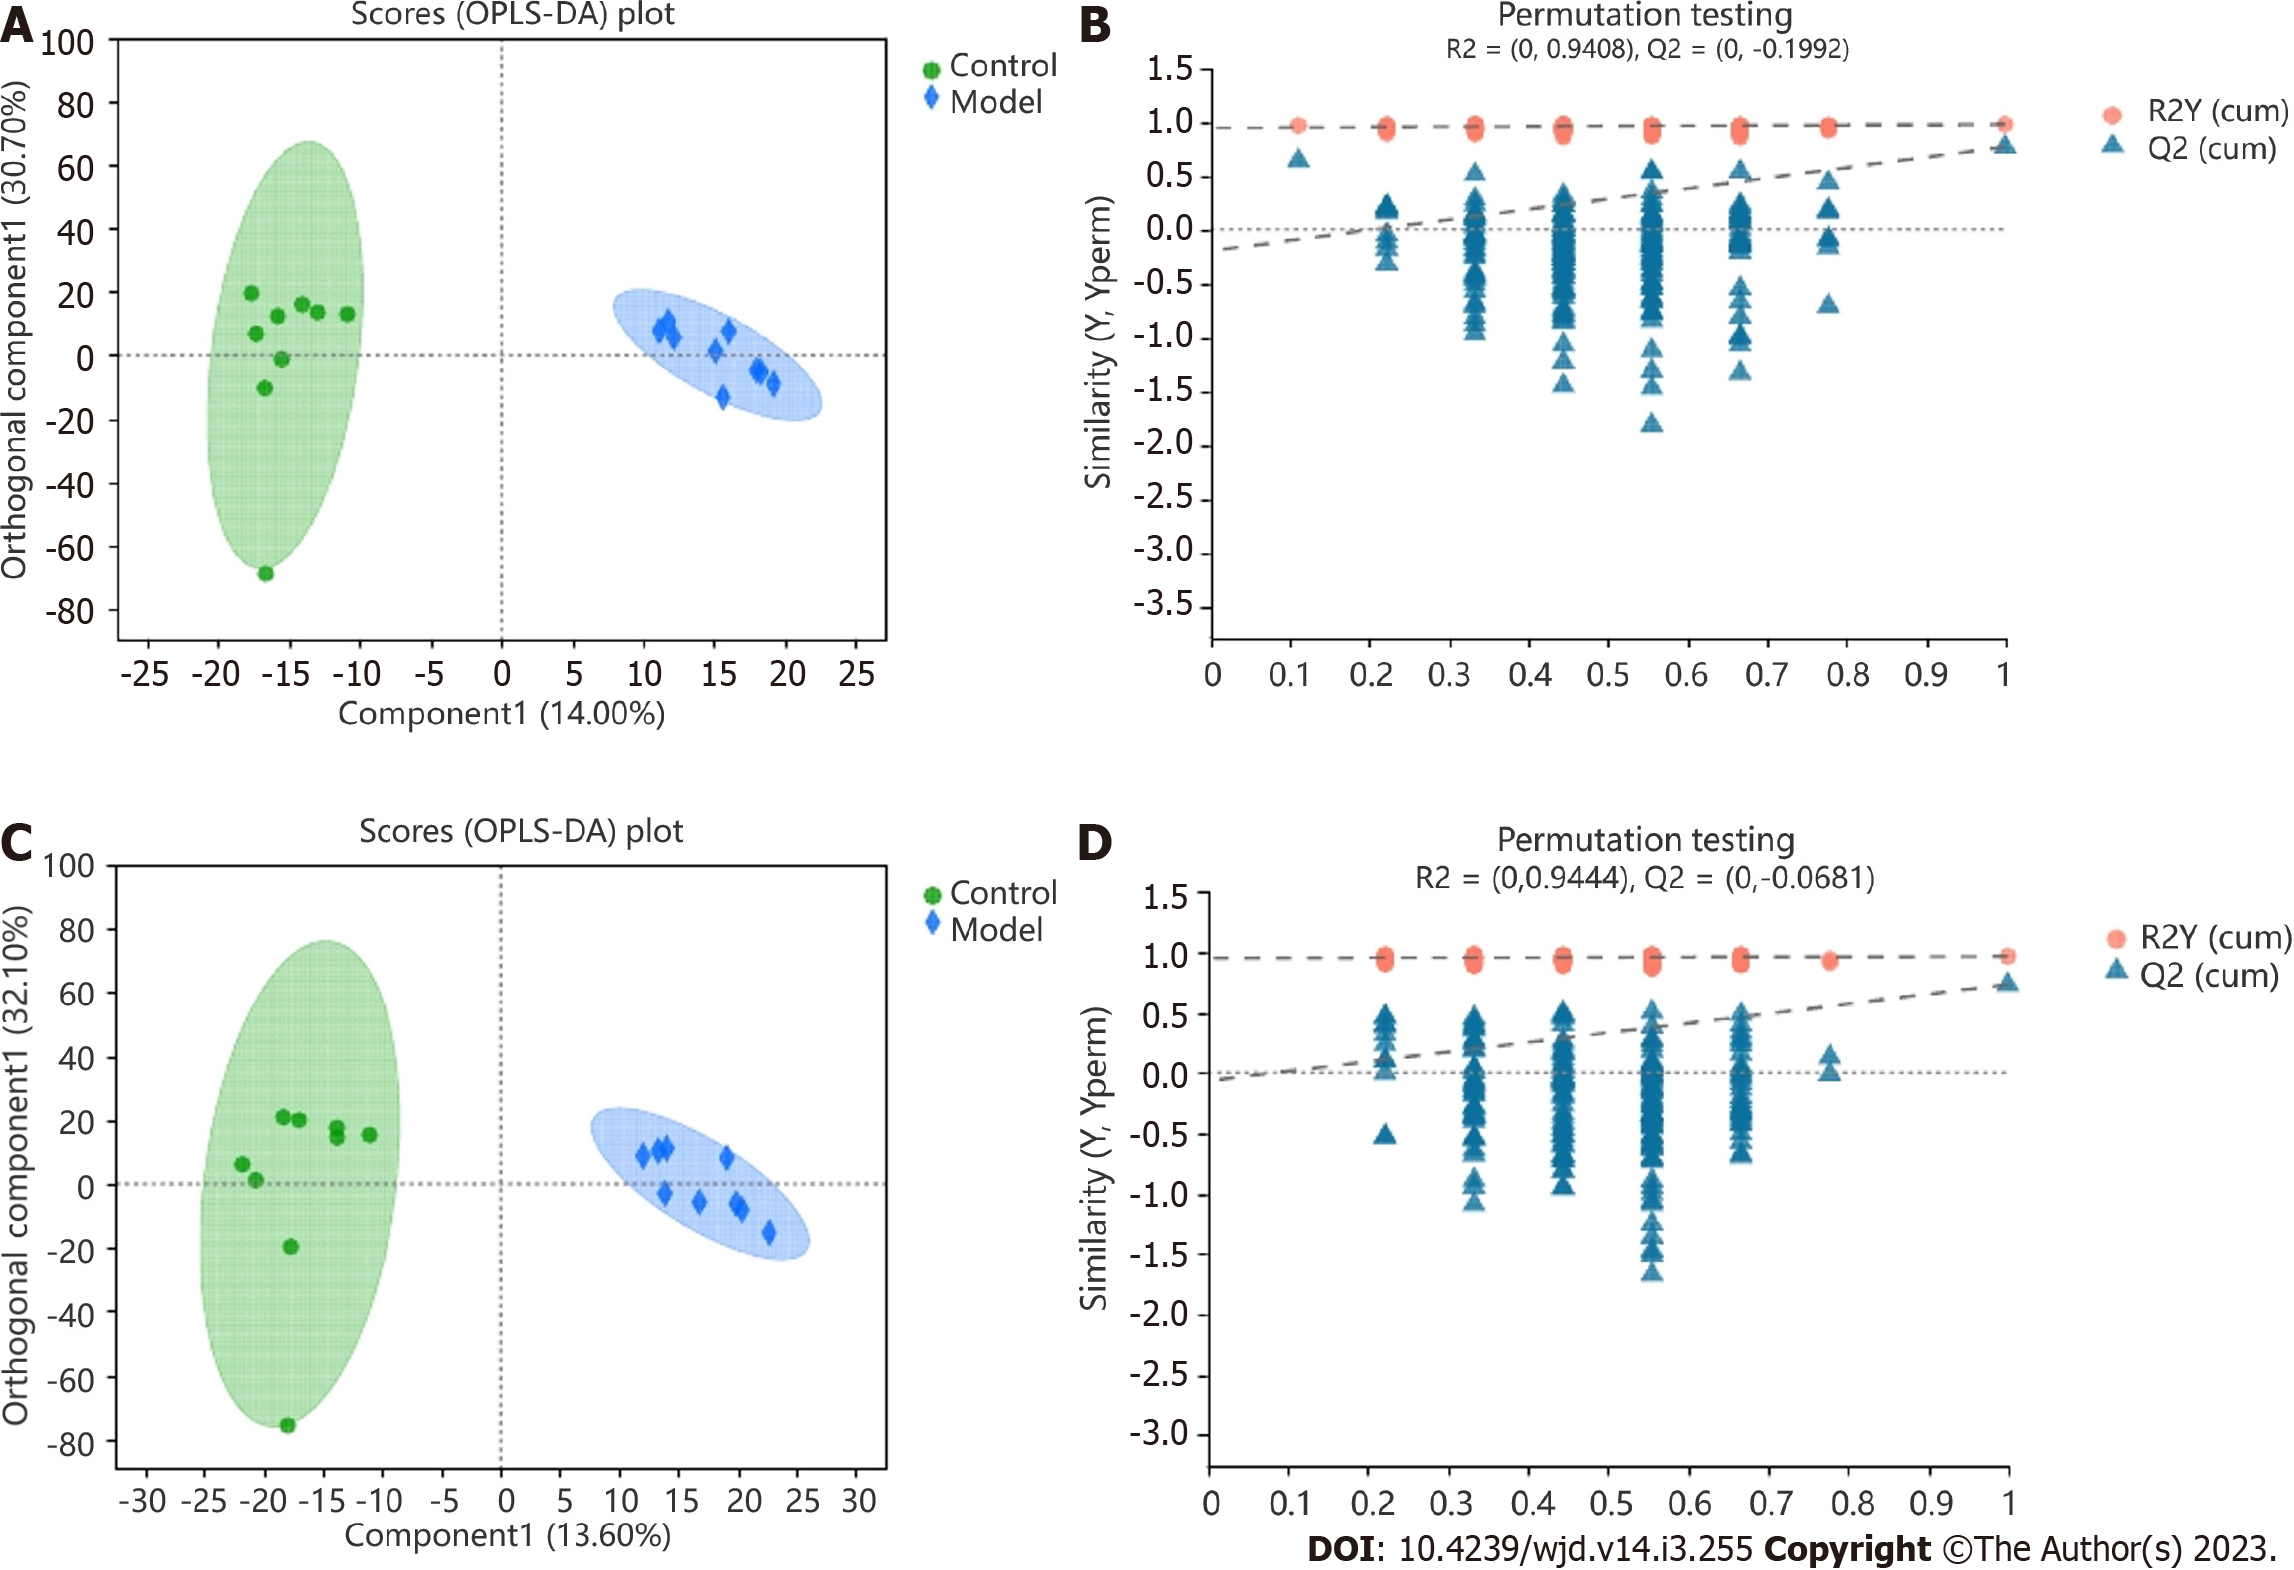
Figure 5 Comparison of the metabolite profiles by orthogonal partial least squares discriminant analysis and model validation.
A: Comparison of the positive-ion metabolite profiles by orthogonal partial least squares discriminant analysis (OPLS-DA); B: Positive-ion metabolite profiles with OPLS-DA model validation; C: Comparison of the negative-ion metabolite profiles by OPLS-DA; D: Negative-ion metabolite profiles with OPLS-DA model validation.
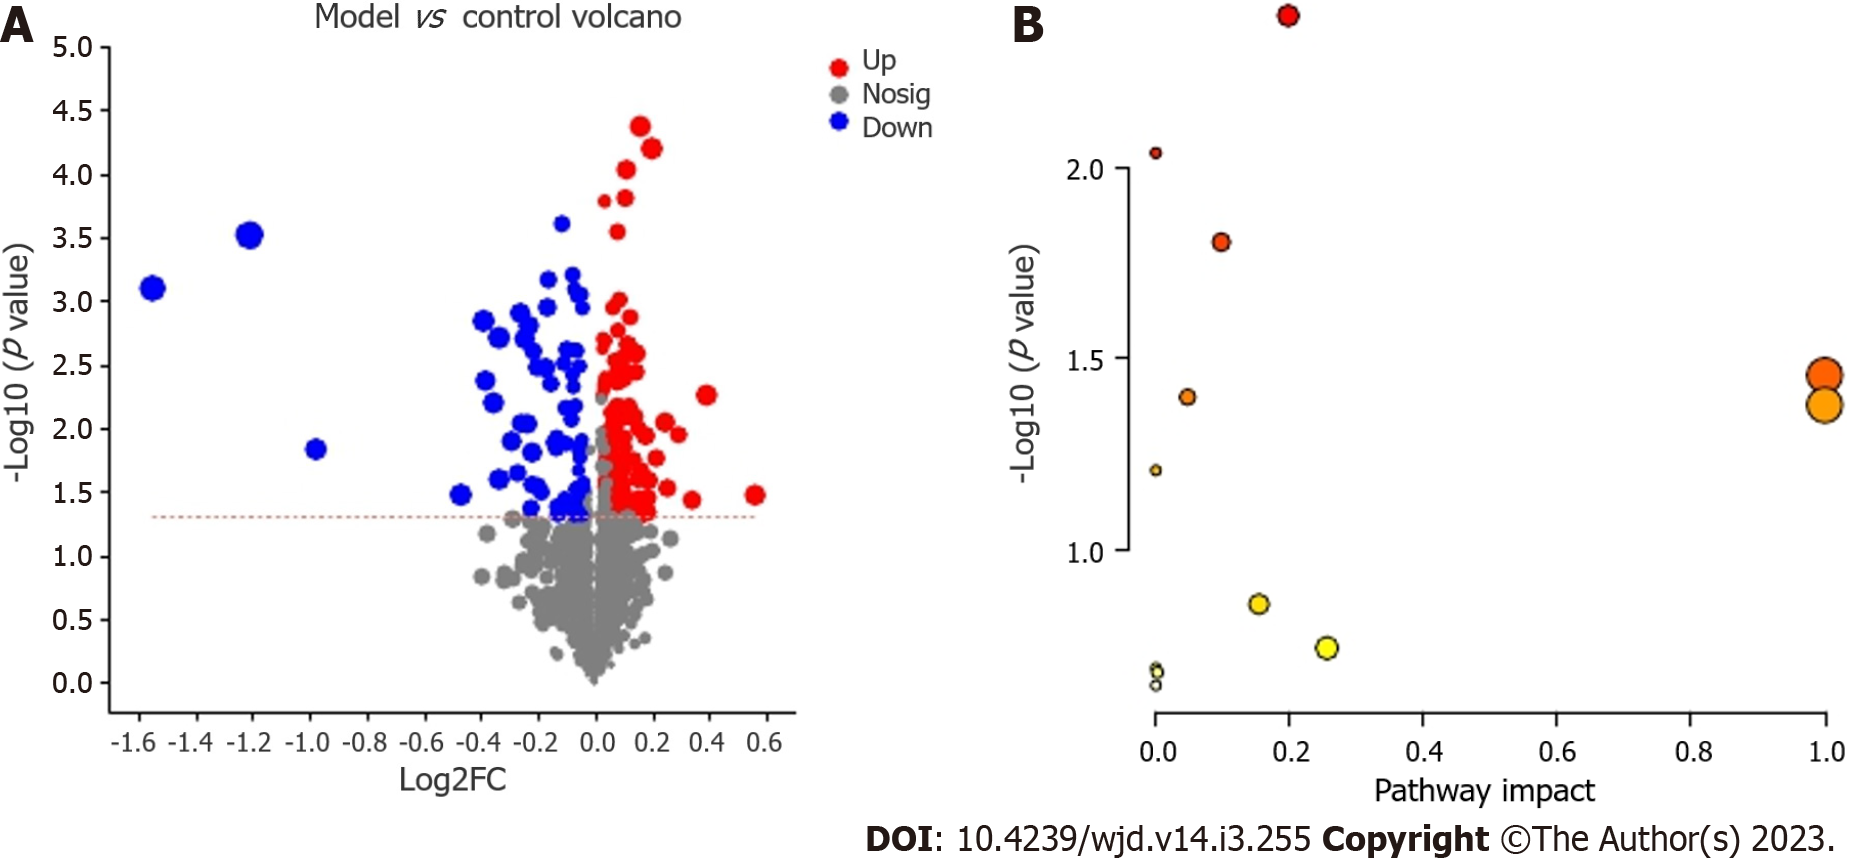
Figure 6 Differential metabolites and metabolic pathways.
A: Volcano plot of the differential positive- and negative-ion metabolites; B: Metabolic pathways showing differential regulation in Goto Kakizaki rats.
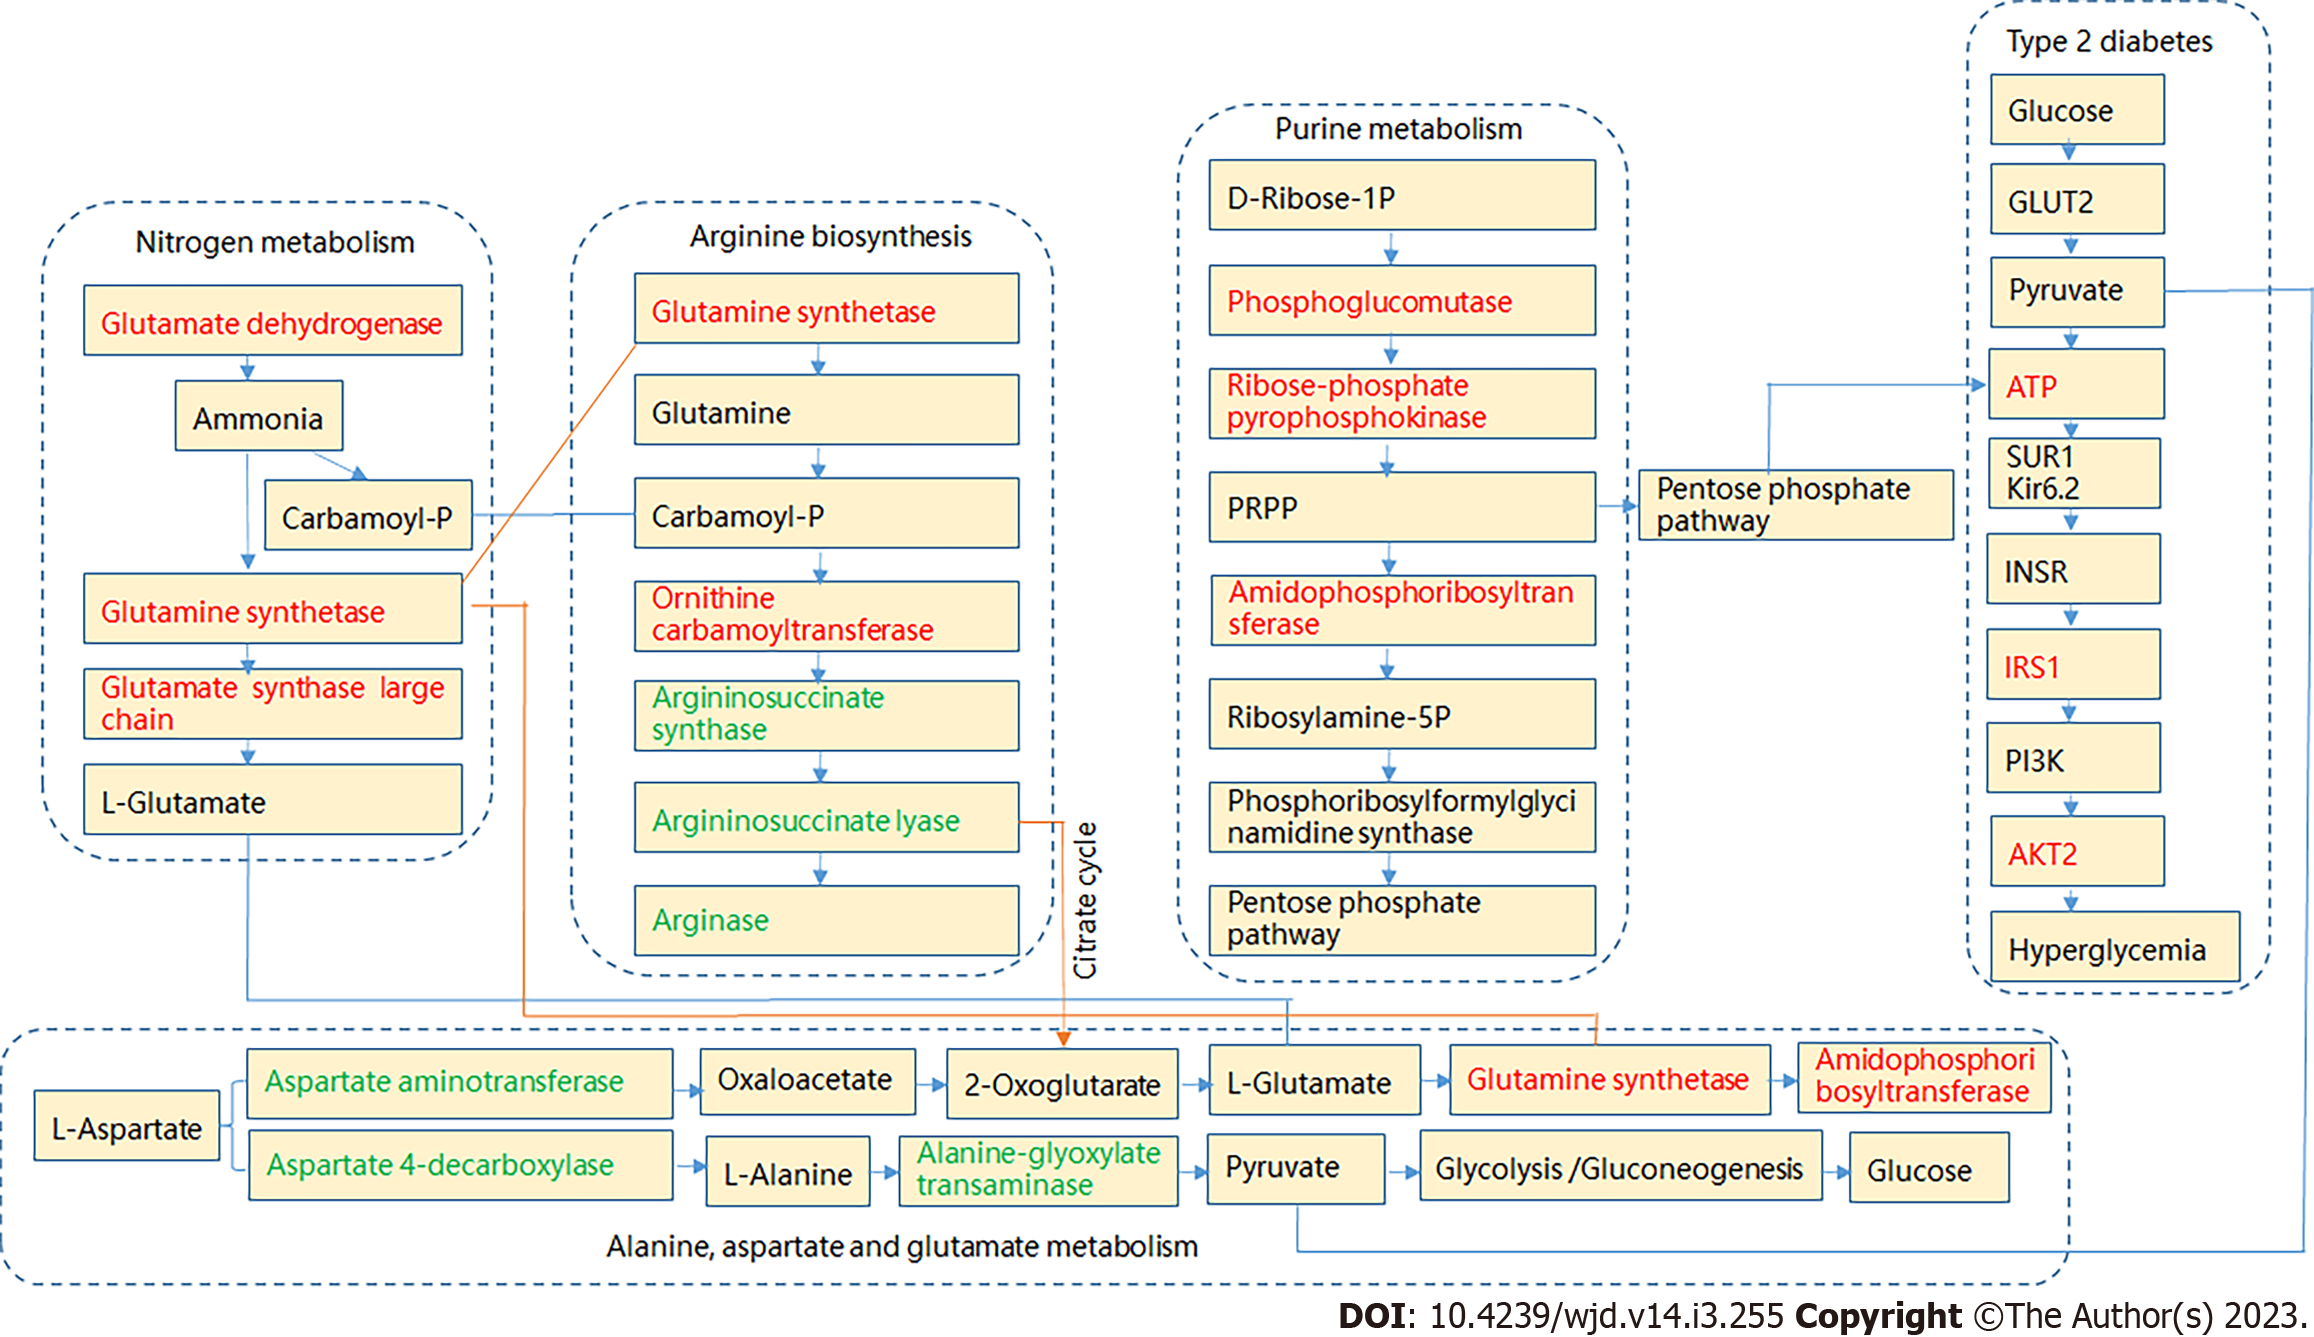
Figure 7 Potential targets of the metabolic pathways showing differential regulation in Goto Kakizaki rats.
Compared with the control group, green and orange represent decreased and increased levels, respectively.
- Citation: Zhao JD, Sun M, Li Y, Yu CJ, Cheng RD, Wang SH, Du X, Fang ZH. Characterization of gut microbial and metabolite alterations in faeces of Goto Kakizaki rats using metagenomic and untargeted metabolomic approach. World J Diabetes 2023; 14(3): 255-270
- URL: https://www.wjgnet.com/1948-9358/full/v14/i3/255.htm
- DOI: https://dx.doi.org/10.4239/wjd.v14.i3.255


