Copyright
©The Author(s) 2023.
World J Diabetes. Mar 15, 2023; 14(3): 209-221
Published online Mar 15, 2023. doi: 10.4239/wjd.v14.i3.209
Published online Mar 15, 2023. doi: 10.4239/wjd.v14.i3.209
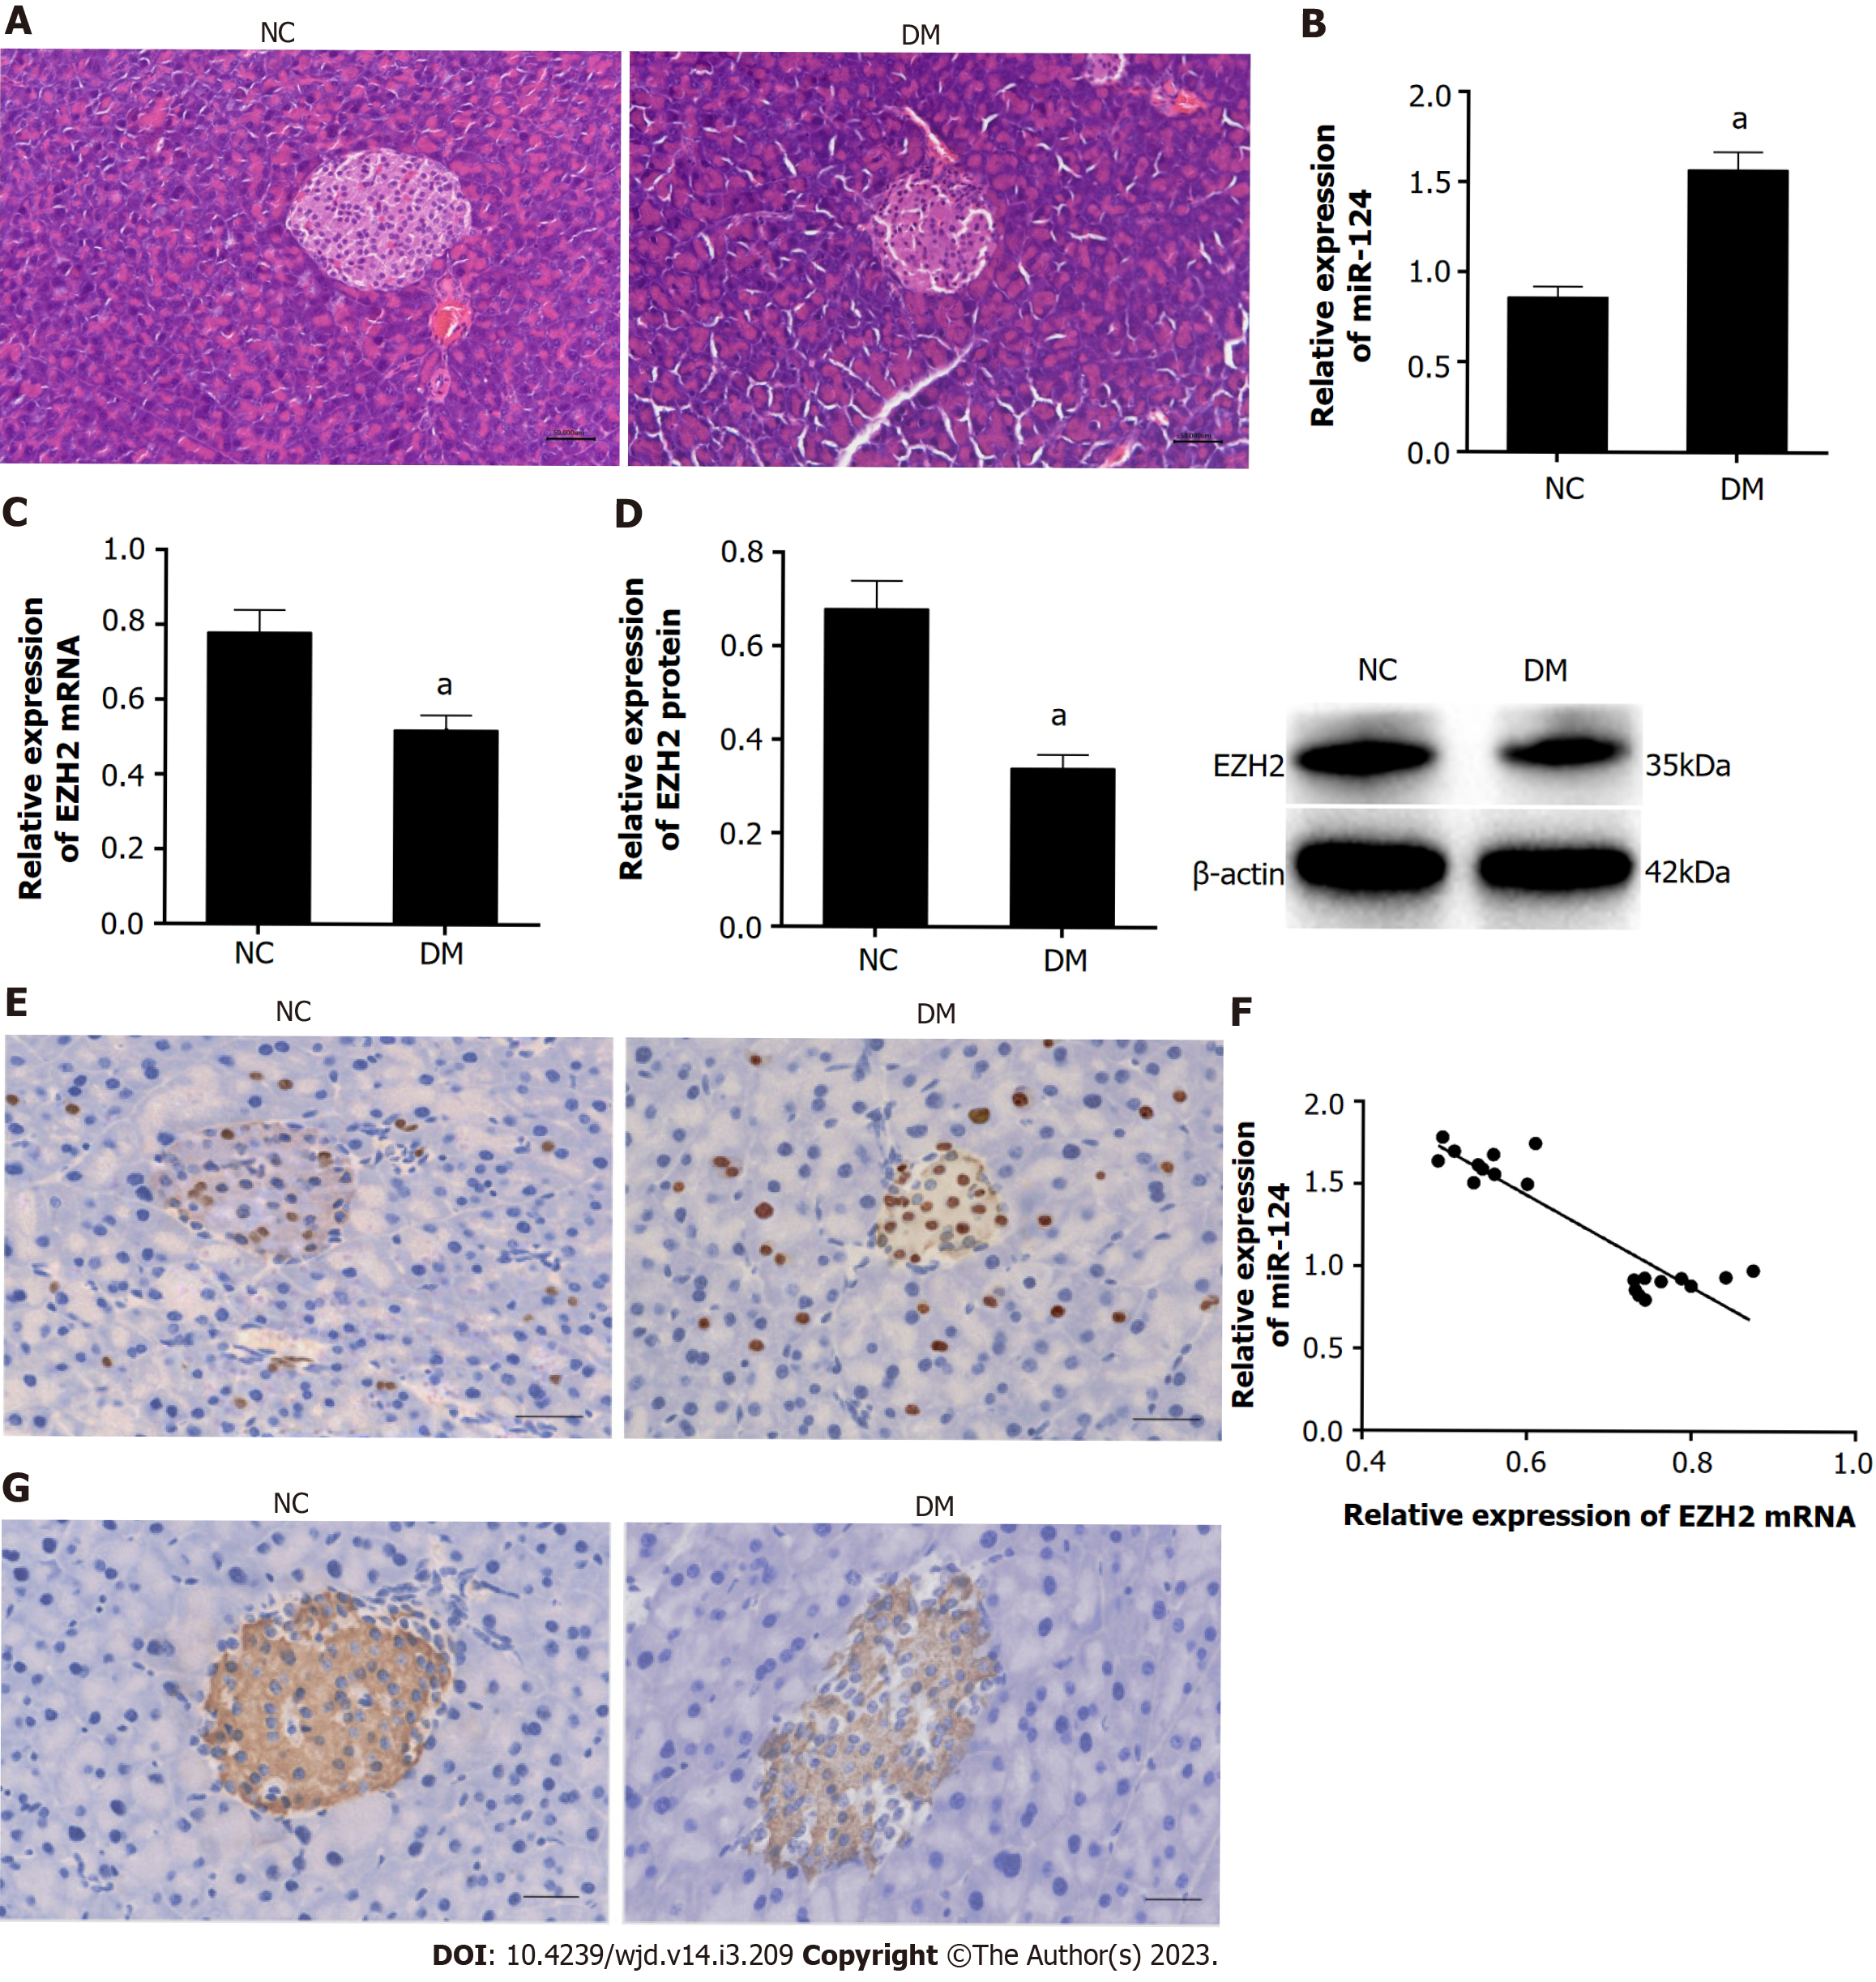
Figure 1 miR-124 was upregulated and EZH2 was downregulated in pancreatic tissue in diabetic mice.
A: The pathological changes of pancreas in diabetic mice detected by hematoxylin-eosin staining (scale bar = 50 μm); B: The relative expression levels of miR-124 in pancreatic tissue of diabetic mice were higher than that of the normal control (NC) mice detected by real-time quantitative polymerase chain reaction (RT-qPCR); C and D: The relative expression levels of EZH2 in pancreatic tissues of diabetic mice were lower than that of NC mice detected by RT-qPCR and western blot; E: Expression of EZH2 in pancreatic tissue was detected by immunohistochemistry (scale bar = 100 μm); F: miR-124 was negatively correlated with EZH2 analyzed by Pearson correlation analysis; G: Expression of insulin in pancreatic tissue was detected by immunohistochemistry (scale bar = 100 μm). aP < 0.05, vs the NC group. NC: Normal control; DM: Diabetes group.
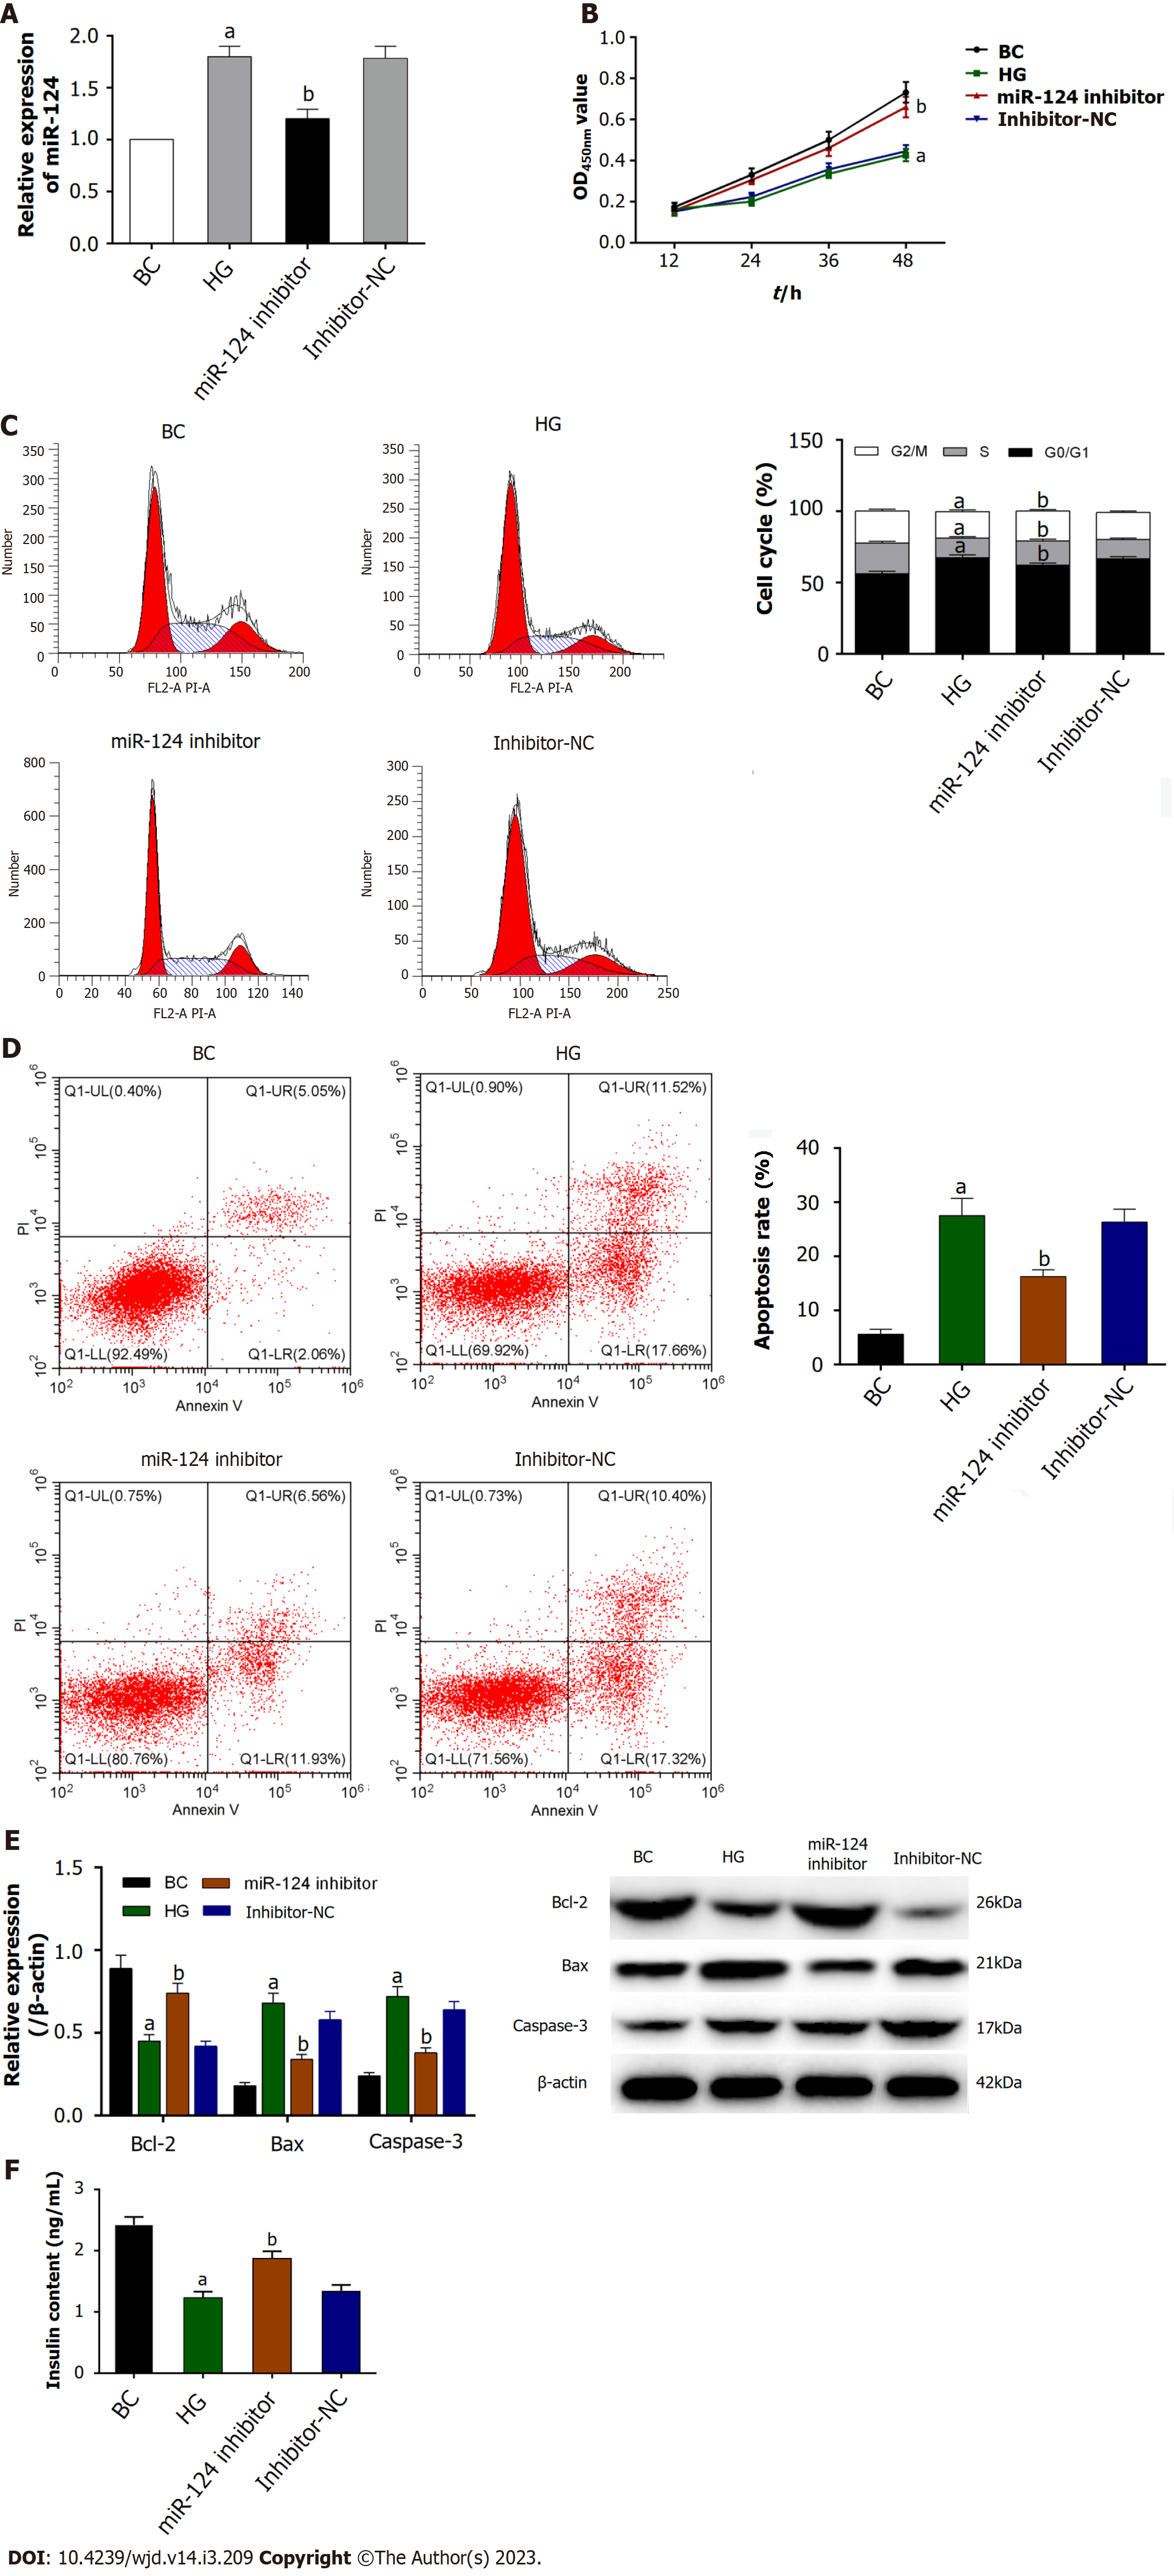
Figure 2 miR-124 inhibitor promoted proliferation and the transition from the G0/G1 phase to the S phase of the cell cycle, suppressed the apoptosis and promoted insulin secretion in high glucose-induced Min6 cells.
A: The relative expression of miR-124 was upregulated in high glucose (HG)-induced Min6 cells, and was down-regulated by miR-124 inhibitor detected by real-time quantitative polymerase chain reaction; B: miR-124 inhibitor promoted the proliferation ability of HG-induced Min6 cells; C: miR-124 inhibitor promoted the HG-induced Min6 cells at the transition from the G0/G1 phase to the S phase of the cell cycle; D: miR-124 inhibitor suppressed the apoptosis of HG-induced Min6 cells detected by flow cytometry; E: Relative expression of apoptotic related proteins Bcl-2, Bax and caspase-3 were detected by western blot; F: miR-124 inhibitor increased the secretion of insulin in HG-induced Min6 cells. aP < 0.05, vs BC group; bP < 0.05, vs the HG group. BC: Blank control; HG: High glucose.
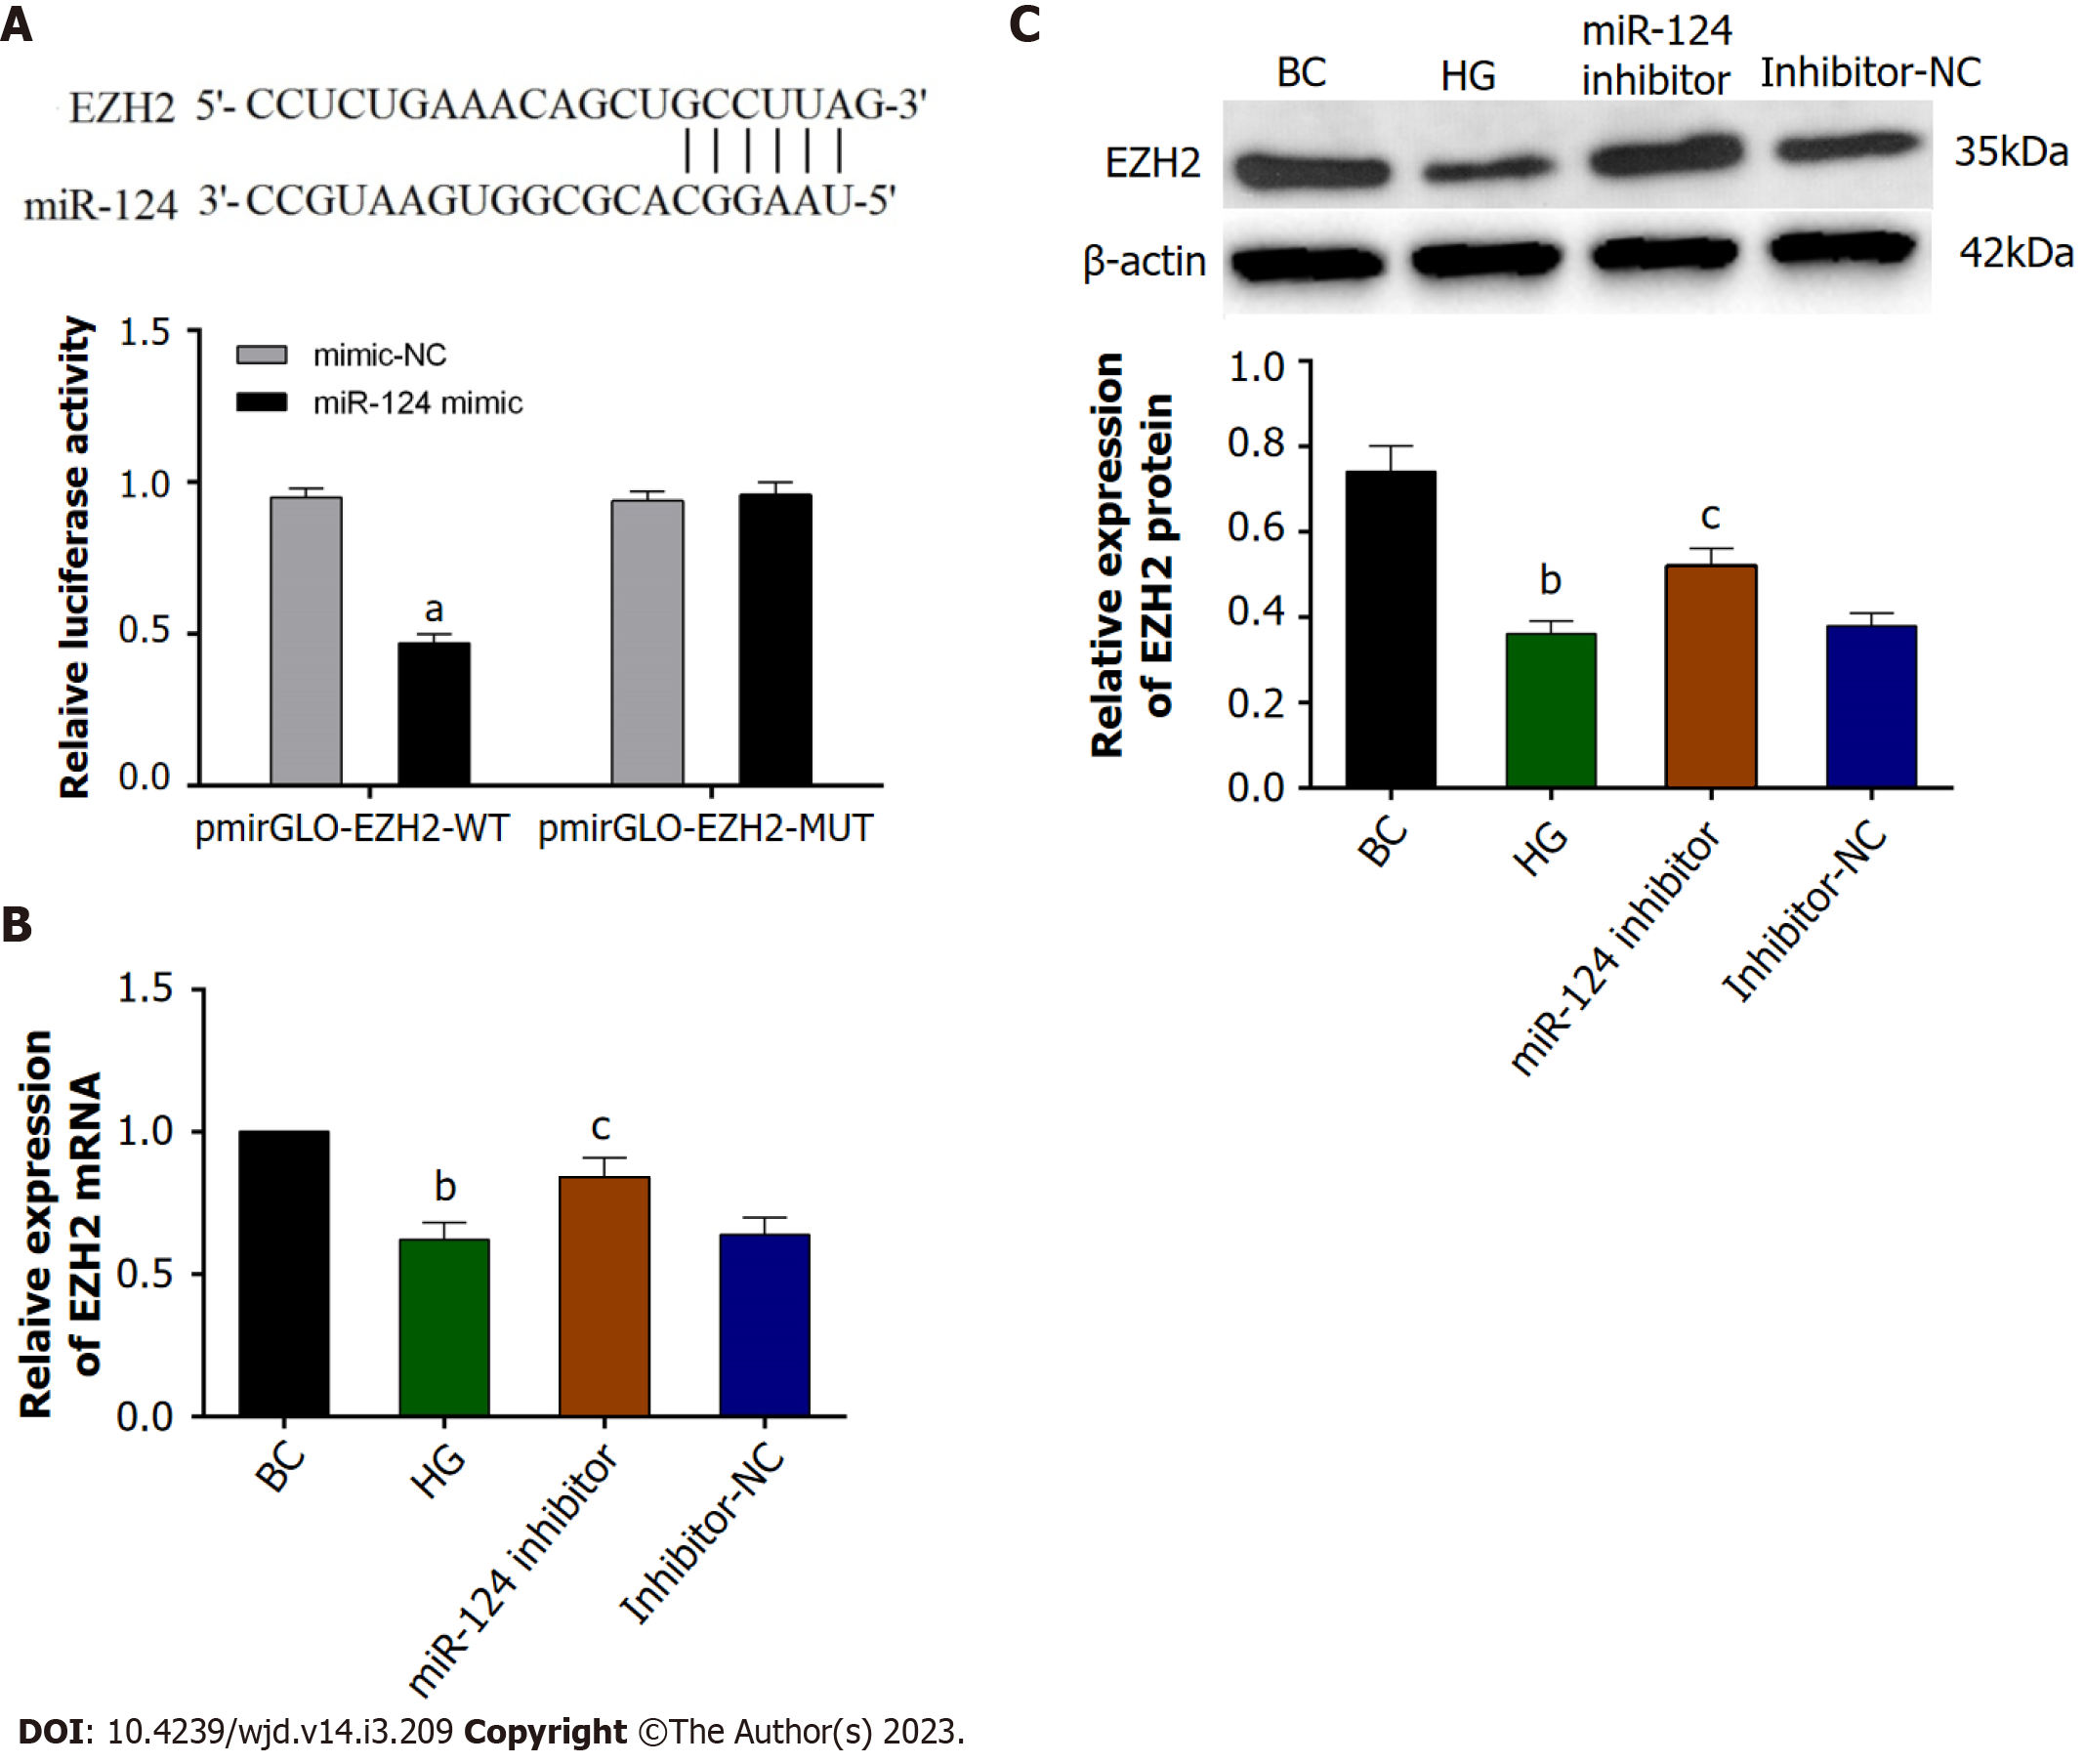
Figure 3 miR-124 targeted EZH2 and downregulated the expression of EZH2.
A: miR-124 targeted EZH2 verified by a double luciferase reporter gene assay. B: The relative expression levels of EZH2 mRNA were upregulated by miR-124 inhibitor in high glucose-induced Min6 cells detected by real-time quantitative polymerase chain reaction; C: The relative expression of EZH2 protein was upregulated by miR-124 inhibitor in HG-induced Min6 cells detected by western blot. aP < 0.05, vs the mimic-NC group; bP < 0.05, vs BC group; cP < 0.05, vs the HG group. NC: Normal control; BC: Blank control; HG: High glucose.
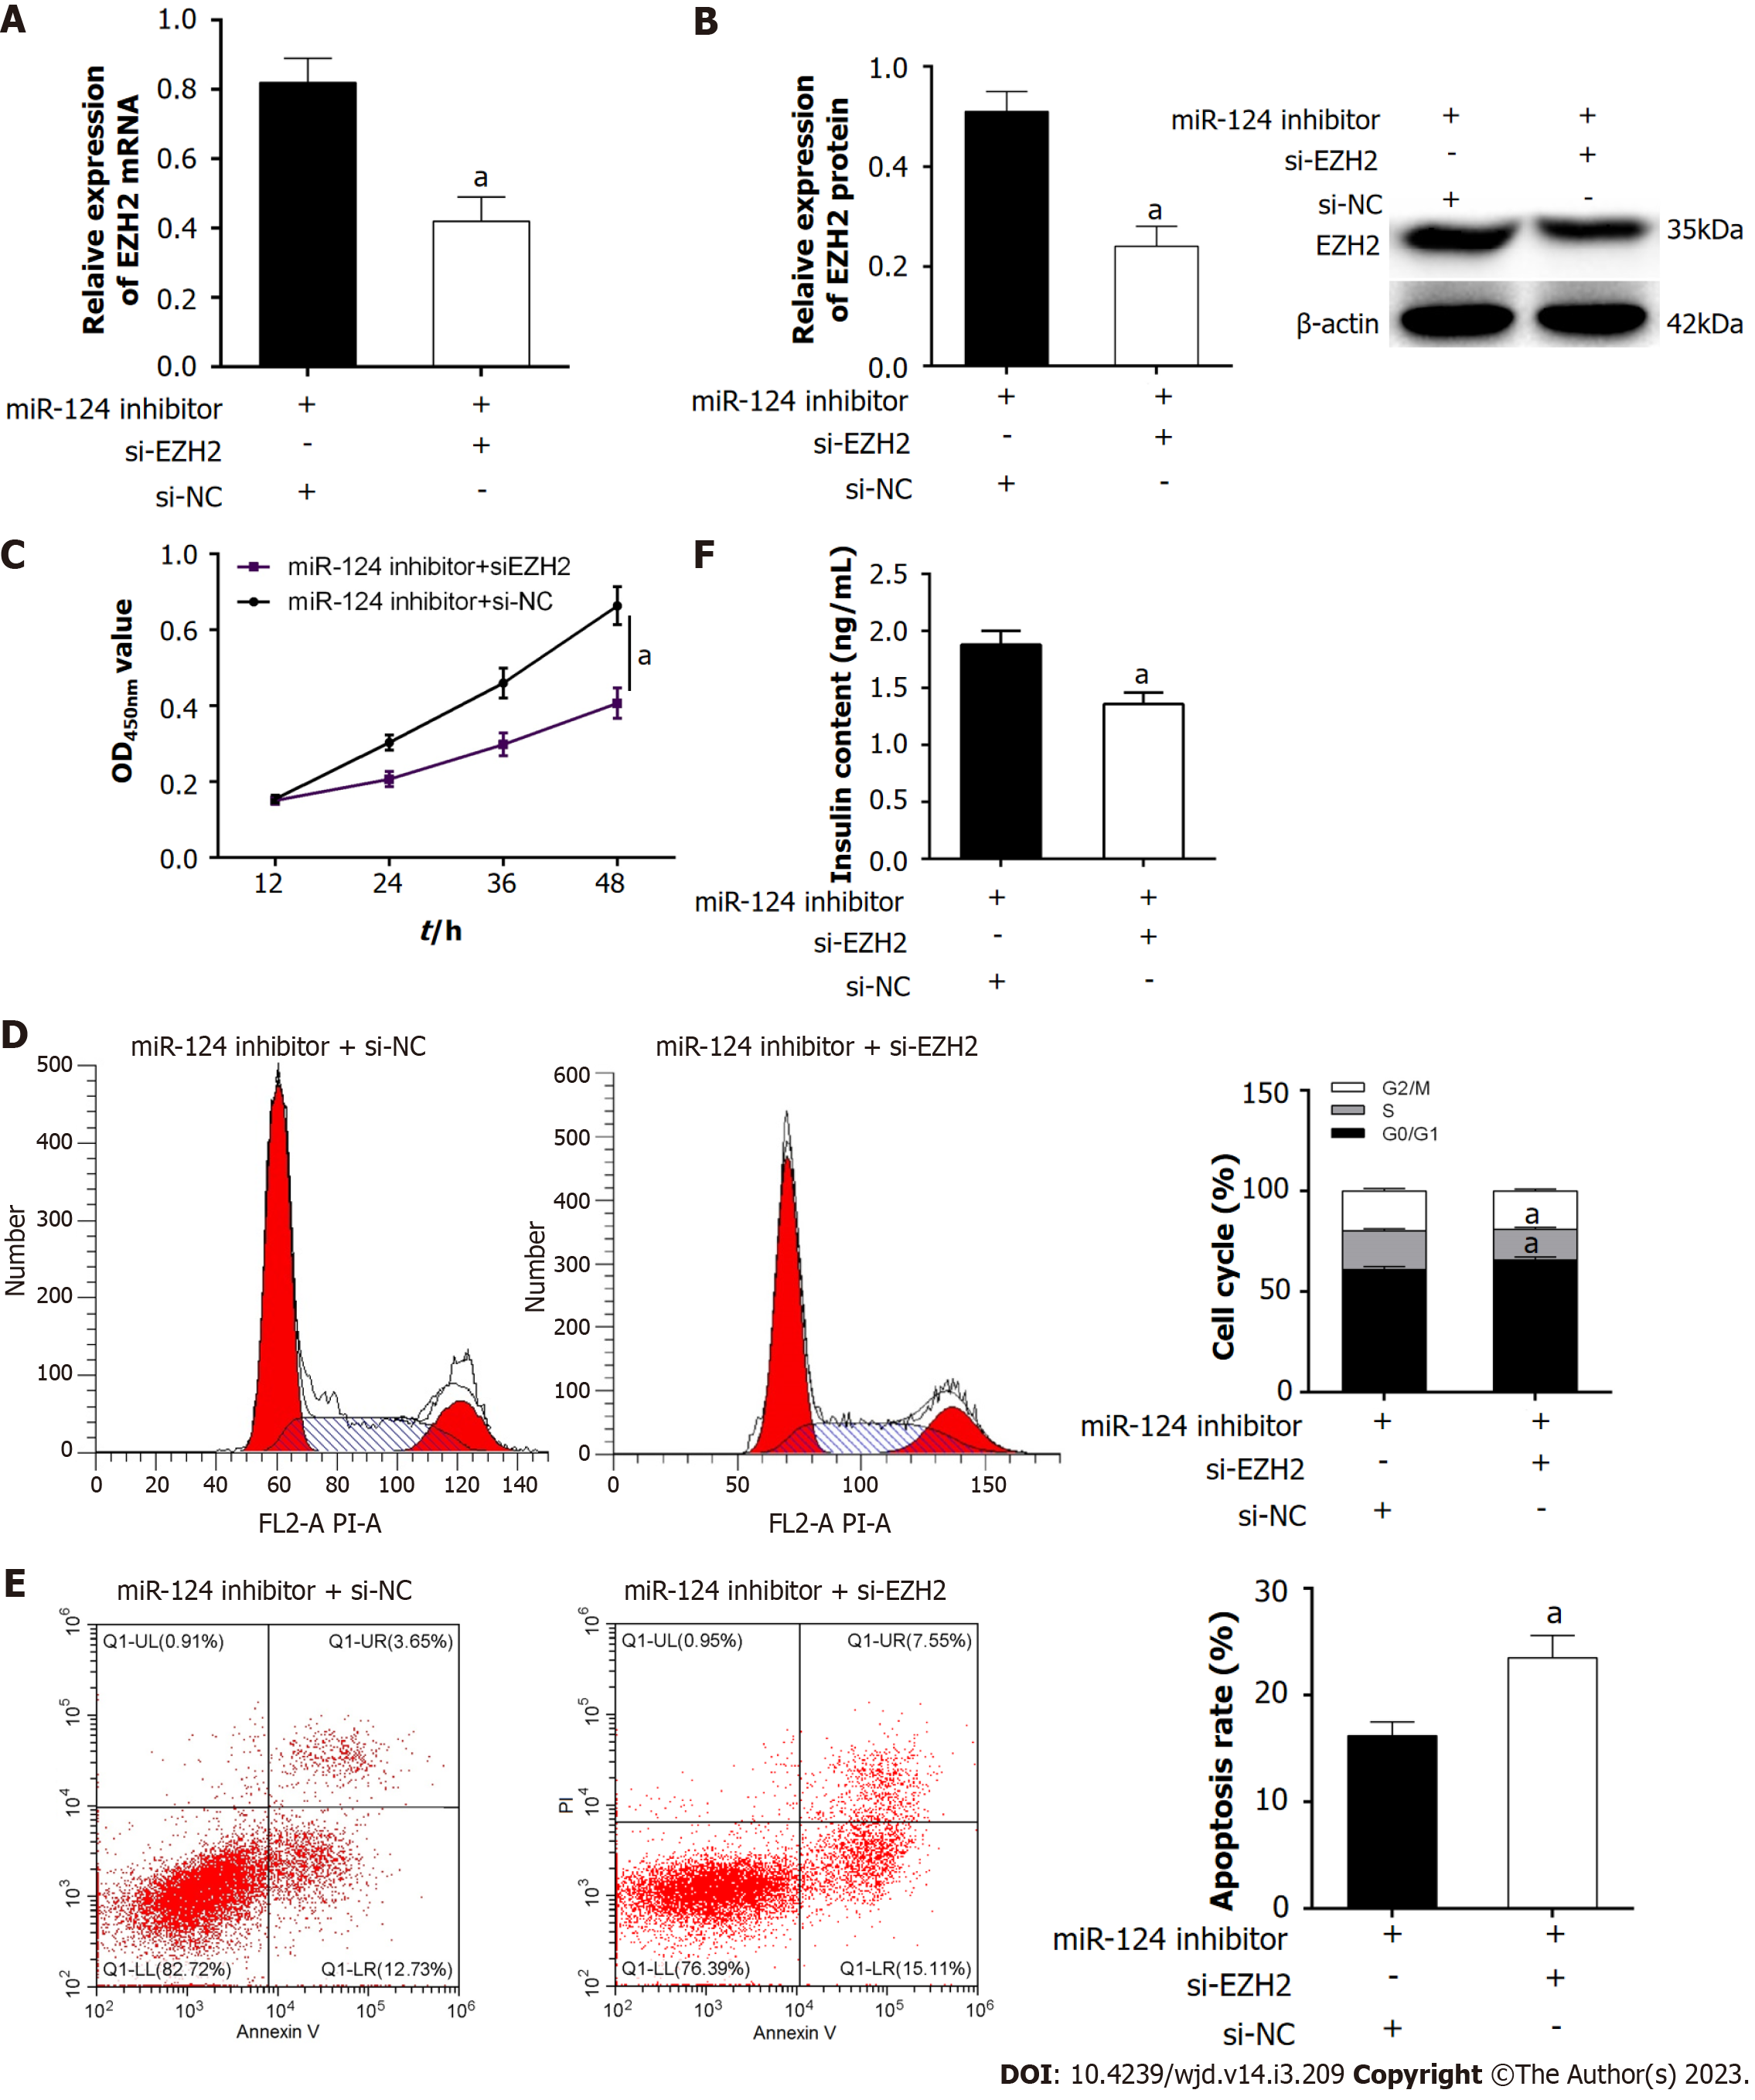
Figure 4 miR-124 protected pancreatic B cell function by targeting EZH2.
A and B: The relative expression levels of EZH2 mRNA and protein were downregulated by si-EZH2 in high glucose (HG)-induced Min6 cells detected by real-time quantitative polymerase chain reaction and Western blot; C: miR-124 inhibitor promoted the proliferation ability of HG-induced Min6 cells by targeting EZH2; D: miR-124 inhibitor promoted the transition from the G0/G1 phase to the S phase at the cell cycle by targeting EZH2; E: miR-124 inhibitor suppressed the apoptosis of HG-induced Min6 cells by targeting EZH2; F: miR-124 inhibitor increased the secretion of insulin in HG-induced Min6 cells by targeting EZH2. aP < 0.05, vs miR-124 inhibitor + si-NC group. NC: Normal control; BC: Blank control; HG: High glucose.
- Citation: Duan XK, Sun YX, Wang HY, Xu YY, Fan SZ, Tian JY, Yu Y, Zhao YY, Jiang YL. miR-124 is upregulated in diabetic mice and inhibits proliferation and promotes apoptosis of high-glucose-induced β-cells by targeting EZH2. World J Diabetes 2023; 14(3): 209-221
- URL: https://www.wjgnet.com/1948-9358/full/v14/i3/209.htm
- DOI: https://dx.doi.org/10.4239/wjd.v14.i3.209


