Copyright
©The Author(s) 2023.
World J Diabetes. Mar 15, 2023; 14(3): 170-178
Published online Mar 15, 2023. doi: 10.4239/wjd.v14.i3.170
Published online Mar 15, 2023. doi: 10.4239/wjd.v14.i3.170
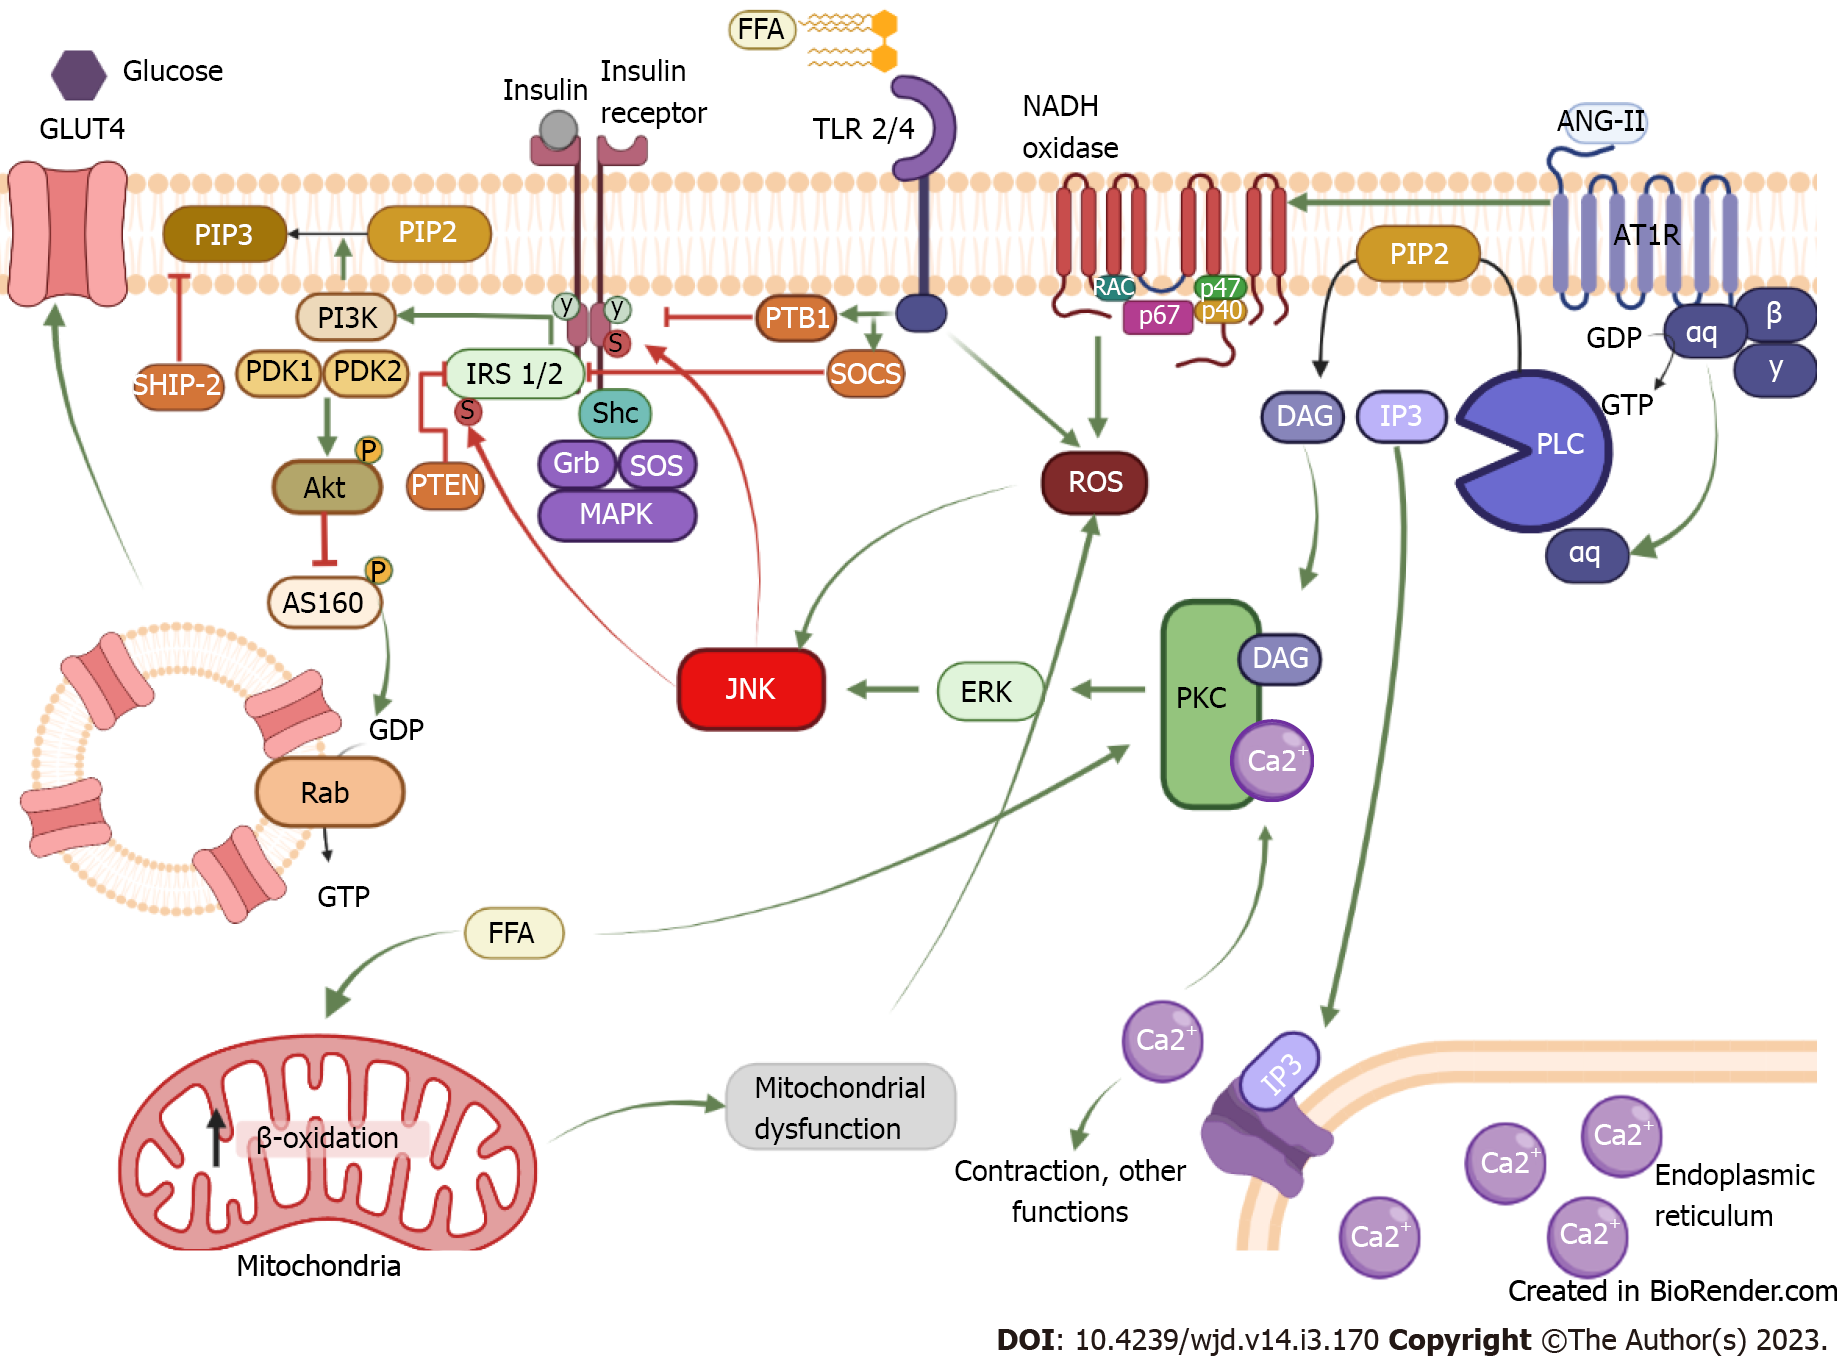
Figure 1 Mechanism of insulin resistance induced by chronic activation of the AT1 receptor.
The binding of insulin to its receptor induces phosphorylation in tyrosine residues of the receptor; from there insulin can exert its function through two signaling pathways. In the first pathway, tyrosine phosphorylation allows the coupling of the IRS1/2, which serves as a scaffold protein for phosphatidylinositol-3 kinase (PI3K). In this way, PI3K has access to plasmatic membrane lipids and phosphorylates phosphatidylinositol 3,4-bisphosphate (PIP2) and converts them into phosphatidylinositol 3,4,5-triphosphate (PIP3). This serves as a storage site for phosphoinositide-dependent protein kinase 1 (PDK1), which together with PDK2 causes the activation of Akt. When Akt is active, it inhibits AS160, allowing GLUT 4 to be released to the cell membrane. The second pathway is the mitogen-activated kinase (MAPK) kinase. This signaling pathway starts with Shc coupling, which serves as a scaffold protein for Grb and son of sevenless (SOS). Activation of SOS can transform guanosine diphosphate or guanosine triphosphate in small G proteins, inducing the MAPK pathway which results in cellular growth and proliferation. Conversely, insulin signaling is negatively regulated by various proteins phosphatases like PTB1B that acts by inhibiting the receptor, phosphatase and tension homologue and suppressor of cytokine signaling (SOCS), which inhibit IRS 1/2 or SH-2 domain containing inositol 5-phosphatase-2 that dephosphorylates PIP3. Chronic activation of the AT1 receptor by angiotensin II induces activation of phospholipase C transforming PIP2 into IP3 and diacylglycerol (DAG). IP3 heads to the reticulum and releases calcium, so by itself it is involved in contraction. Together with DAG, IP3 can activate protein kinase C (PKC), which phosphorylates extracellular signal-regulated kinases and activates it; once activated it can phosphorylate c-Jun N-terminal kinase (JNK). When JNK is activated, it can phosphorylate the insulin receptor and IRS on serine residues, reducing IR and IRS function and resulting in insulin resistance development. Indeed, AT1R can induce NADPH oxidase activation, which produces reactive oxygen species that can activate JNK in a PKC-independent pathway. Another mechanism to activate JNK is through free fatty acid (FFA), these lipids can be sensed by TLR 2/4, and the activation of TLR promotes the enhancement of PTB1 and SOCS as well as the production of reactive oxygen species by the inflammatory response, ultimately activating JNK. Also, an increase in FFA in the mitochondria promotes excessive β-oxidation and induces mitochondrial dysfunction, resulting in oxidative stress and JNK activation. FFA: Free fatty acid; ISR 1/2: Insulin receptor substrate; ANG-II: Angiotensin II; GDP: Guanin diphosphate; GTP: Guanin triphosphate; PLC: Phospholipase C; PIP2: Phosphatidylinositol biphosphate; DAG: Diacylglycerol; IP3: Inositol-3-phosphate; PKC: Protein kinase C; ROS: Reactive oxygen species; PI3K: Phosphatidylinositol-3-kinase; PIP3: Phosphatidylinositol triphosphate; PDK1/2: Phosphoinositide-dependent protein kinase-1/2; AS160: Akt substrate of 160b; ERK: Extracellular regulated kinase; Shc: Src homology and collagen; SOCS: Suppressor of cytokine signaling; SOS: Sons of sevenless complex; Grb: Growth factor receptor binding protein; PTP-1B: Phosphotyrosine phosphatase 1-B; JNK: c-Jun amino-terminal kinase; PTEN: Phosphatase and tensin homolog; SHIP-2: The SH-2 domain containing inositol 5-phosphatase-2; MAPK: Mitogen-activated protein kinase. Created with BioRender.com.
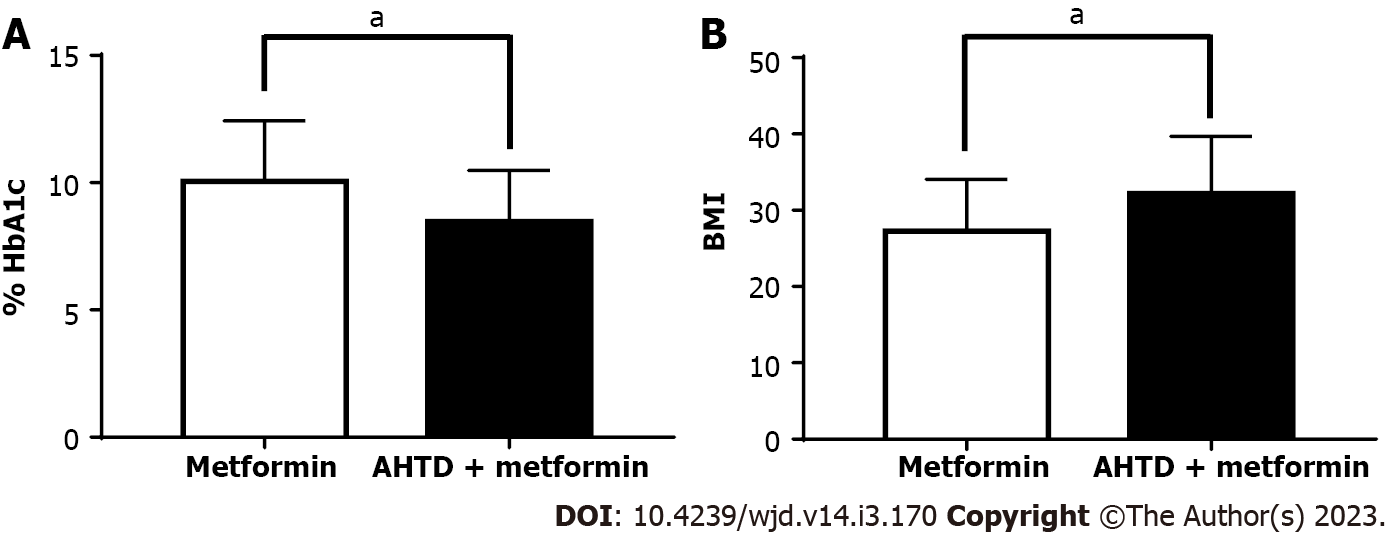
Figure 2 AT1 receptor antagonists boost glucose homeostasis and body mass index increase in type 2 diabetes mellitus patients.
A and B: Comparison between type 2 diabetes mellitus patients and patients diagnosed with type 2 diabetes mellitus and high blood pressure, whose treatment consisted of metformin or metformin + antihypertensive drugs (AHTD), respectively. Glycated hemoglobin A1c was determined for these two groups (A), as well as body mass index (B). Data are expressed as the mean ± SE using GraphPad 7.0 for Windows. n = 18 patients for the metformin group (white bars) and 43 patients for AHTD + metformin group (black bars). Data was collected from the database of patients who came to the internal medicine clinic at Mexicali General Hospital. The protocols carried out in the present study were previously approved by the Hospital General 5 de Diciembre of ISSSTE Mexicali, Mexico, ethics committee (Circular Letter number 0985/2017). aP < 0.05. AHTD: Antihypertensive drugs; BMI: Body mass index; HbA1c: Hemoglobin A1c.
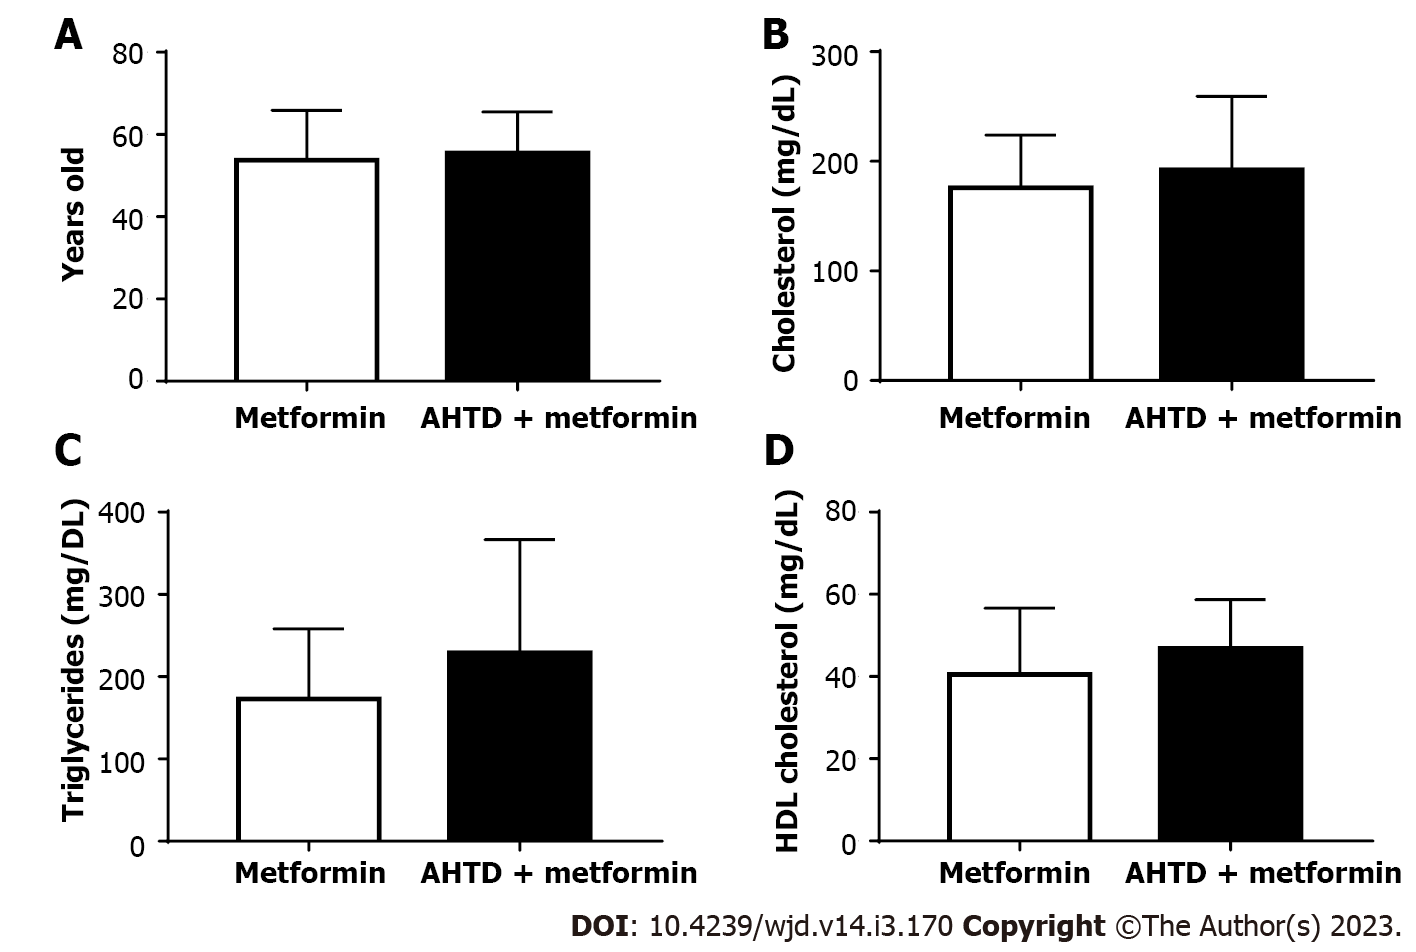
Figure 3 AT1 receptor antagonists promote gluconeogenesis decrease in type 2 diabetes mellitus patients.
A-D: Comparison between type 2 diabetes mellitus patients and patients diagnosed with type 2 diabetes mellitus and high blood pressure, whose treatment consisted of metformin or metformin + antihypertensive drugs (AHTD), respectively. The age of the patients was reported (A), and the levels of total cholesterol (B), triglycerides (C), and HDL cholesterol (D) in the blood were determined. Data are expressed as the mean ± SE using GraphPad 7.0 for Windows. n = 18 patients for the metformin group (white bars) and 43 patients for AHTD + metformin group (black bars). Data was collected from the database of patients who came to the internal medicine clinic at Mexicali General Hospital. The protocols carried out in the present study were previously approved by the Hospital General 5 de Diciembre of ISSSTE Mexicali, Mexico, ethics committee (Circular Letter number 0985/2017). AHTD: Antihypertensive drugs.
- Citation: Lopez DL, Casillas OE, Jaramillo HJ, Romero-Garcia T, Vazquez-Jimenez JG. AT1 receptor downregulation: A mechanism for improving glucose homeostasis. World J Diabetes 2023; 14(3): 170-178
- URL: https://www.wjgnet.com/1948-9358/full/v14/i3/170.htm
- DOI: https://dx.doi.org/10.4239/wjd.v14.i3.170


