Copyright
©The Author(s) 2023.
World J Diabetes. Dec 15, 2023; 14(12): 1793-1802
Published online Dec 15, 2023. doi: 10.4239/wjd.v14.i12.1793
Published online Dec 15, 2023. doi: 10.4239/wjd.v14.i12.1793
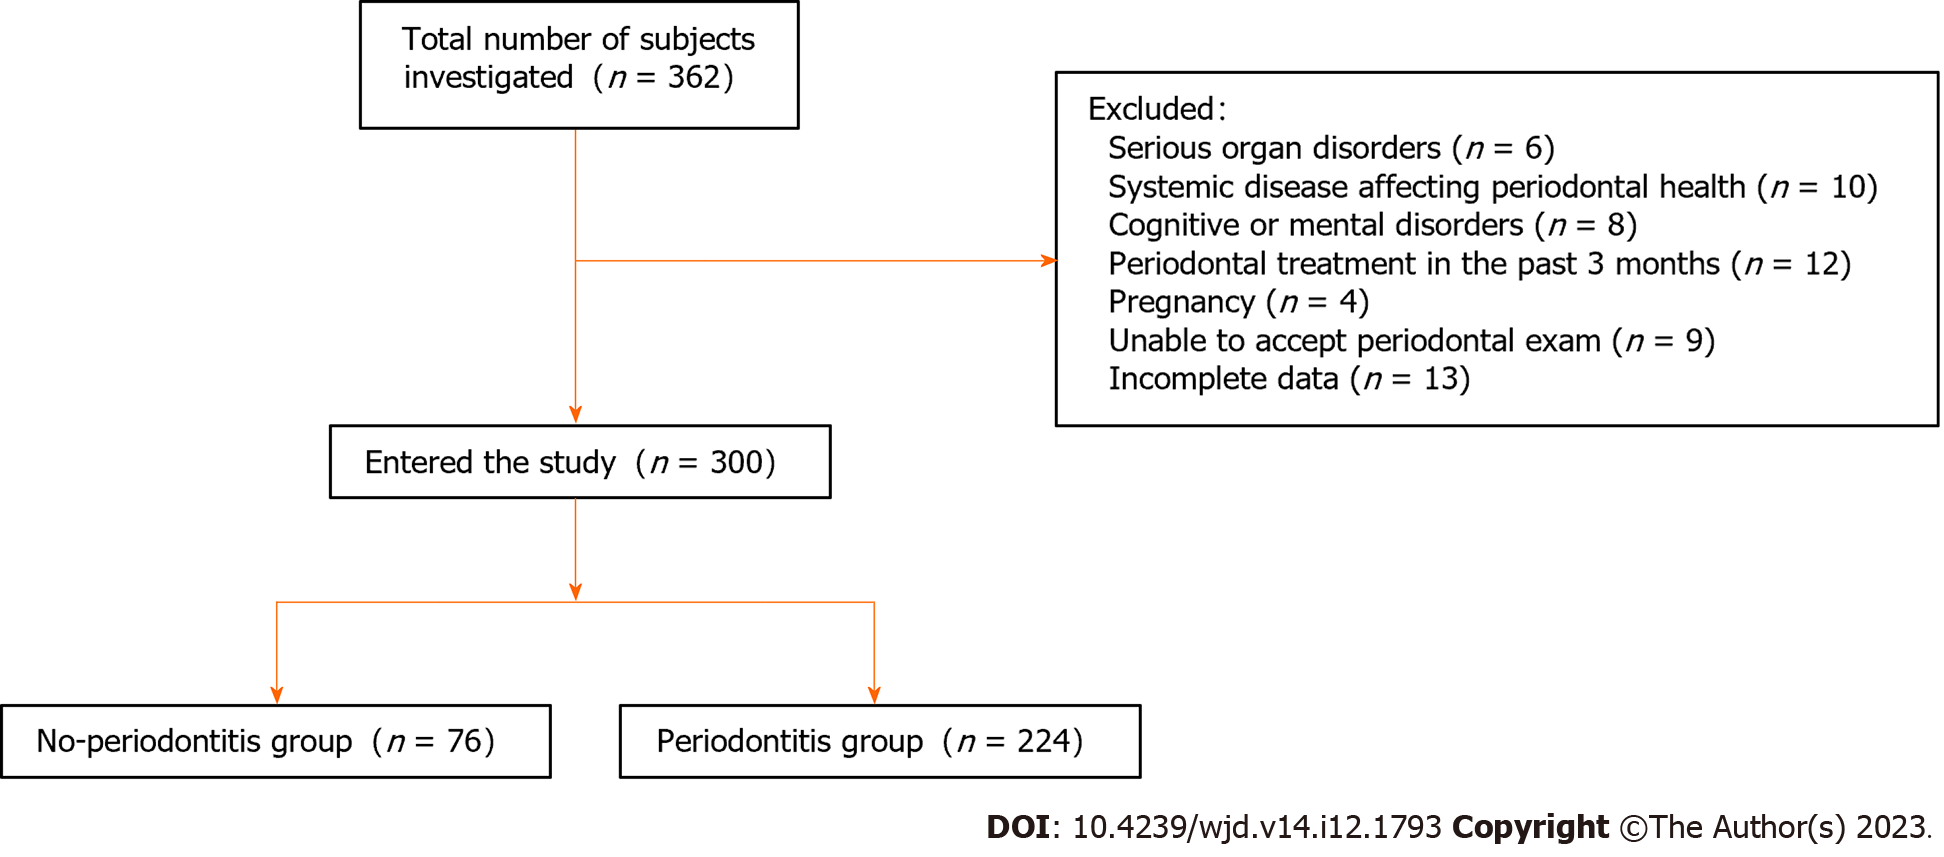
Figure 1 Flow diagram.
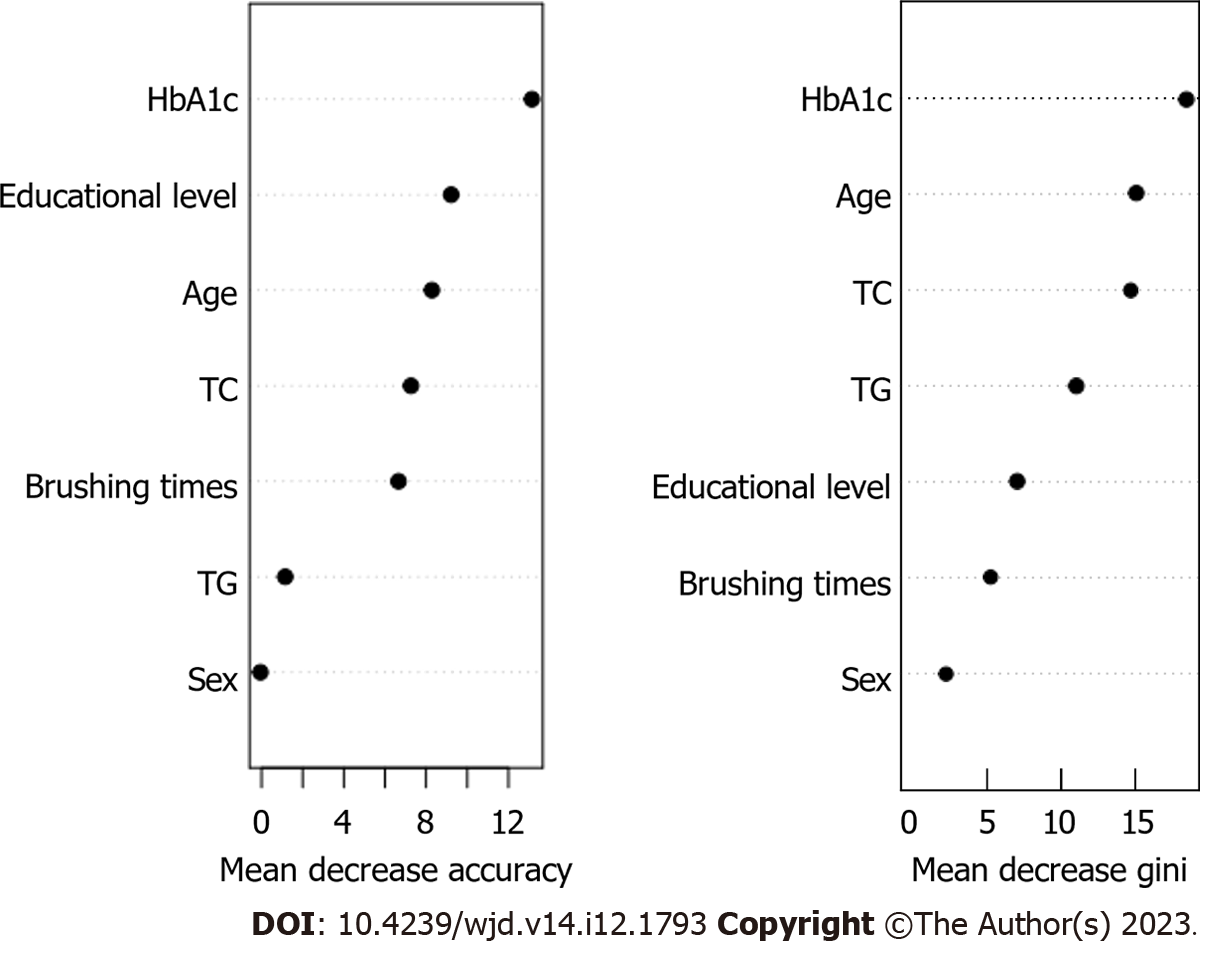
Figure 2 Importance of variables in the random forest model.
HbA1c: Glycosylated hemoglobin; TC: Total cholesterol; TG: Triglyceride.
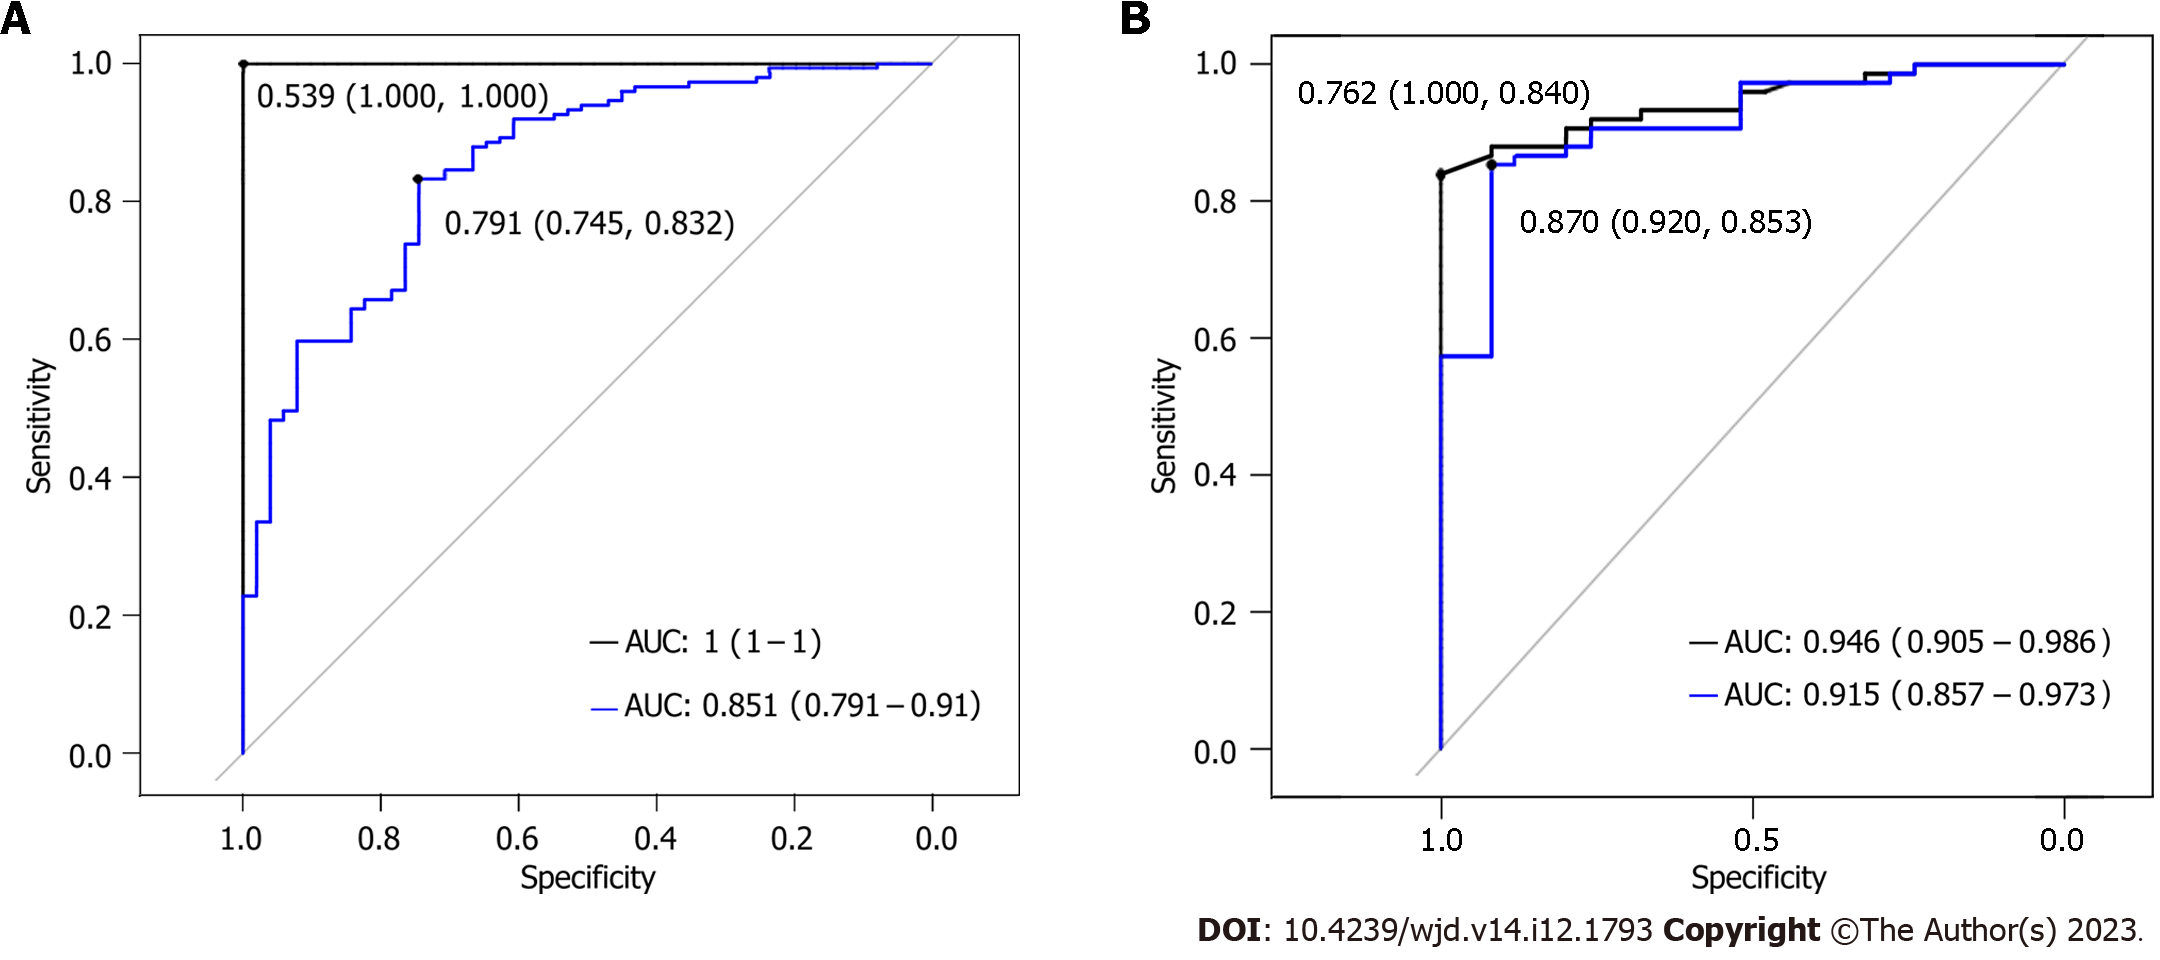
Figure 3 Receiver operating characteristic curves of the random forest (black) and logistic regression (blue) models.
A: For the training set; B: For the validation set. AUC: Area under curve.
- Citation: Xu HM, Shen XJ, Liu J. Establishment of models to predict factors influencing periodontitis in patients with type 2 diabetes mellitus. World J Diabetes 2023; 14(12): 1793-1802
- URL: https://www.wjgnet.com/1948-9358/full/v14/i12/1793.htm
- DOI: https://dx.doi.org/10.4239/wjd.v14.i12.1793


