Copyright
©The Author(s) 2023.
World J Diabetes. Nov 15, 2023; 14(11): 1643-1658
Published online Nov 15, 2023. doi: 10.4239/wjd.v14.i11.1643
Published online Nov 15, 2023. doi: 10.4239/wjd.v14.i11.1643
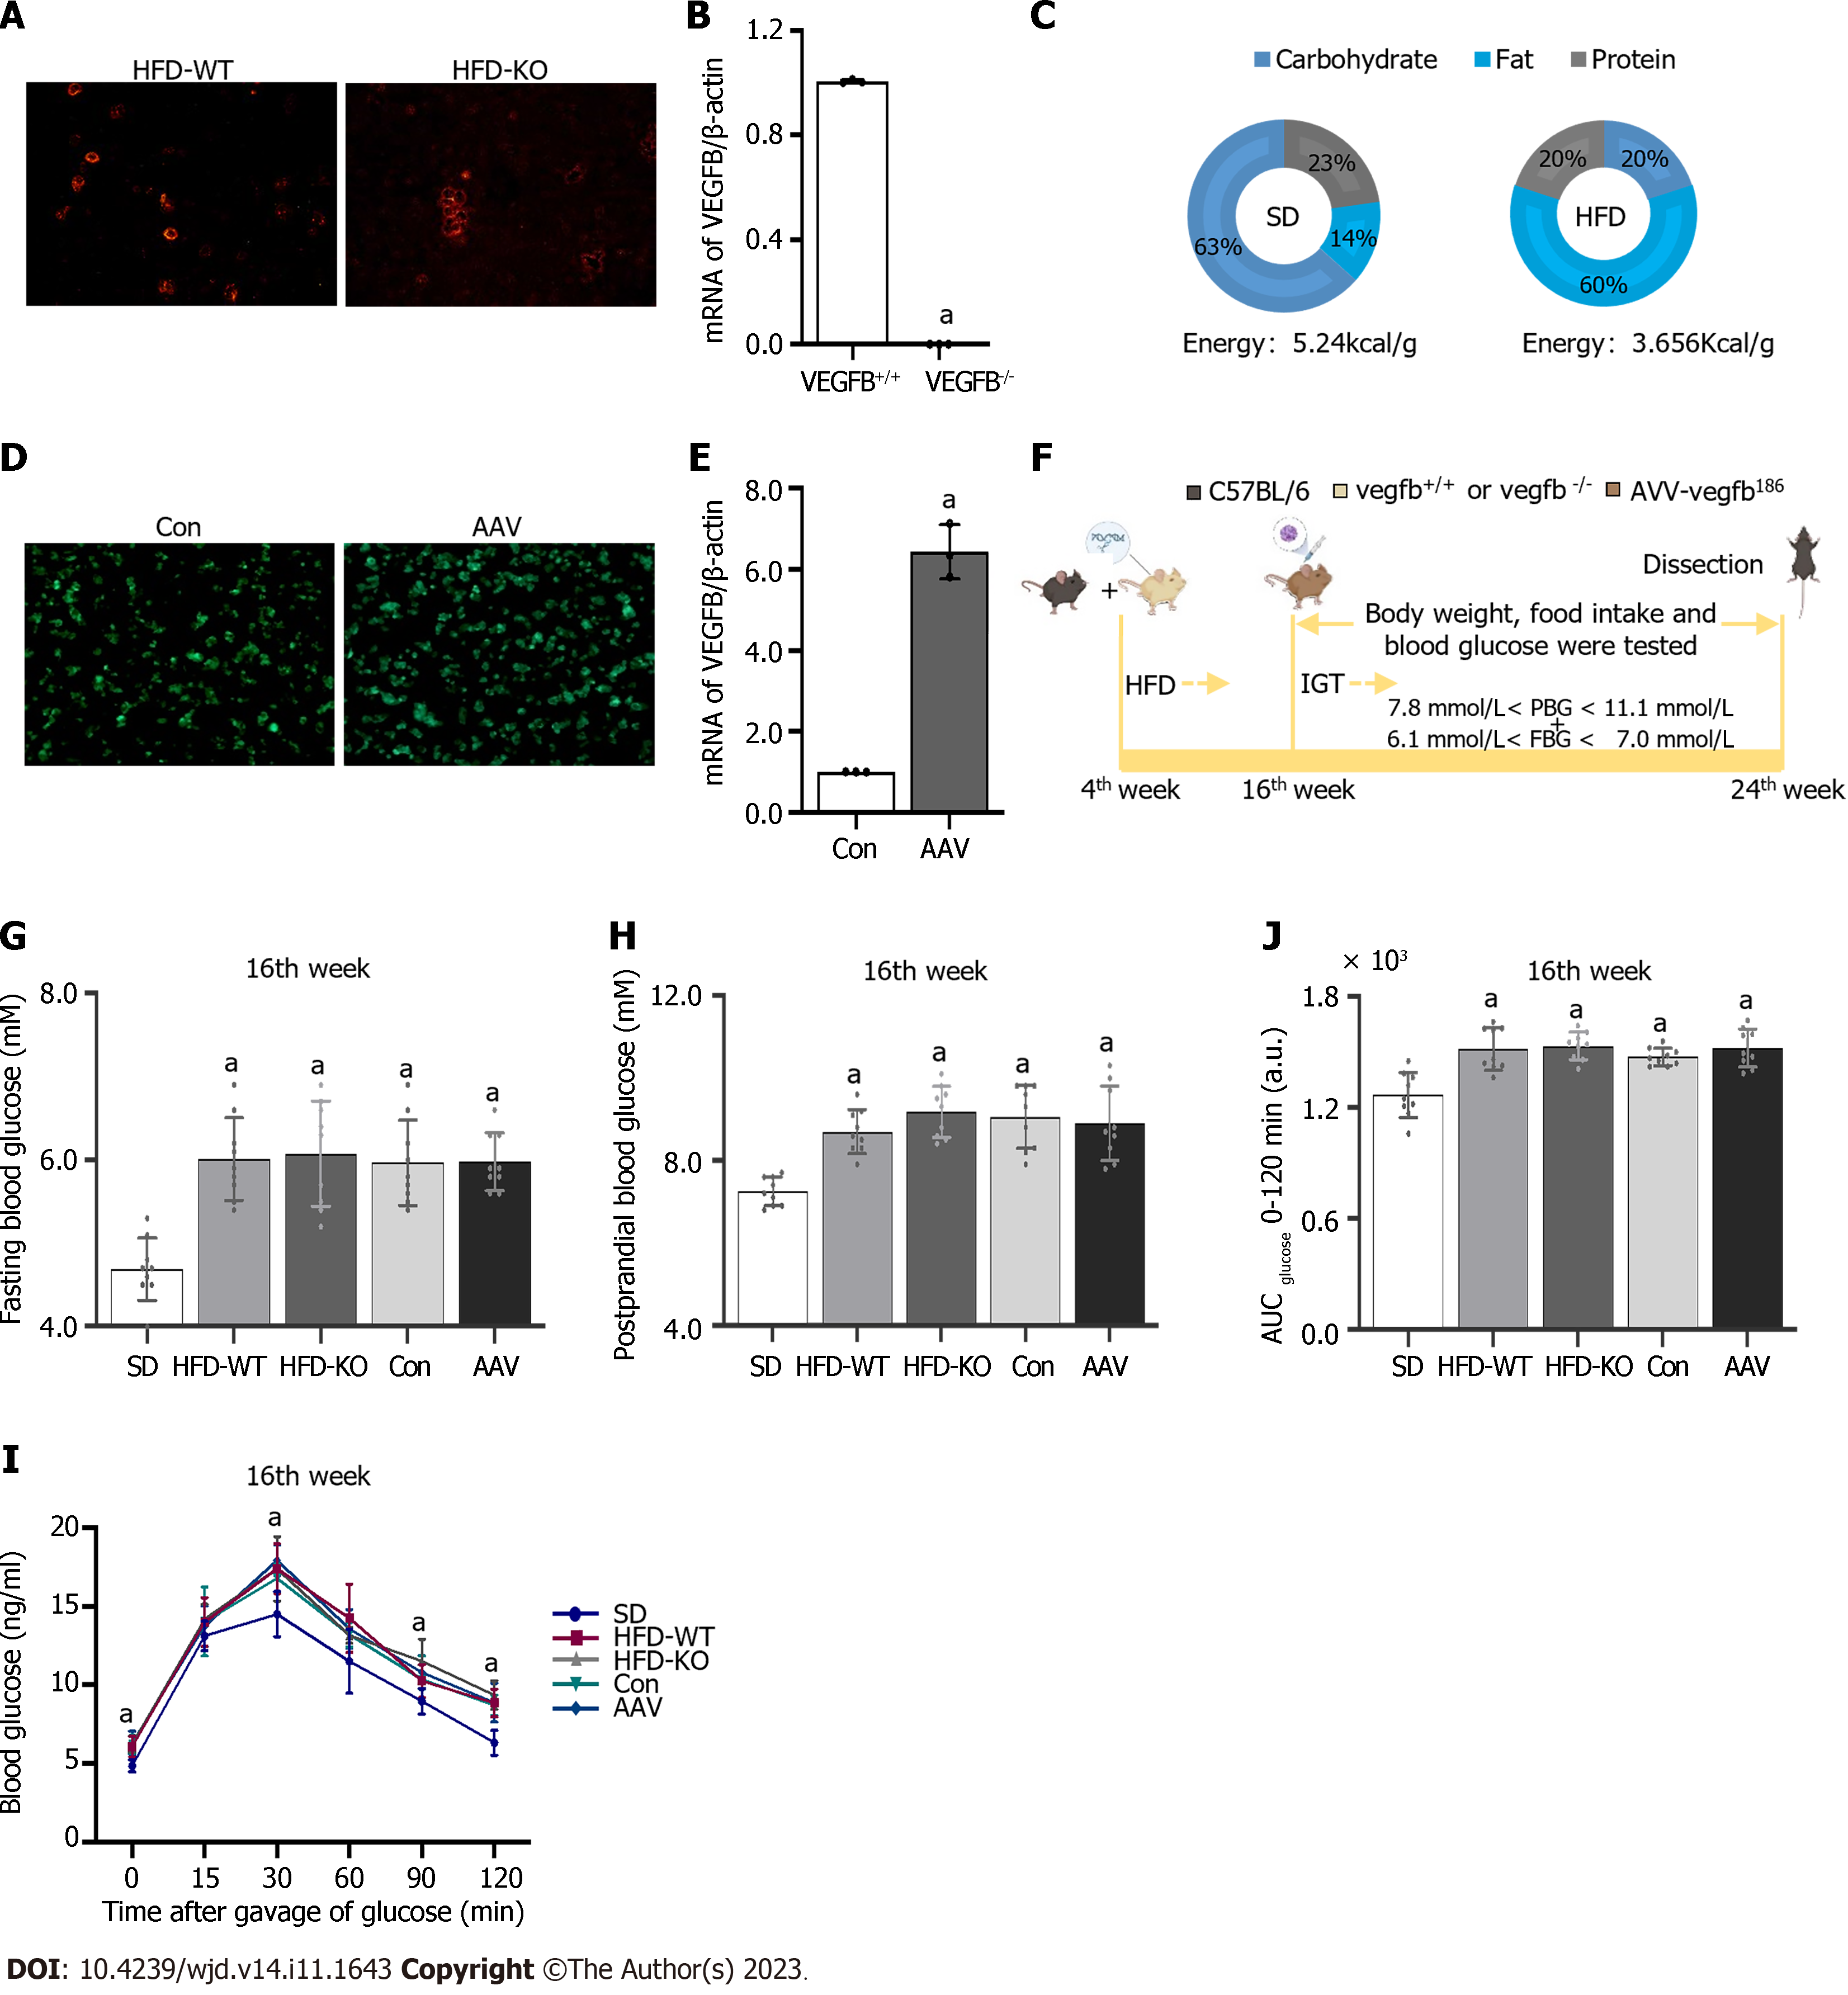
Figure 1 The construction of impaired glucose tolerance mice with vascular endothelial growth factor B gene knockout and overexpressed.
A: Active Stain of the islet cell mass in high-fat diet (HFD)-WT and HFD-KO mice; B: The mRNA expression of vascular endothelial growth factor B (VEGFB) in the islet of mice in the HFD-WT and HFD-KO group; C: The ingredients of standard diet (SD) and HFD; D: Green fluorescence staining of the islet with adeno-associated virus (AAV) infection in Con and AAV mice; E: The mRNA expression of VEGFB in the islet of mice in the Con and AAV group; F: The flow chart of animal experiments; G: Fasting blood glucose at the 16th wk; H: PBG at the 16th wk; I: Oral glucose tolerance test at the 16th wk; J: Area under the curve at the 16th wk. aP < 0.05 vs vegfb+/+; aP < 0.05 vs Con; aP < 0.05 vs SD. HFD: High-fat diet; AAV: Adeno-associated virus; SD: Standard diet; VEGF: Vascular endothelial growth factor.
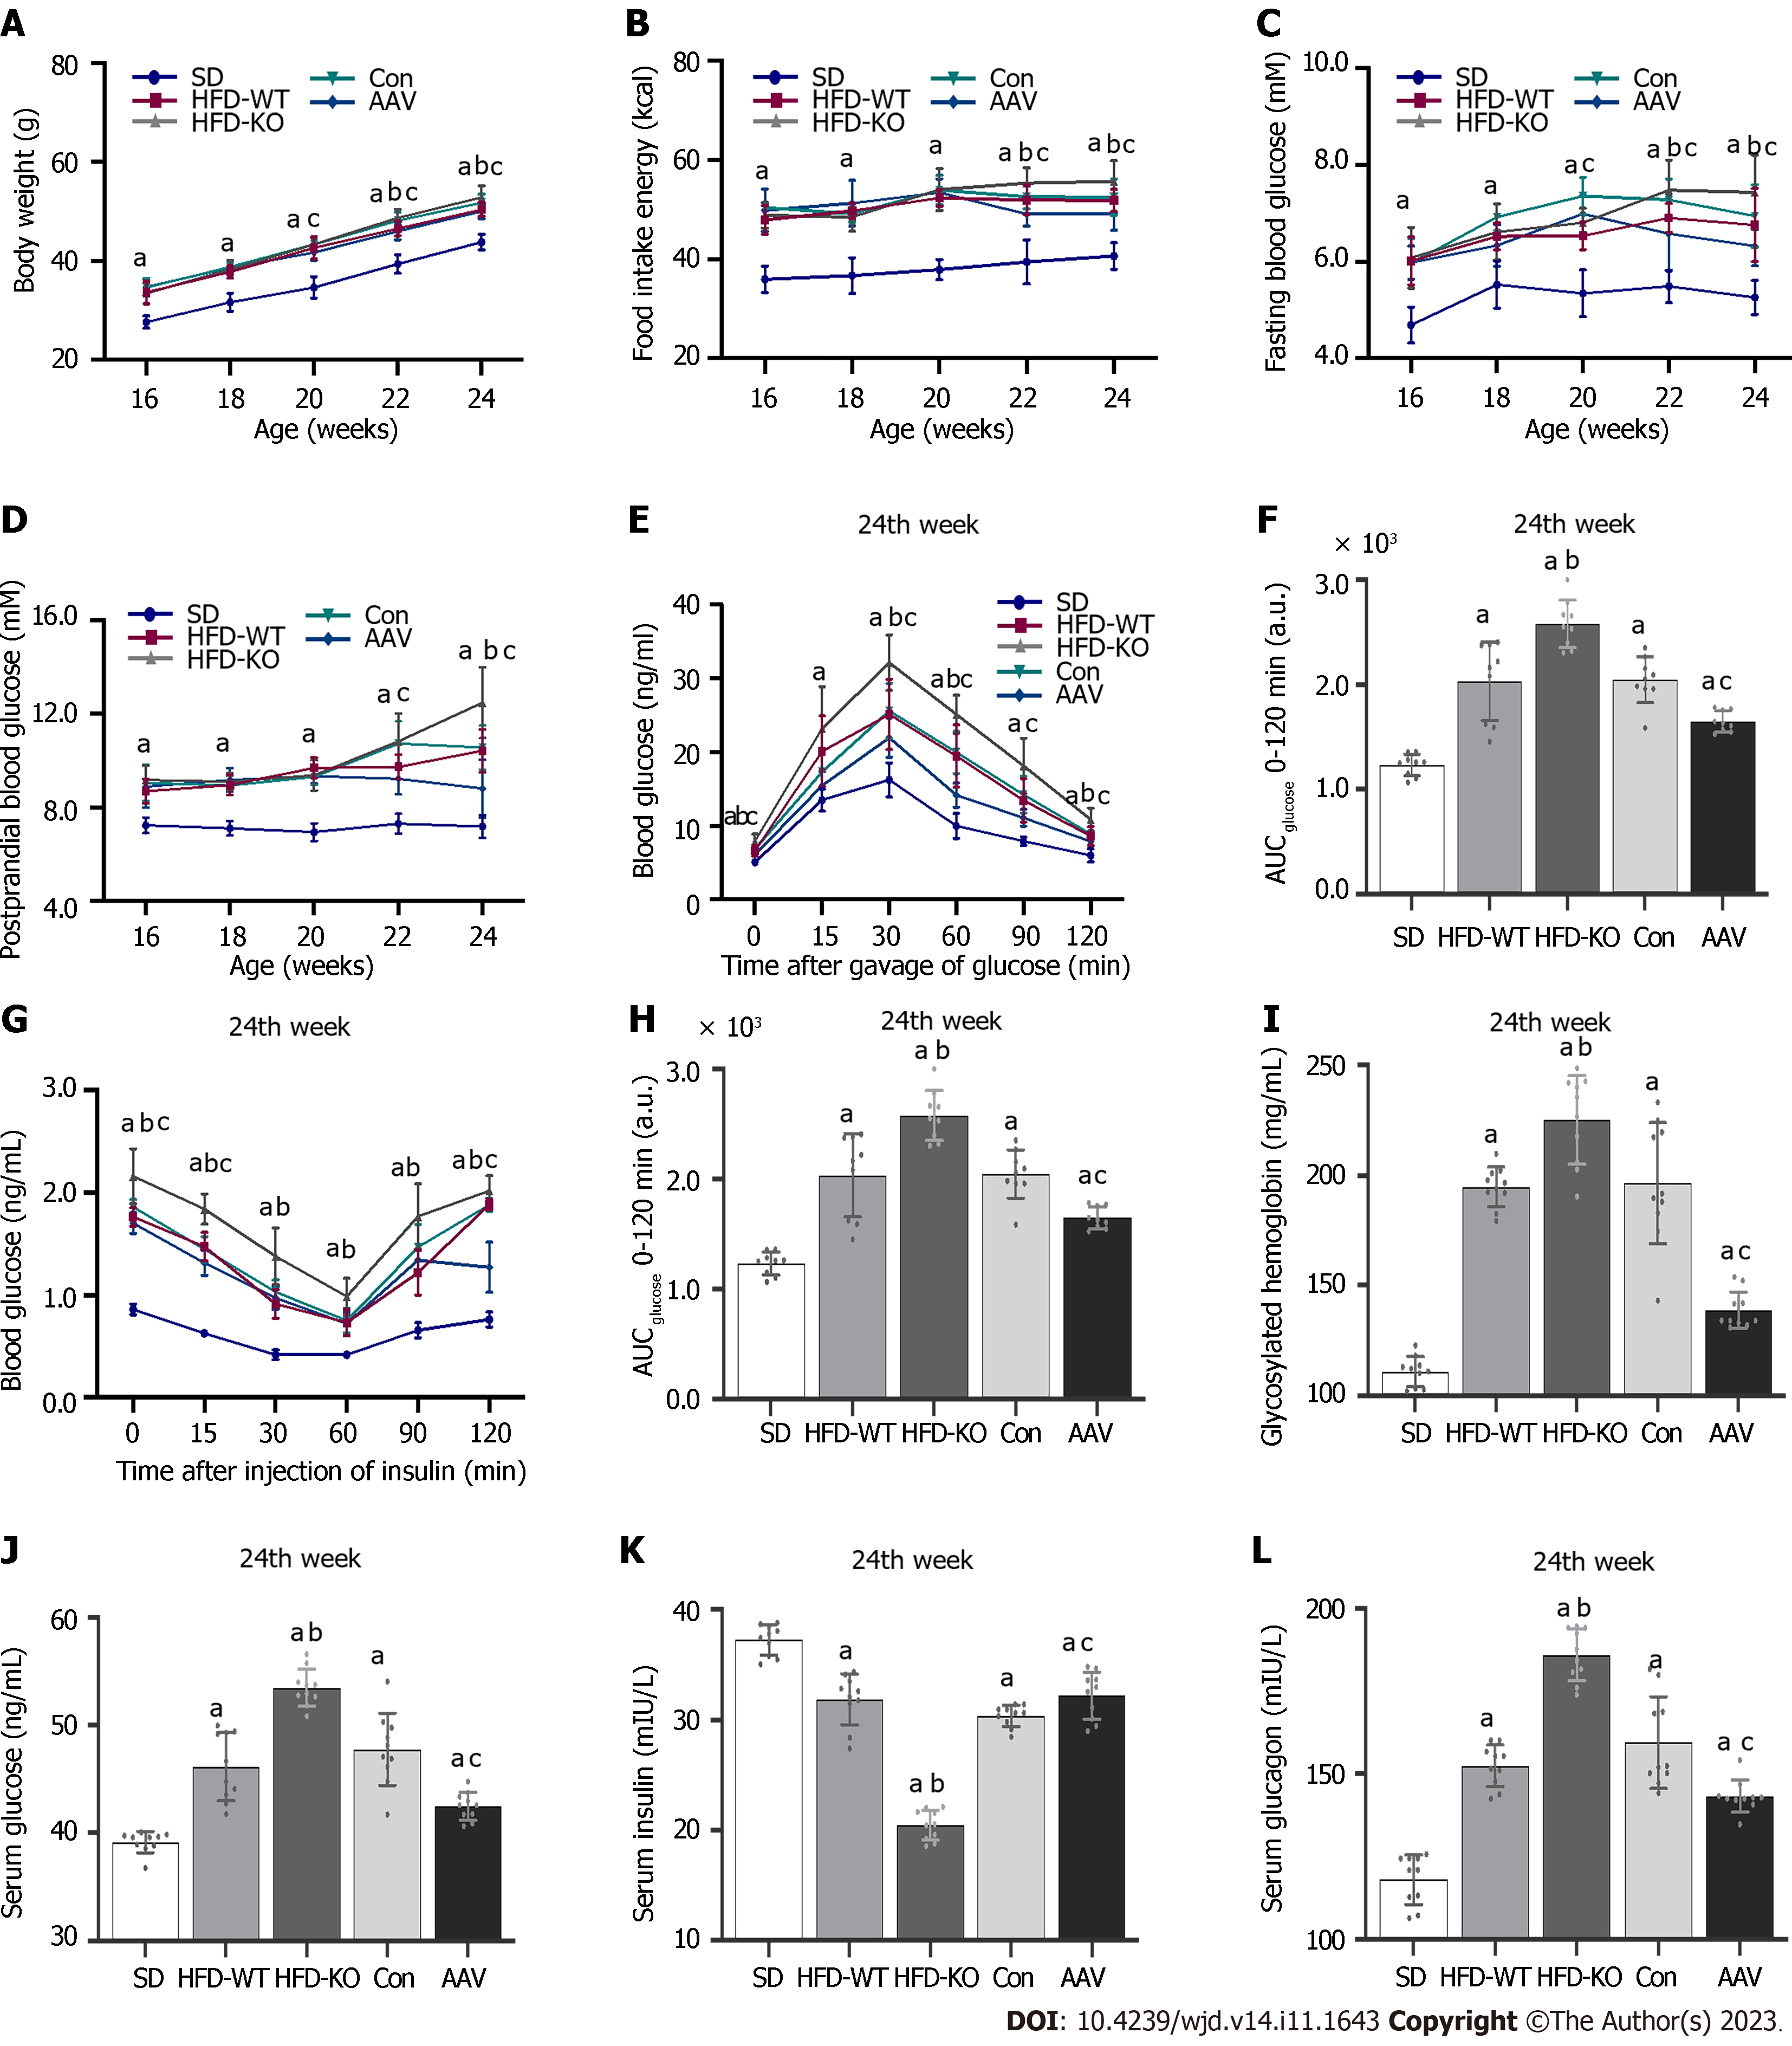
Figure 2 Effects of vascular endothelial growth factor B on body weight and blood glucose level.
A: Body weight from the 16th to the 24th wk; B: Food intake energy from the 16th to the 24th wk; C: Fasting blood glucose from the 16th to the 24th wk; D: PBG from the 16th to the 24th wk; E and F: Oral glucose tolerance test and area under the curve (AUC); G and H: Intraperitoneal insulin tolerance test and AUC; I: GHb; J: Serum glucose; K: Serum insulin; L: Serum glucagon. aP < 0.05 vs standard diet; bP < 0.05 vs high-fat diet-WT; cP < 0.05 vs Con. HFD: High-fat diet; AAV: Adeno-associated virus; SD: Standard diet.
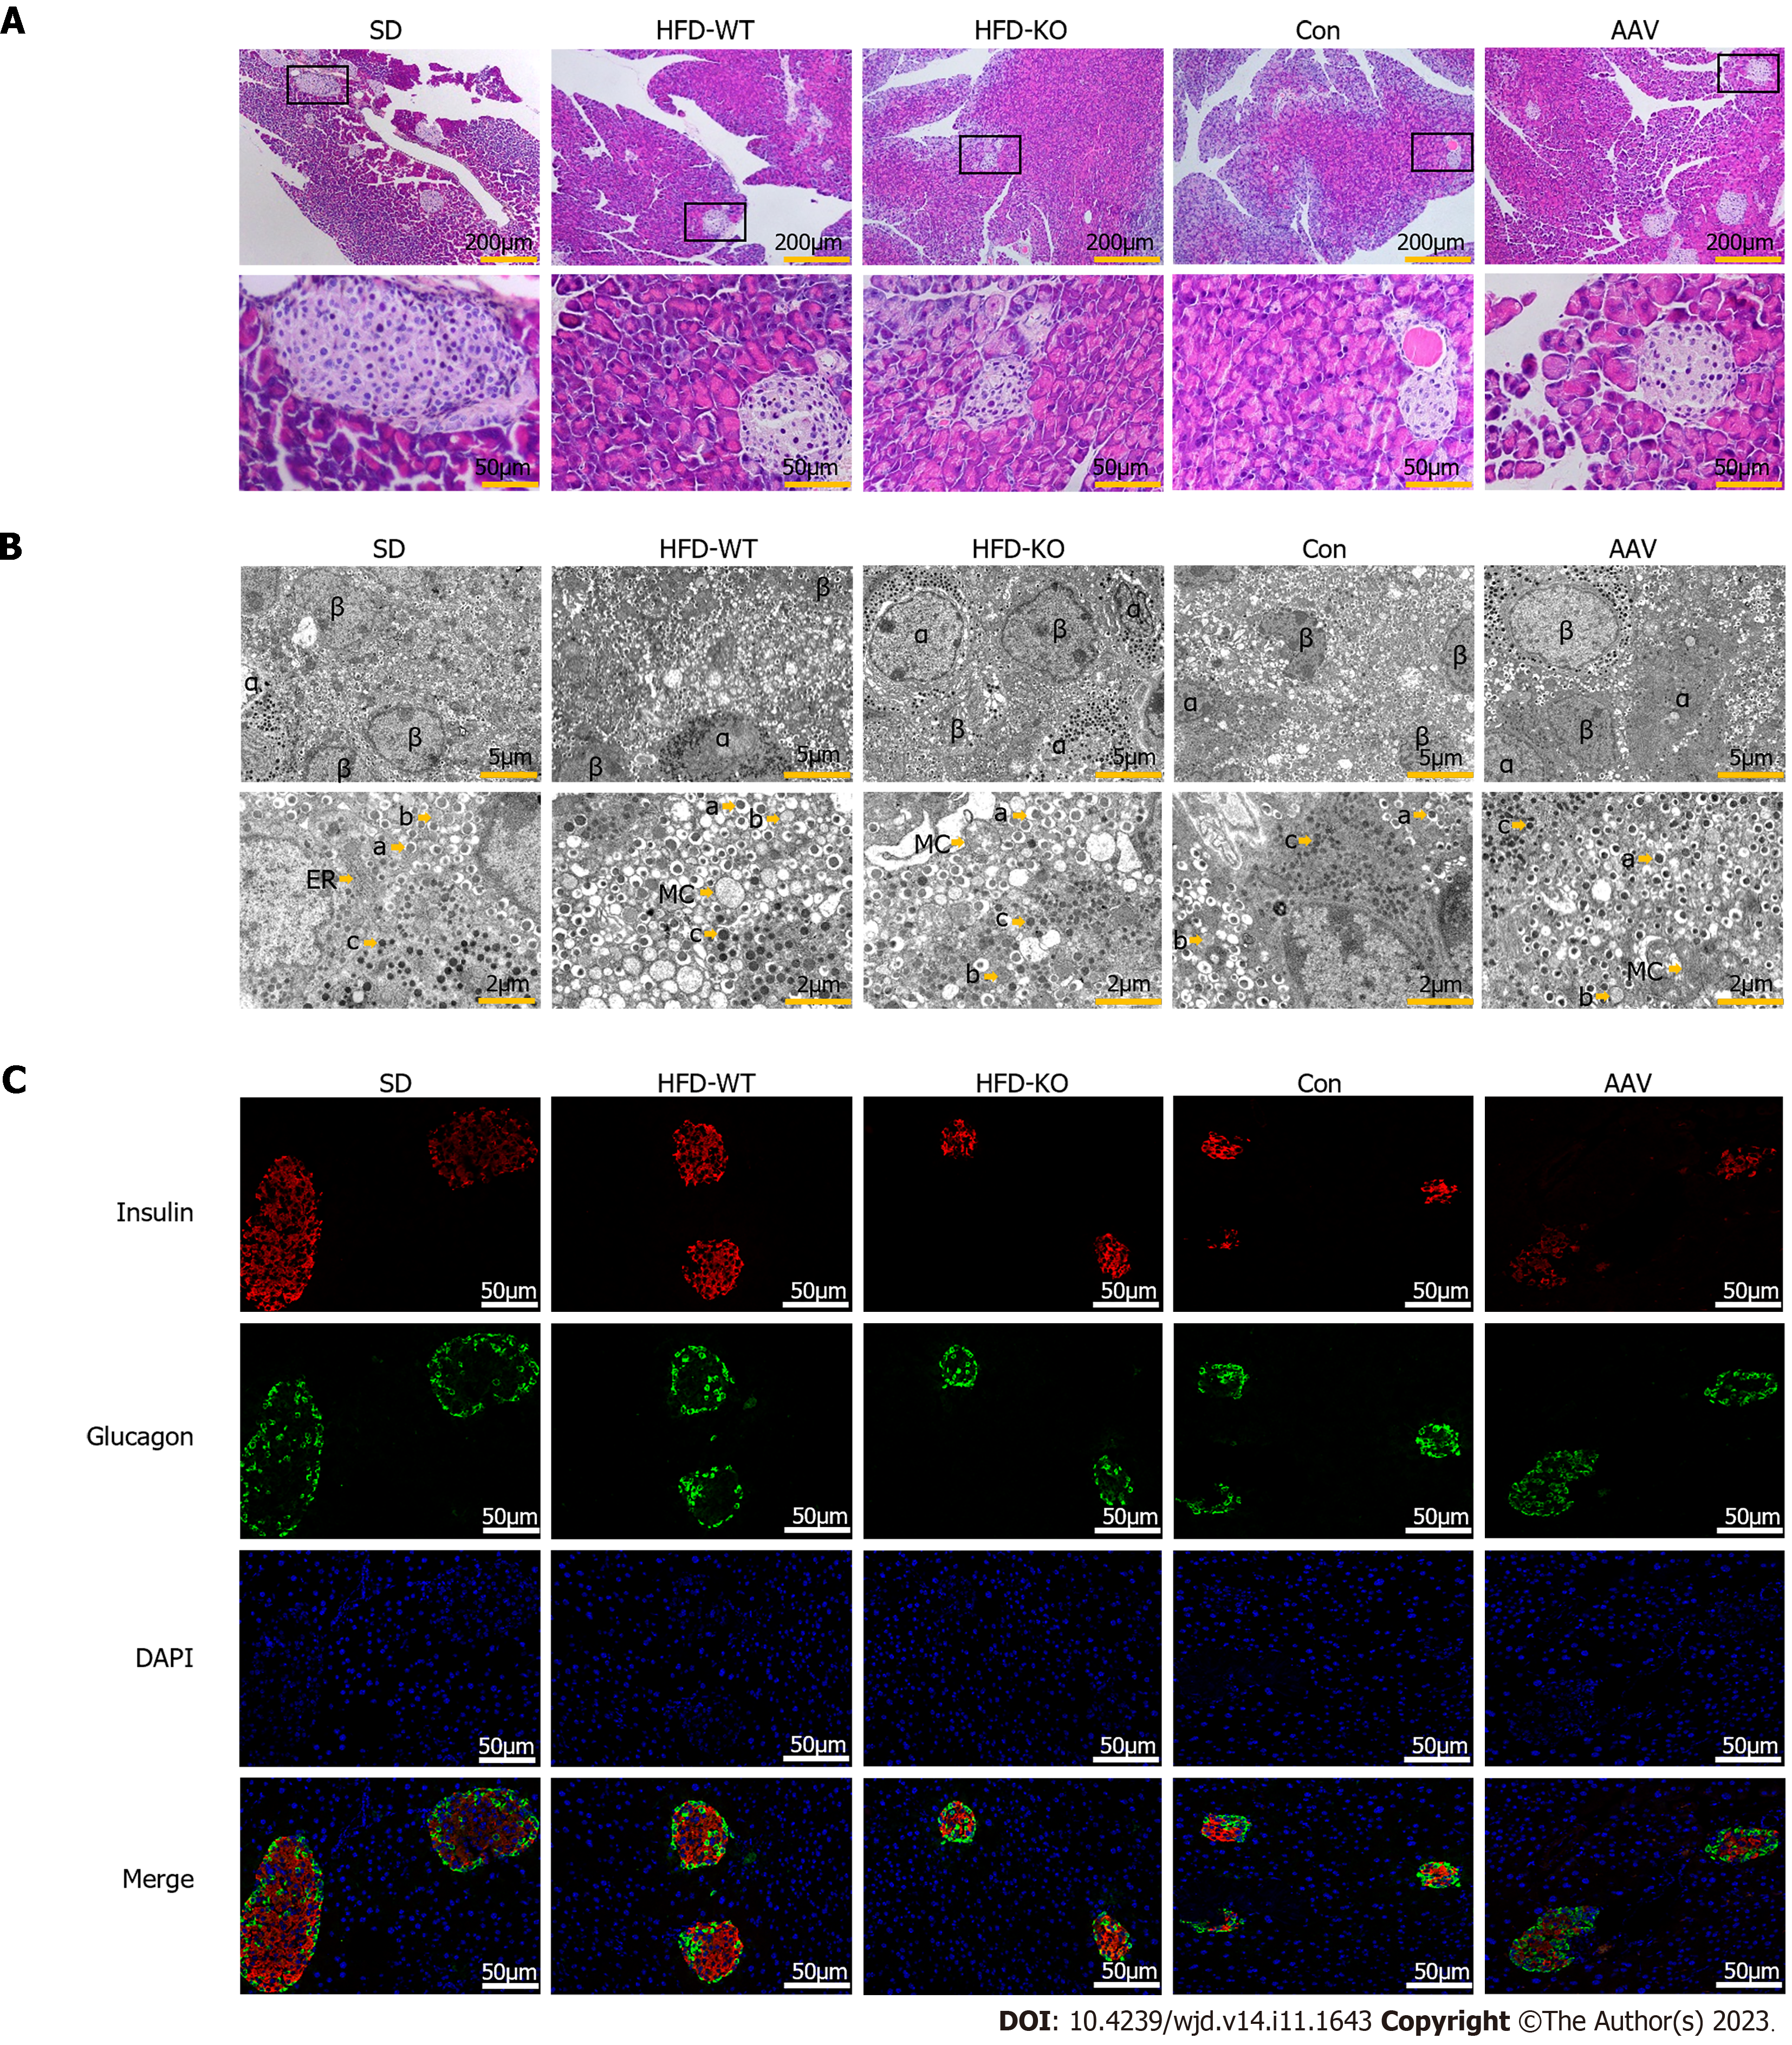
Figure 3 Effects of vascular endothelial growth factor B on the cellular structure of islet.
A: The HE staining of the pancreas under the light microscope (scale bar = 200 μm and 50 μm); B: The ultrastructure of the islet cell under the transmission electron microscope (scale bar = 5 μm and 2 μm); C: The immunofluorescence of islet cells under the fluorescence microscope (scale bar = 50 μm). HFD: High-fat diet; SD: Standard diet.
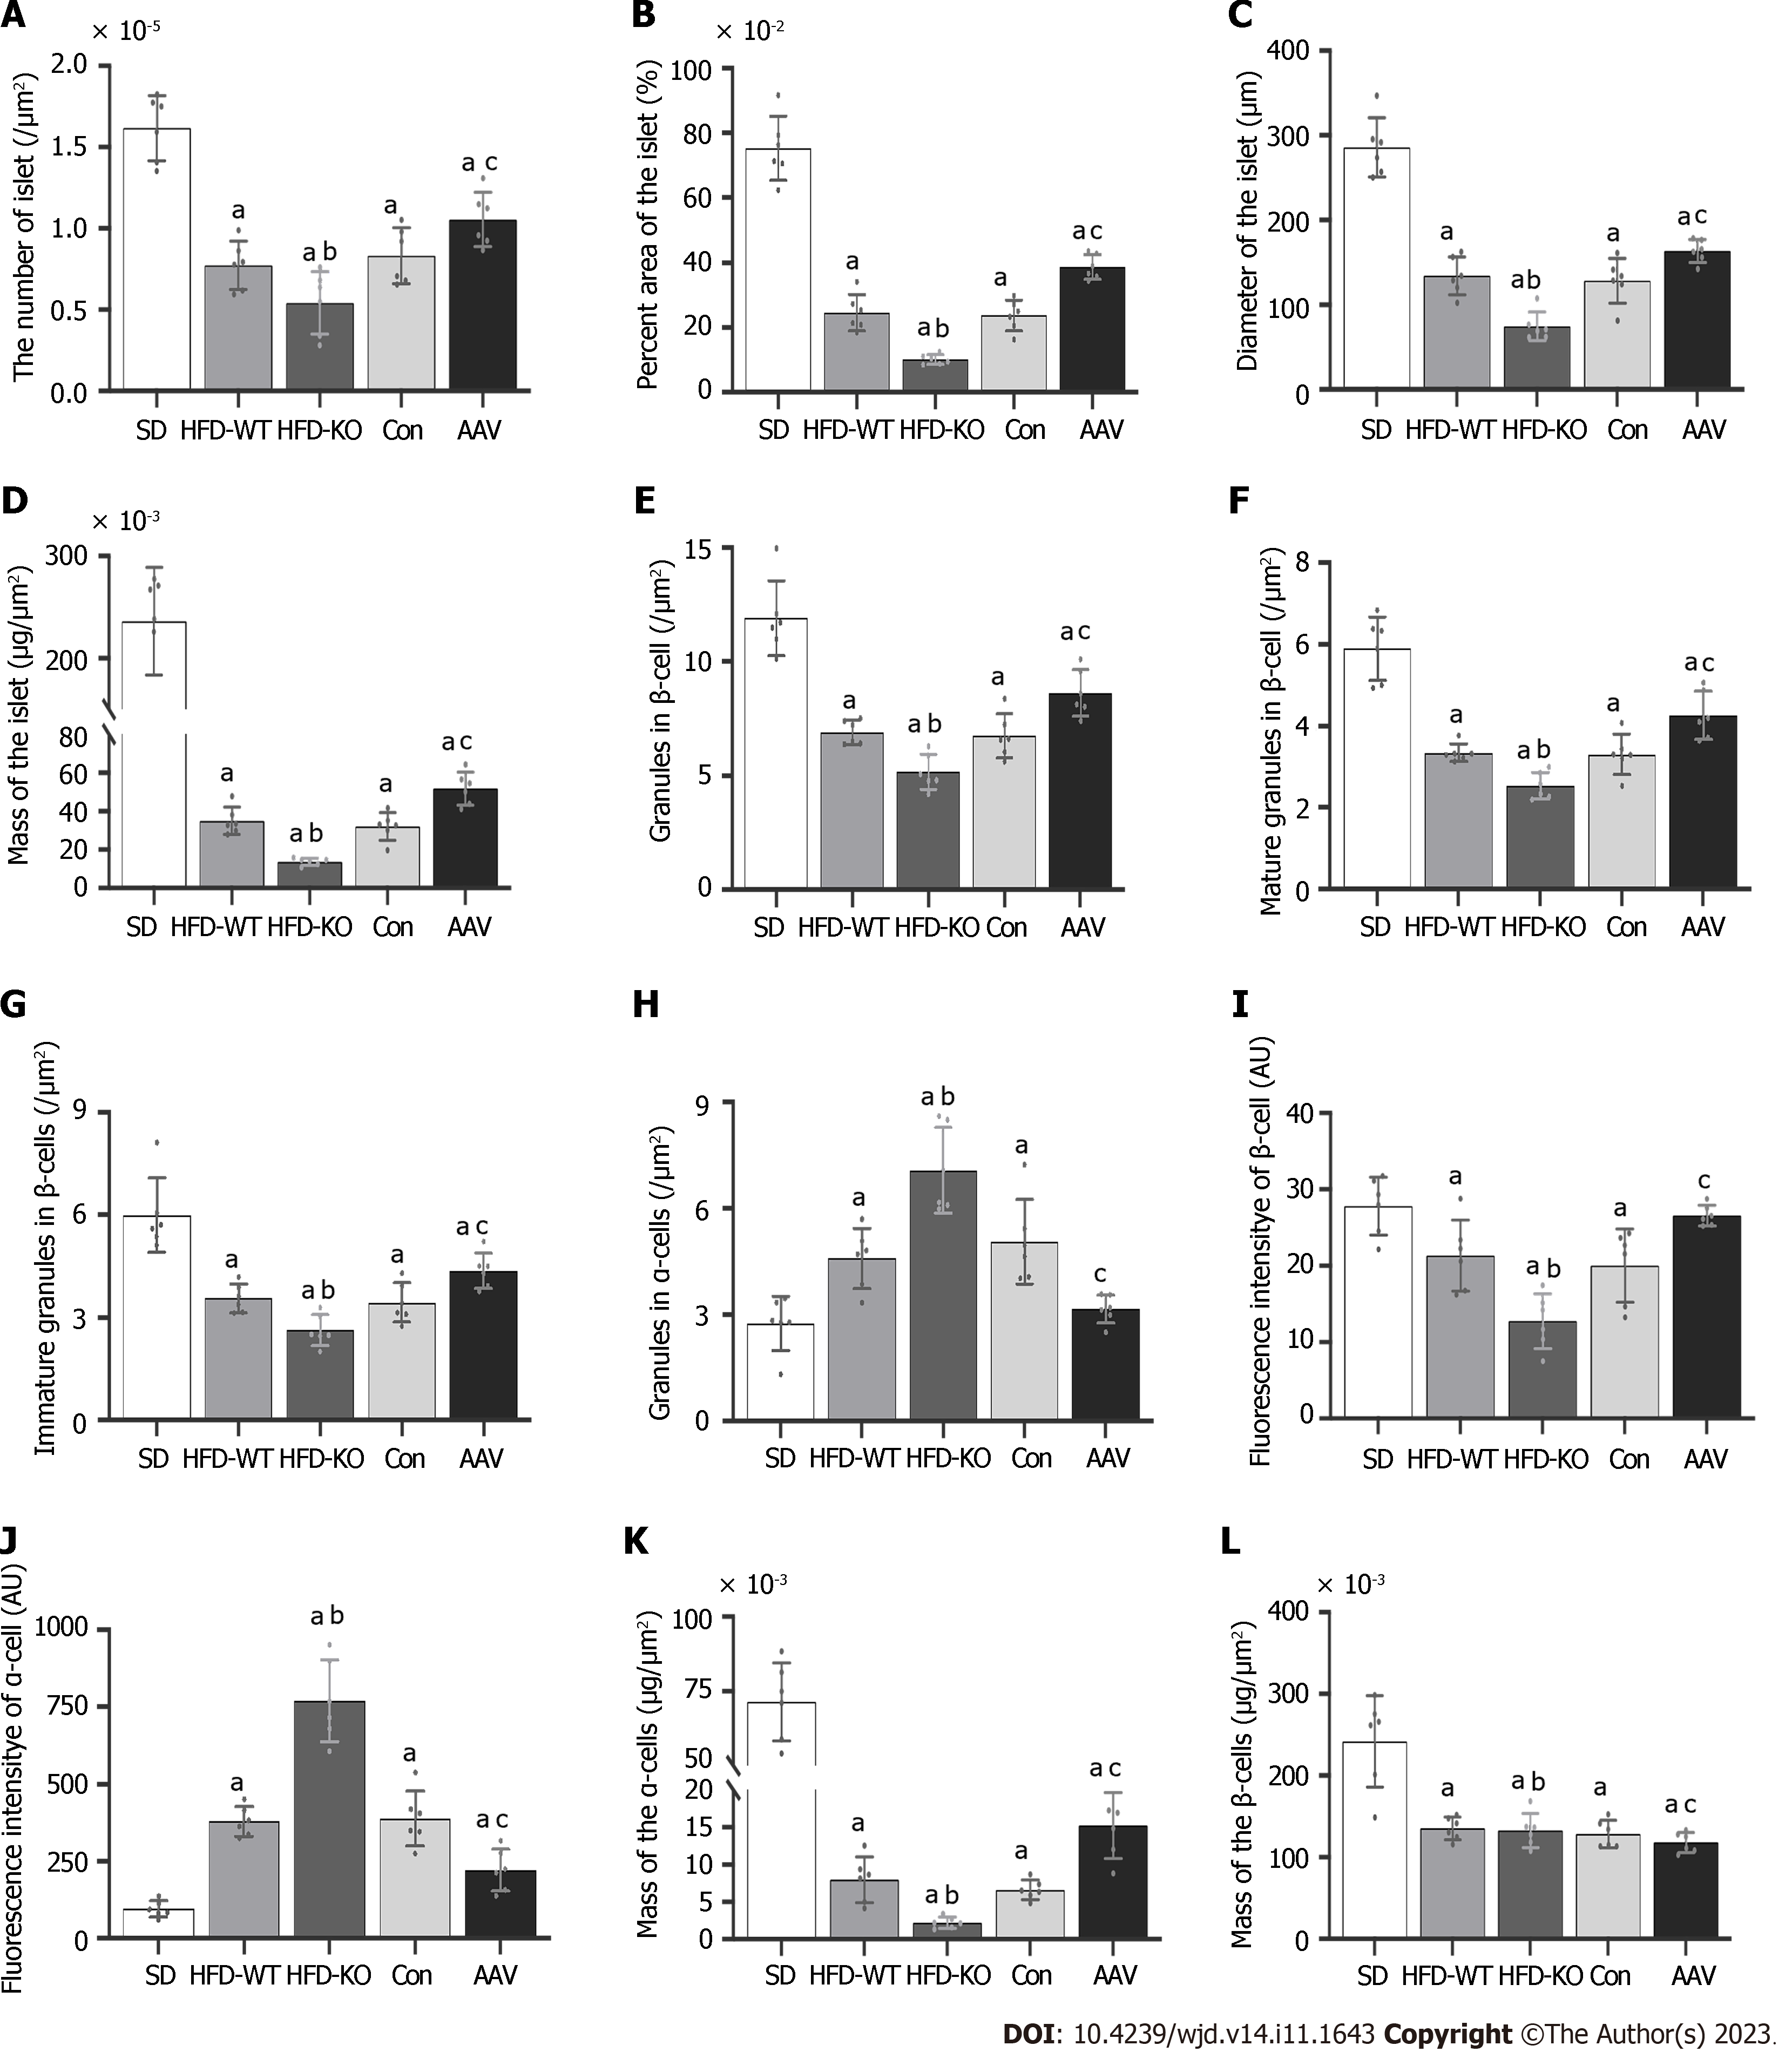
Figure 4 The quantitative analysis of vascular endothelial growth factor B affects the cellular structure of islets.
A: The number of islets; B: The relative area of the islet; C: Diameter of the islet; D: Mass of the islet; E: The number of granules in β cells; F: The number of mature granules in β cells; G: The number of immature granules in β cells; H: The number of granules in α cells; I: Mean fluorescence intensity of β cells; J: Mean fluorescence intensity of α cells; K: Mass of the β cells; L: Mass of the α cells. aP < 0.05 vs standard diet; bP < 0.05 vs high-fat diet-WT; cP < 0.05 vs Con. HFD: High-fat diet; AAV: Adeno-associated virus; SD: Standard diet.
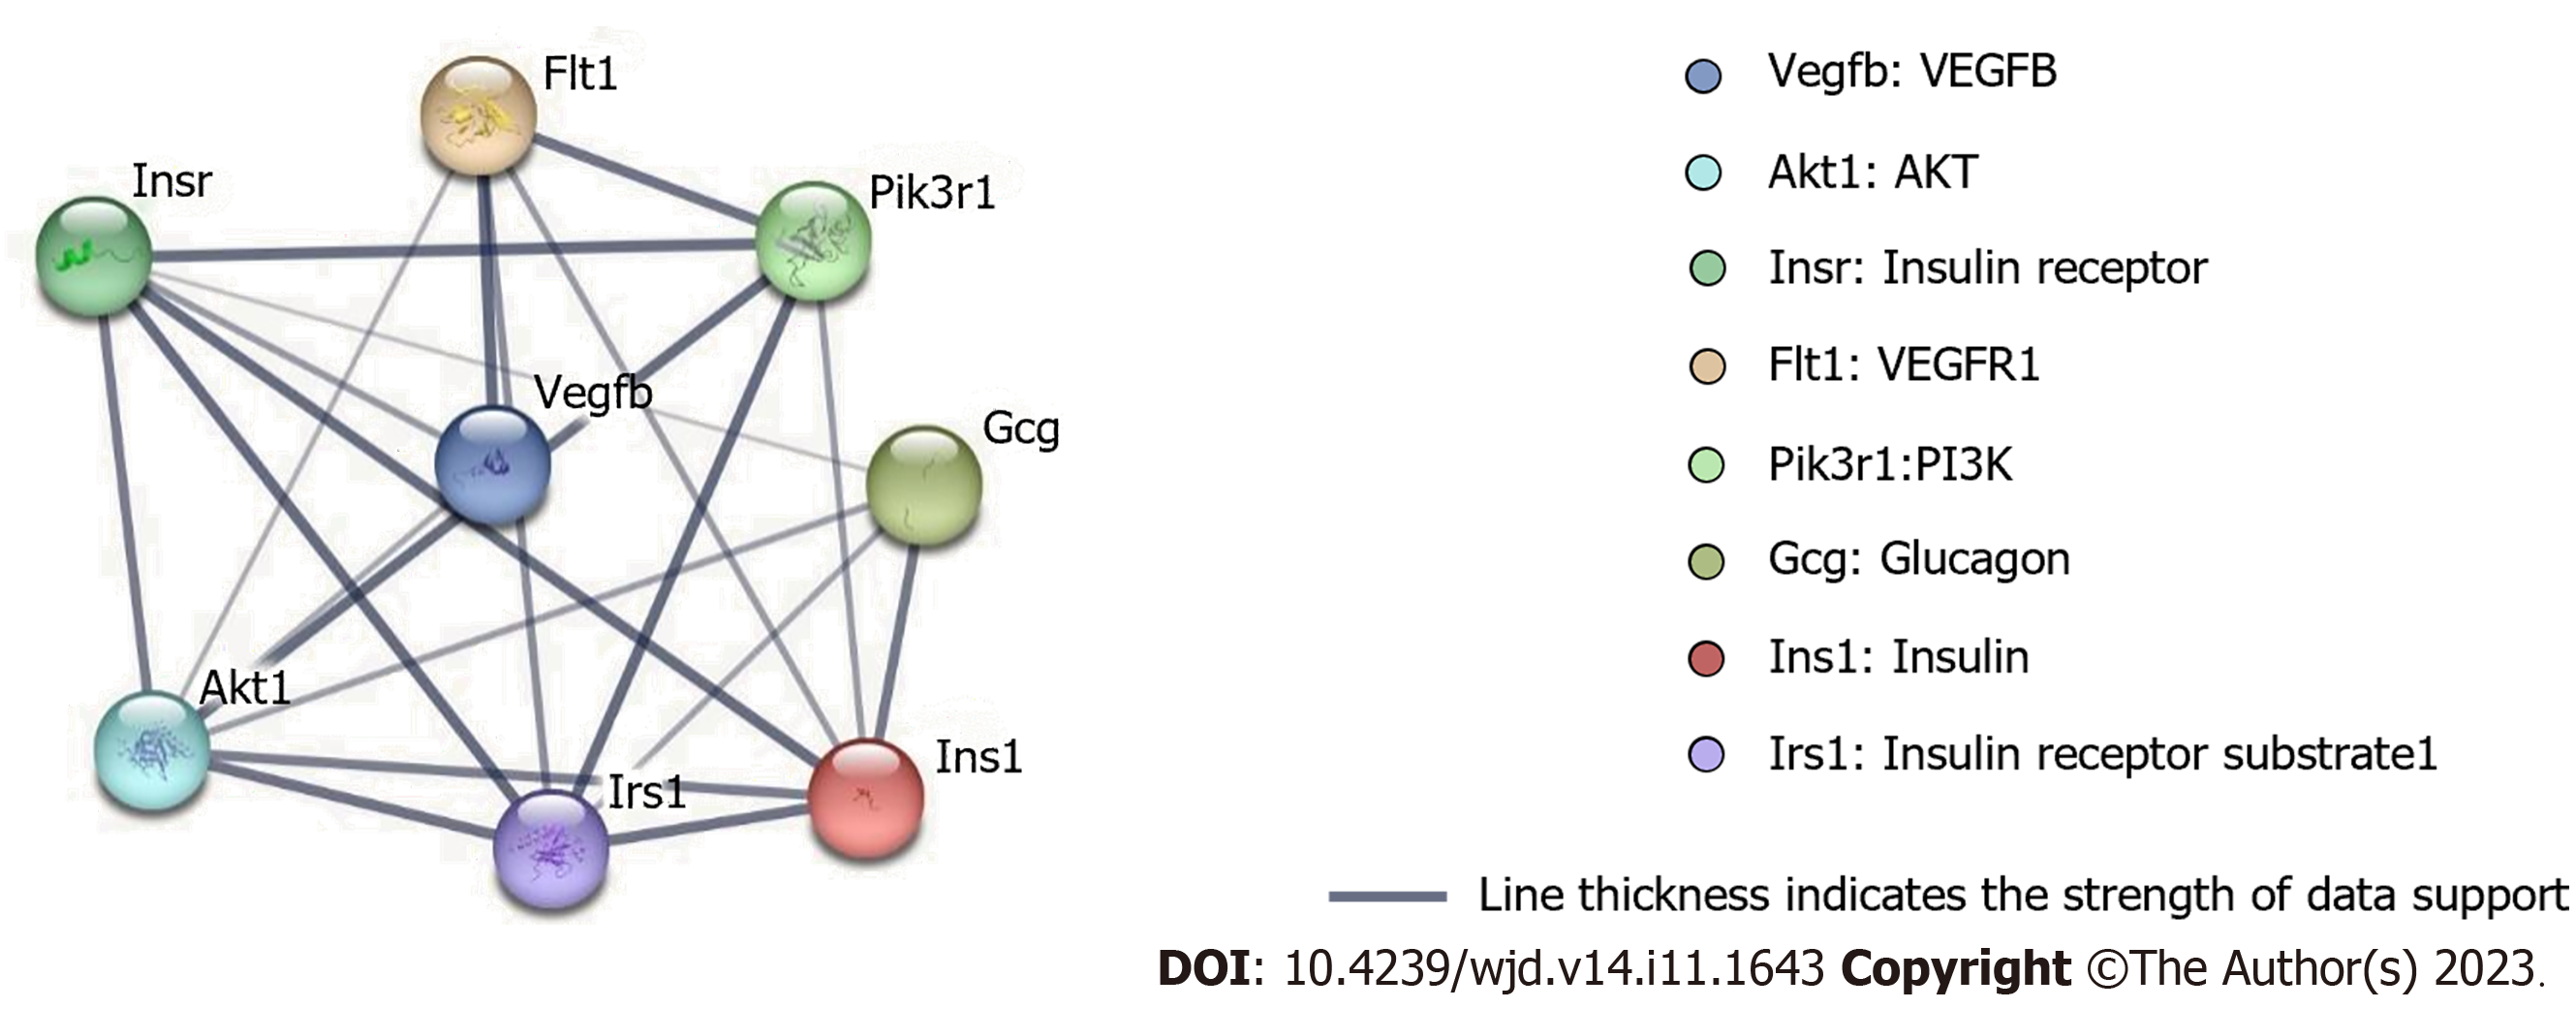
Figure 5 Cluster analysis of the protein-protein interaction network.
There were 8 nodes and 21 edges shown in the protein-protein interaction network. VEGF: Vascular endothelial growth factor.
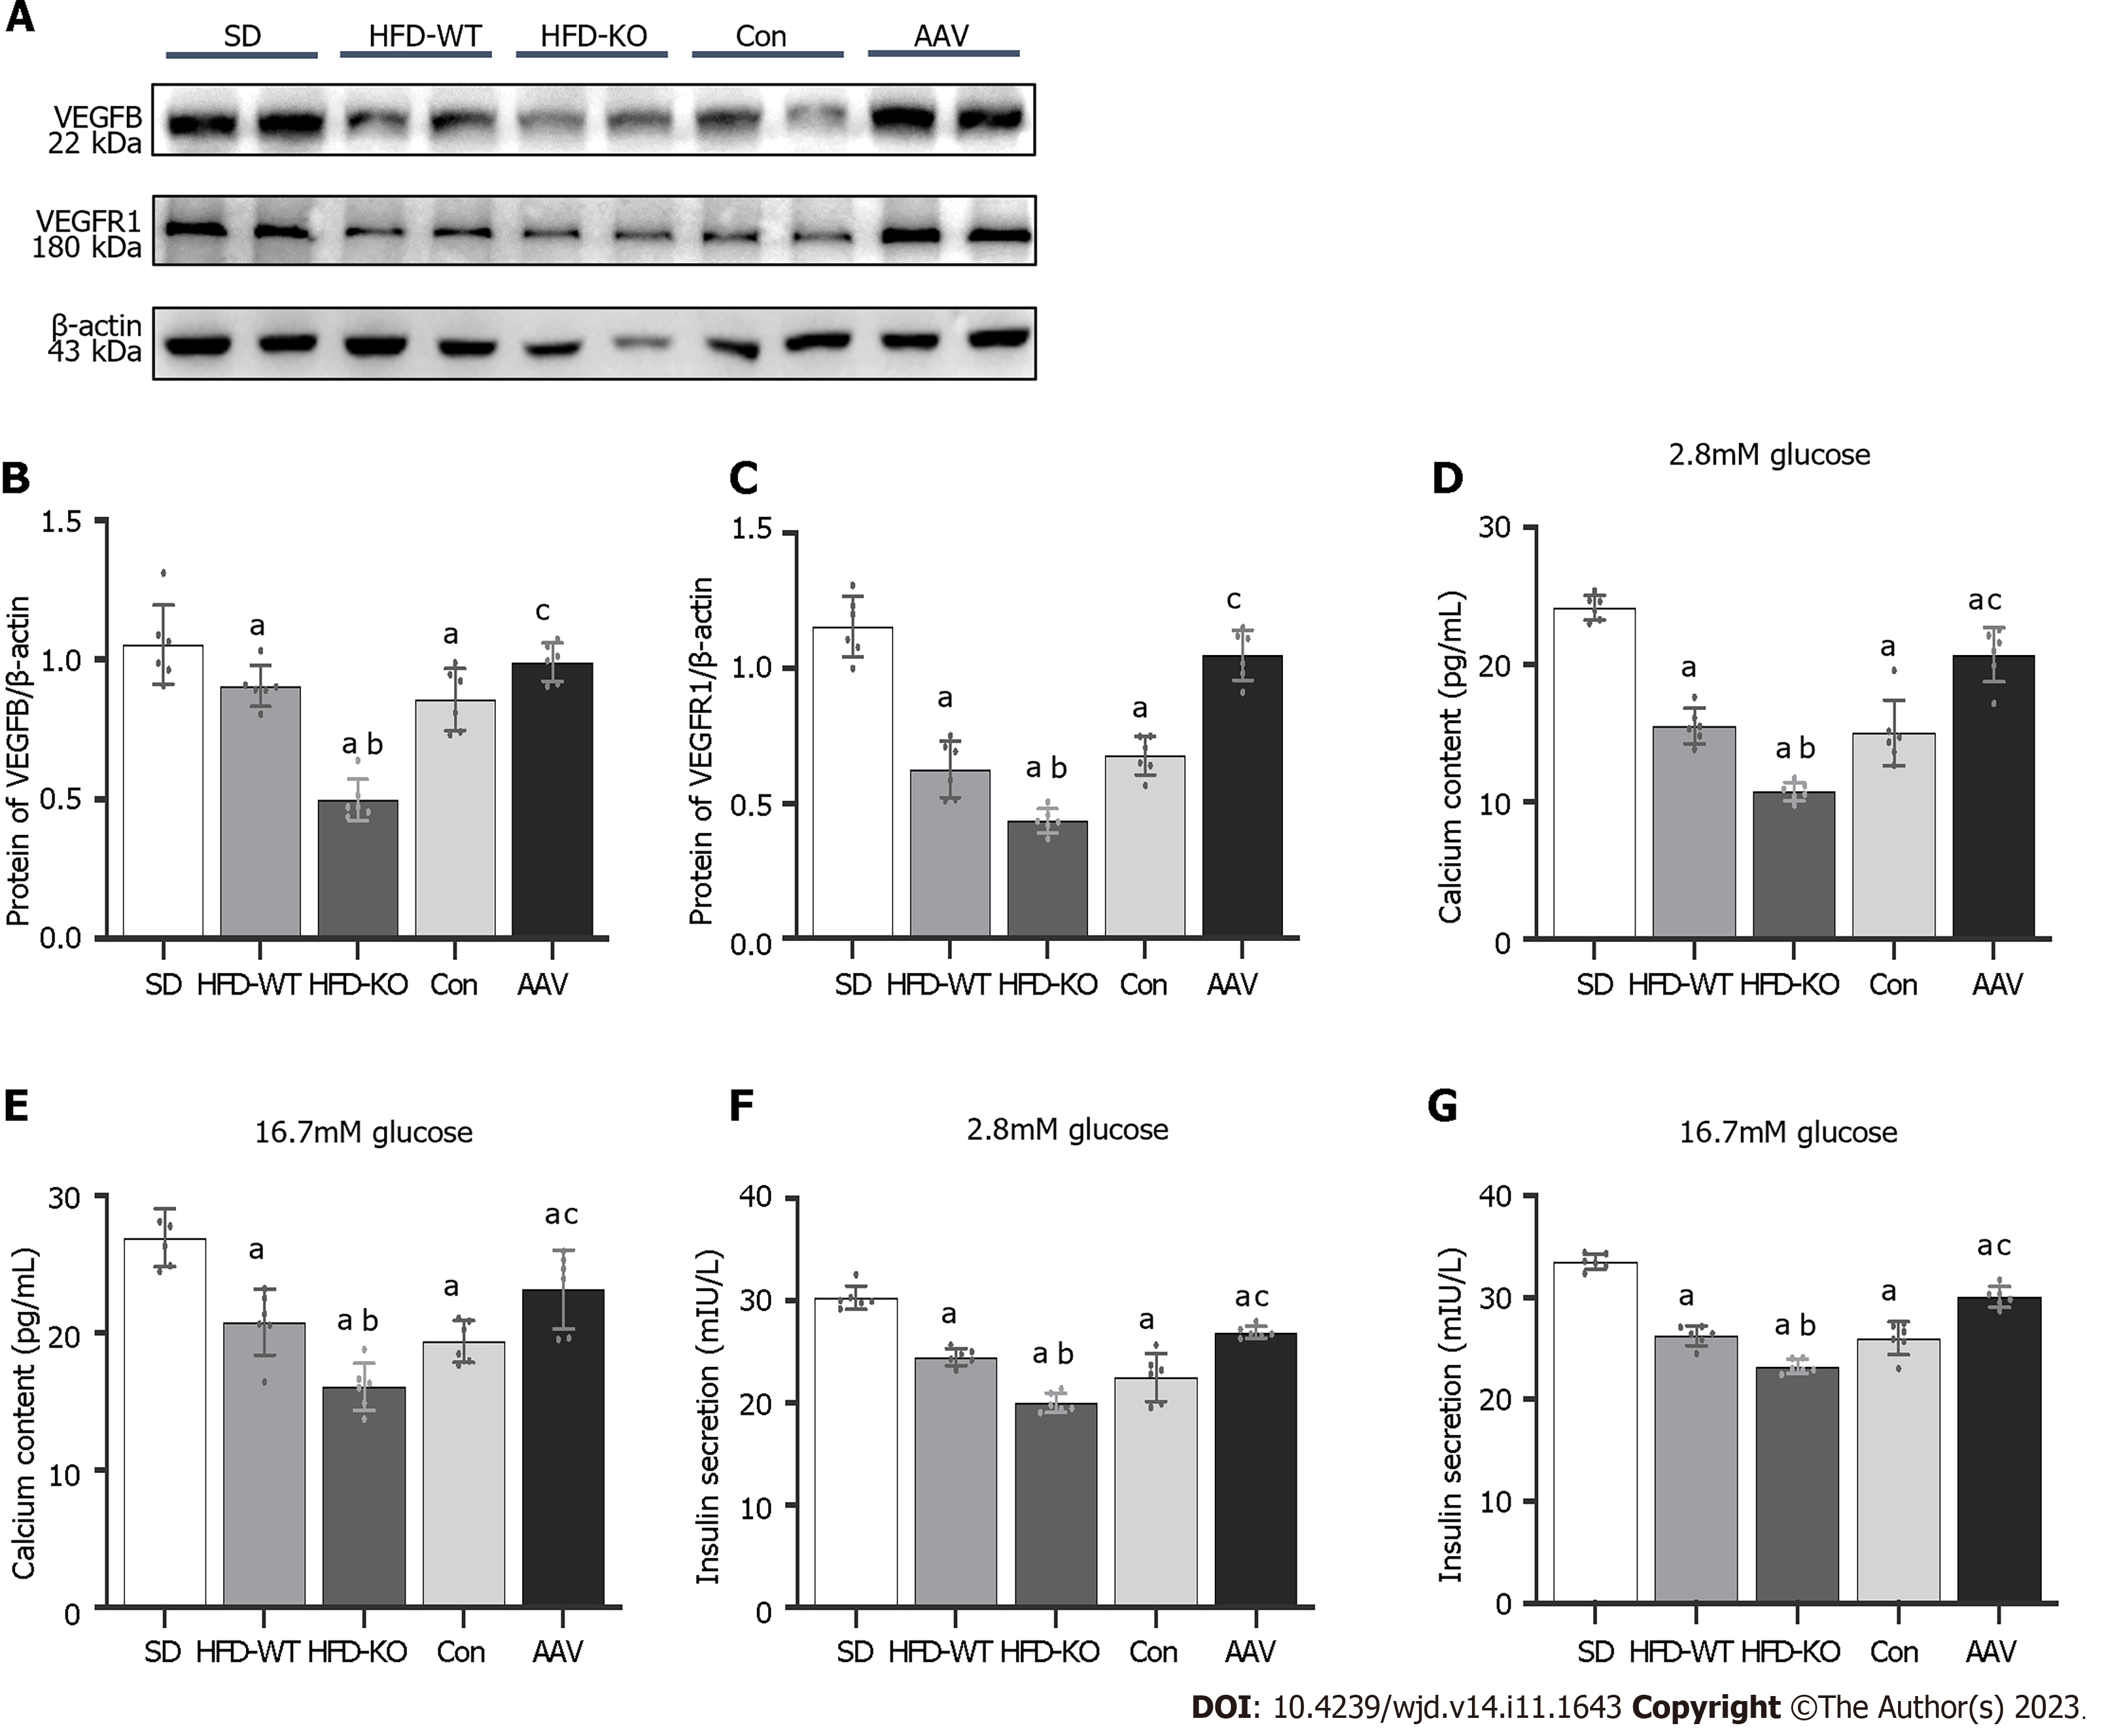
Figure 6 Vascular endothelial growth factor B regulates the content of Ca2+ and insulin via combining with vascular endothelial growth factor receptor 1.
A: The protein expression of vascular endothelial growth factor B (VEGFB); B: The protein expression of VEGFB/β-actin; C: The protein expression of VEGF receptor 1/β-actin; D and E: The content of Ca2+ with 2.8 mmol/L and 16.7 mmol/L glucose; F and G: The content of insulin with 2.8 mmol/L and 16.7 mmol/L glucose. aP < 0.05 vs standard diet. bP < 0.05 vs high-fat diet-WT; cP < 0.05 vs Con. HFD: High-fat diet; AAV: Adeno-associated virus; SD: Standard diet.
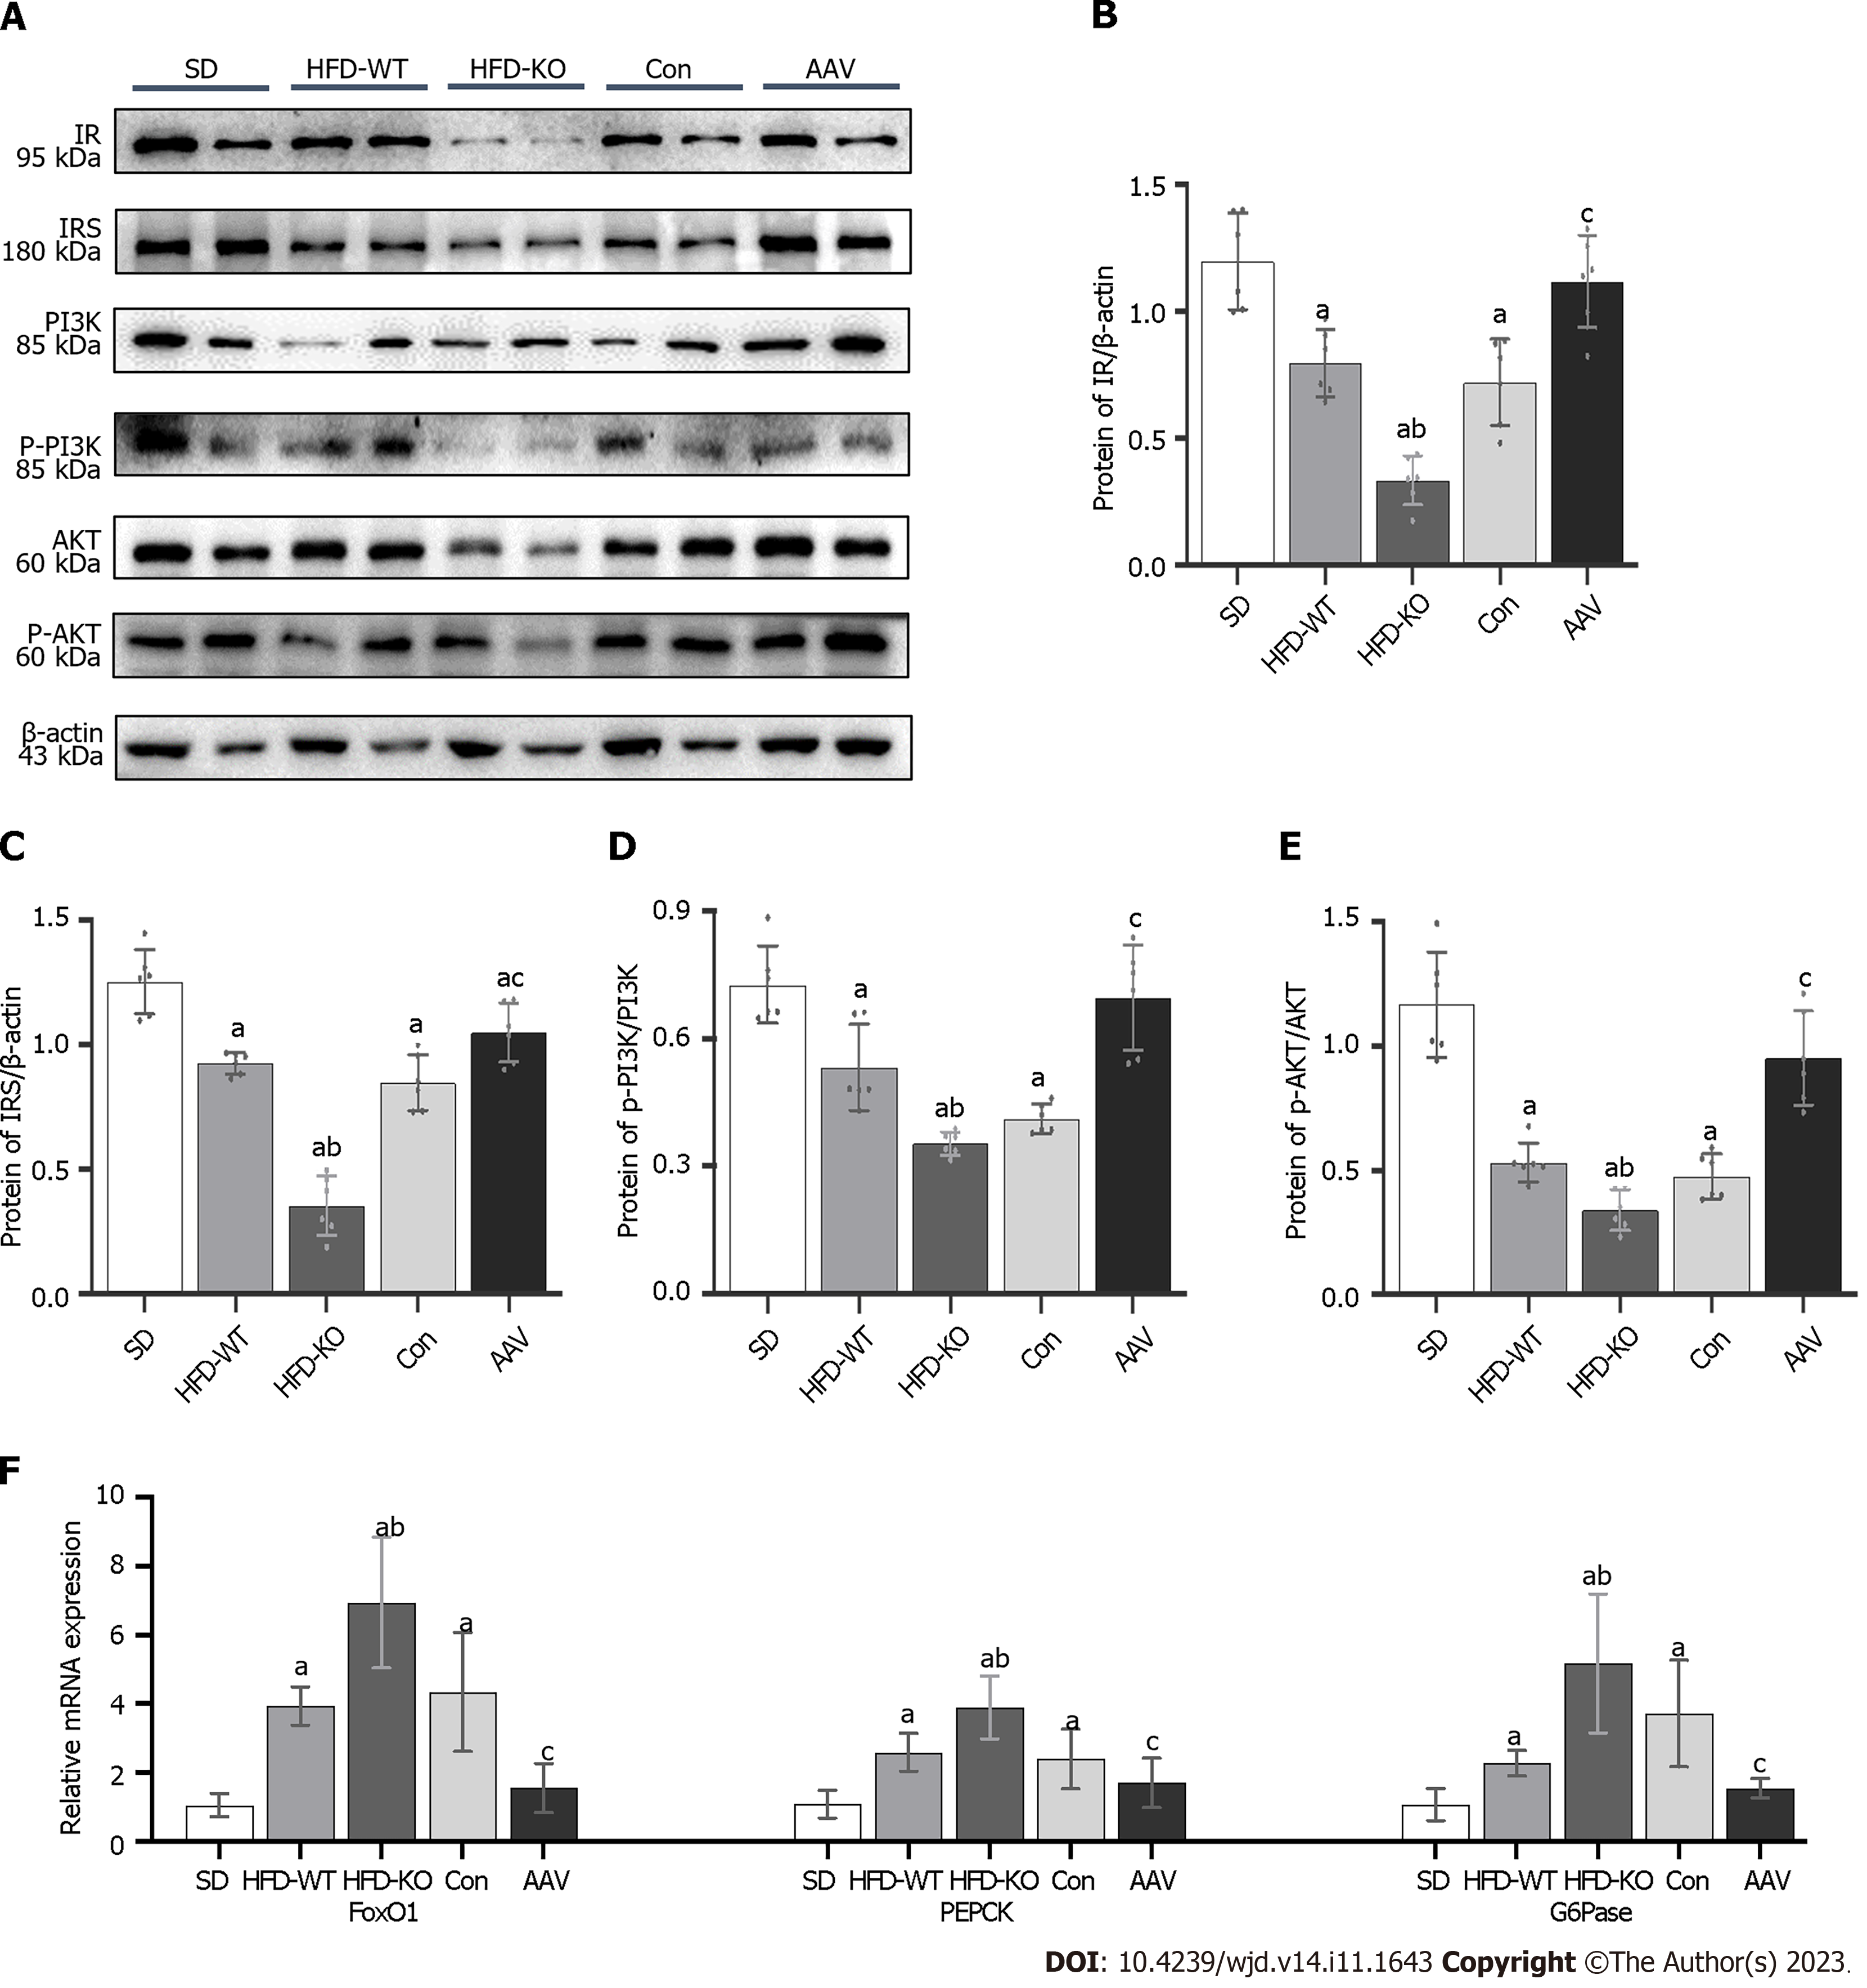
Figure 7 Vascular endothelial growth factor B regulates glucagon secretion via PI3K/AKT signal pathway and relative genes.
A: The protein expression of IR, insulin resistance substrate (IRS), PI3K, p-PI3K, AKT, and p-AKT; B: The protein expression of IR/β-actin; C: The protein expression of IRS/β-actin; D: The protein expression of p-PI3K/PI3K; E: The protein expression of p-AKT/AKT; F: The mRNA expression of forkhead box protein O1, PEPCK, and G6Pase. aP < 0.05 vs standard diet; bP < 0.05 vs high-fat diet-WT; cP < 0.05 vs Con. HFD: High-fat diet; AAV: Adeno-associated virus; SD: Standard diet; IRS: Insulin resistance substrate; FOXO: Forkhead box protein O1.
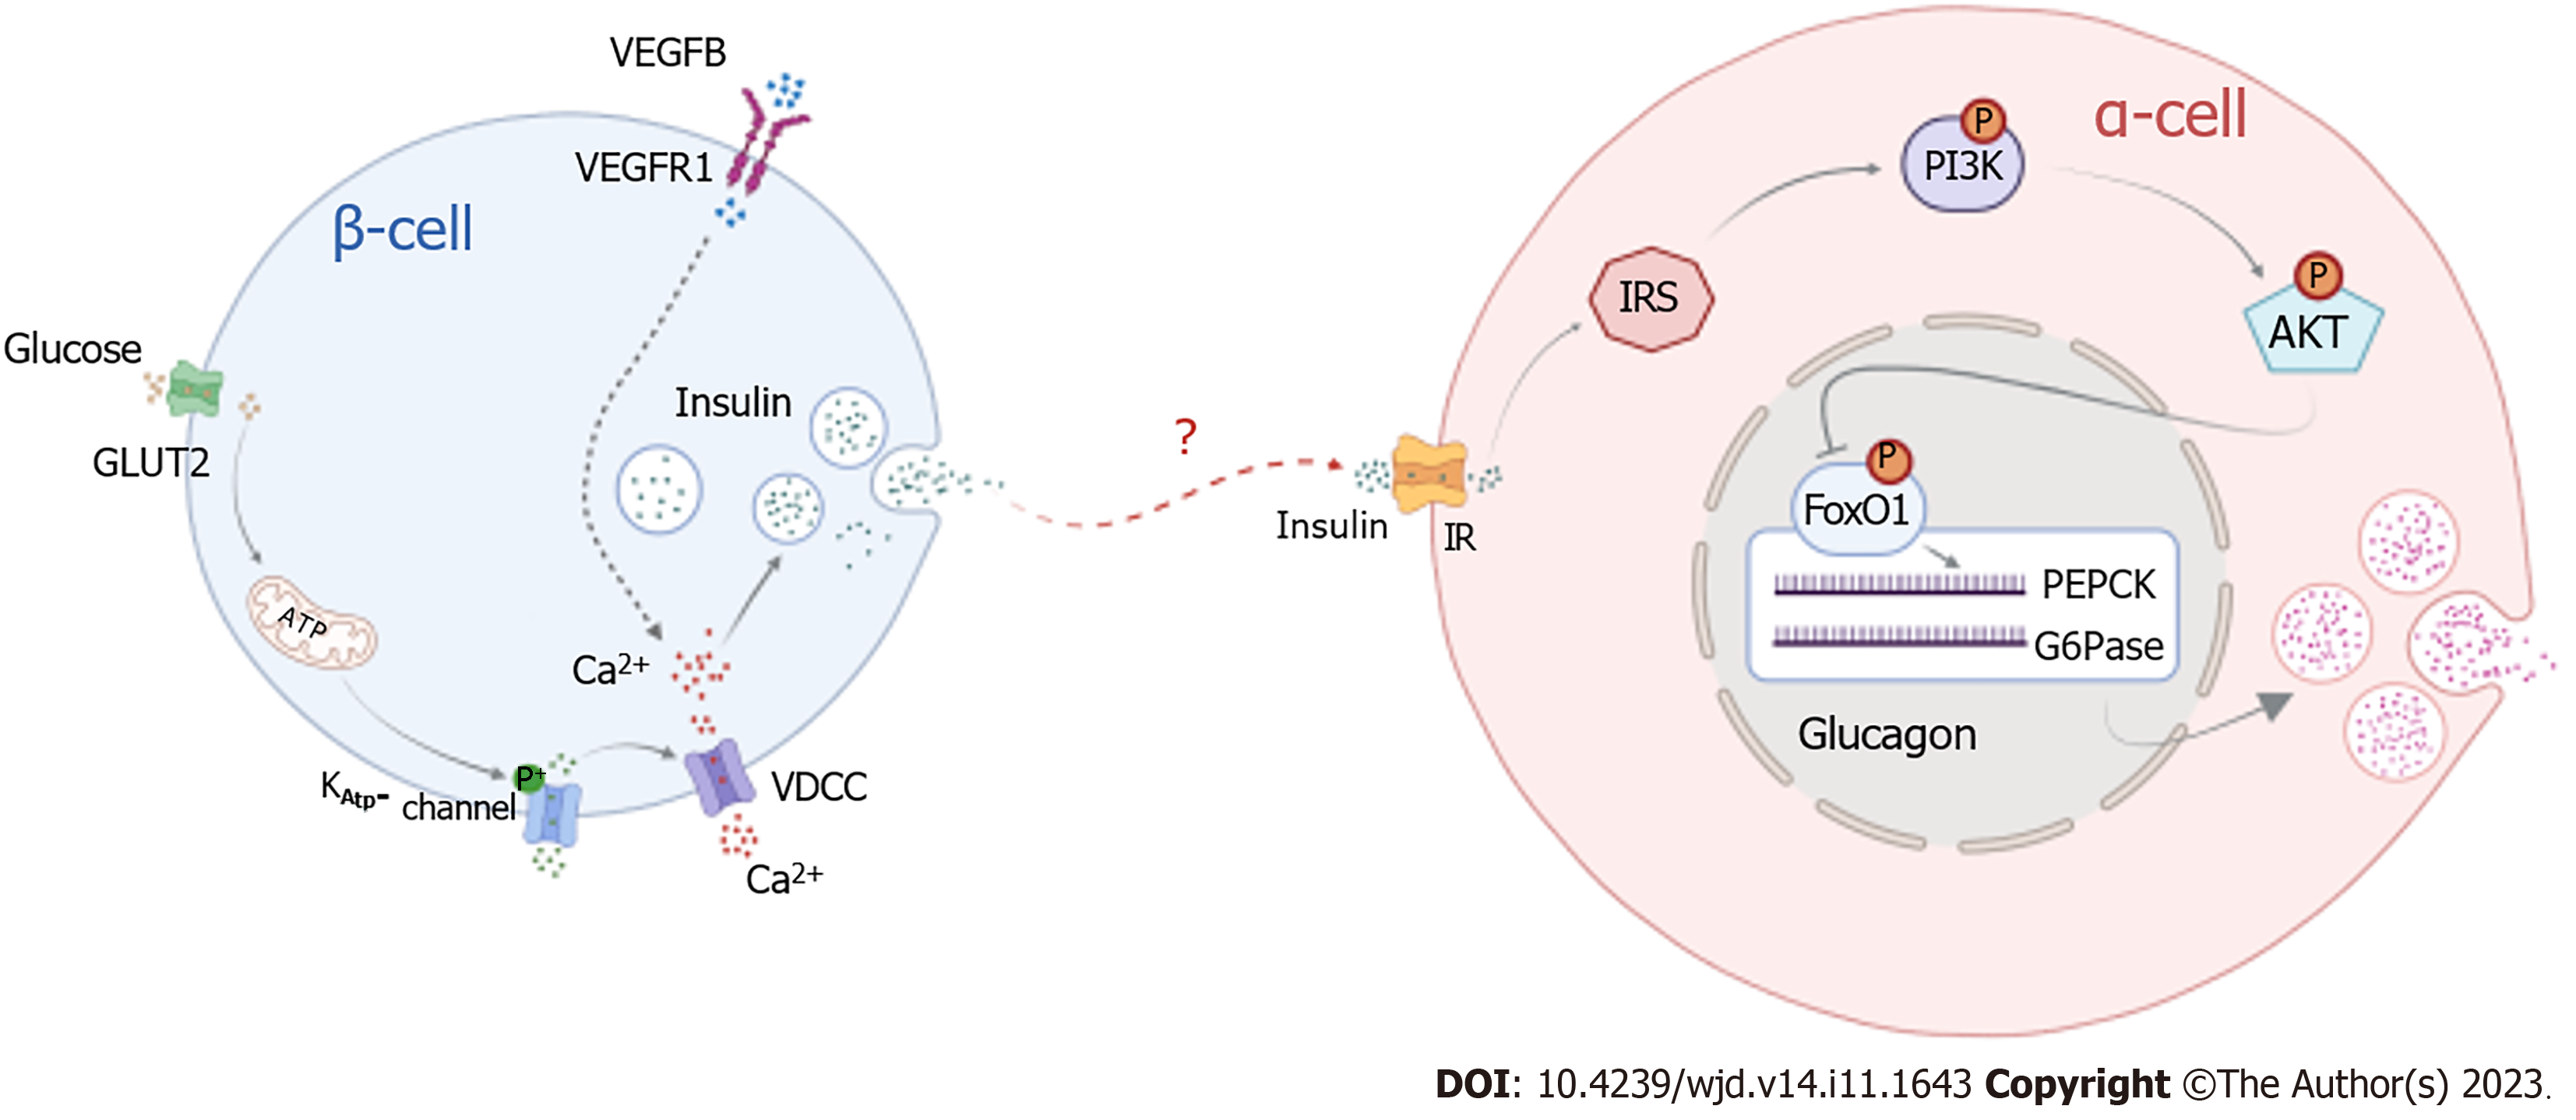
Figure 8 Pattern diagram of vascular endothelial growth factor B regulates insulin-medicated glucagon secretion through PI3K/AKT signal pathway.
IRS: Insulin resistance substrate; VEGF: Vascular endothelial growth factor; VDCC: Voltage dependent calcium channels.
- Citation: Li YQ, Zhang LY, Zhao YC, Xu F, Hu ZY, Wu QH, Li WH, Li YN. Vascular endothelial growth factor B improves impaired glucose tolerance through insulin-mediated inhibition of glucagon secretion. World J Diabetes 2023; 14(11): 1643-1658
- URL: https://www.wjgnet.com/1948-9358/full/v14/i11/1643.htm
- DOI: https://dx.doi.org/10.4239/wjd.v14.i11.1643


