Copyright
©The Author(s) 2023.
World J Diabetes. Oct 15, 2023; 14(10): 1541-1550
Published online Oct 15, 2023. doi: 10.4239/wjd.v14.i10.1541
Published online Oct 15, 2023. doi: 10.4239/wjd.v14.i10.1541
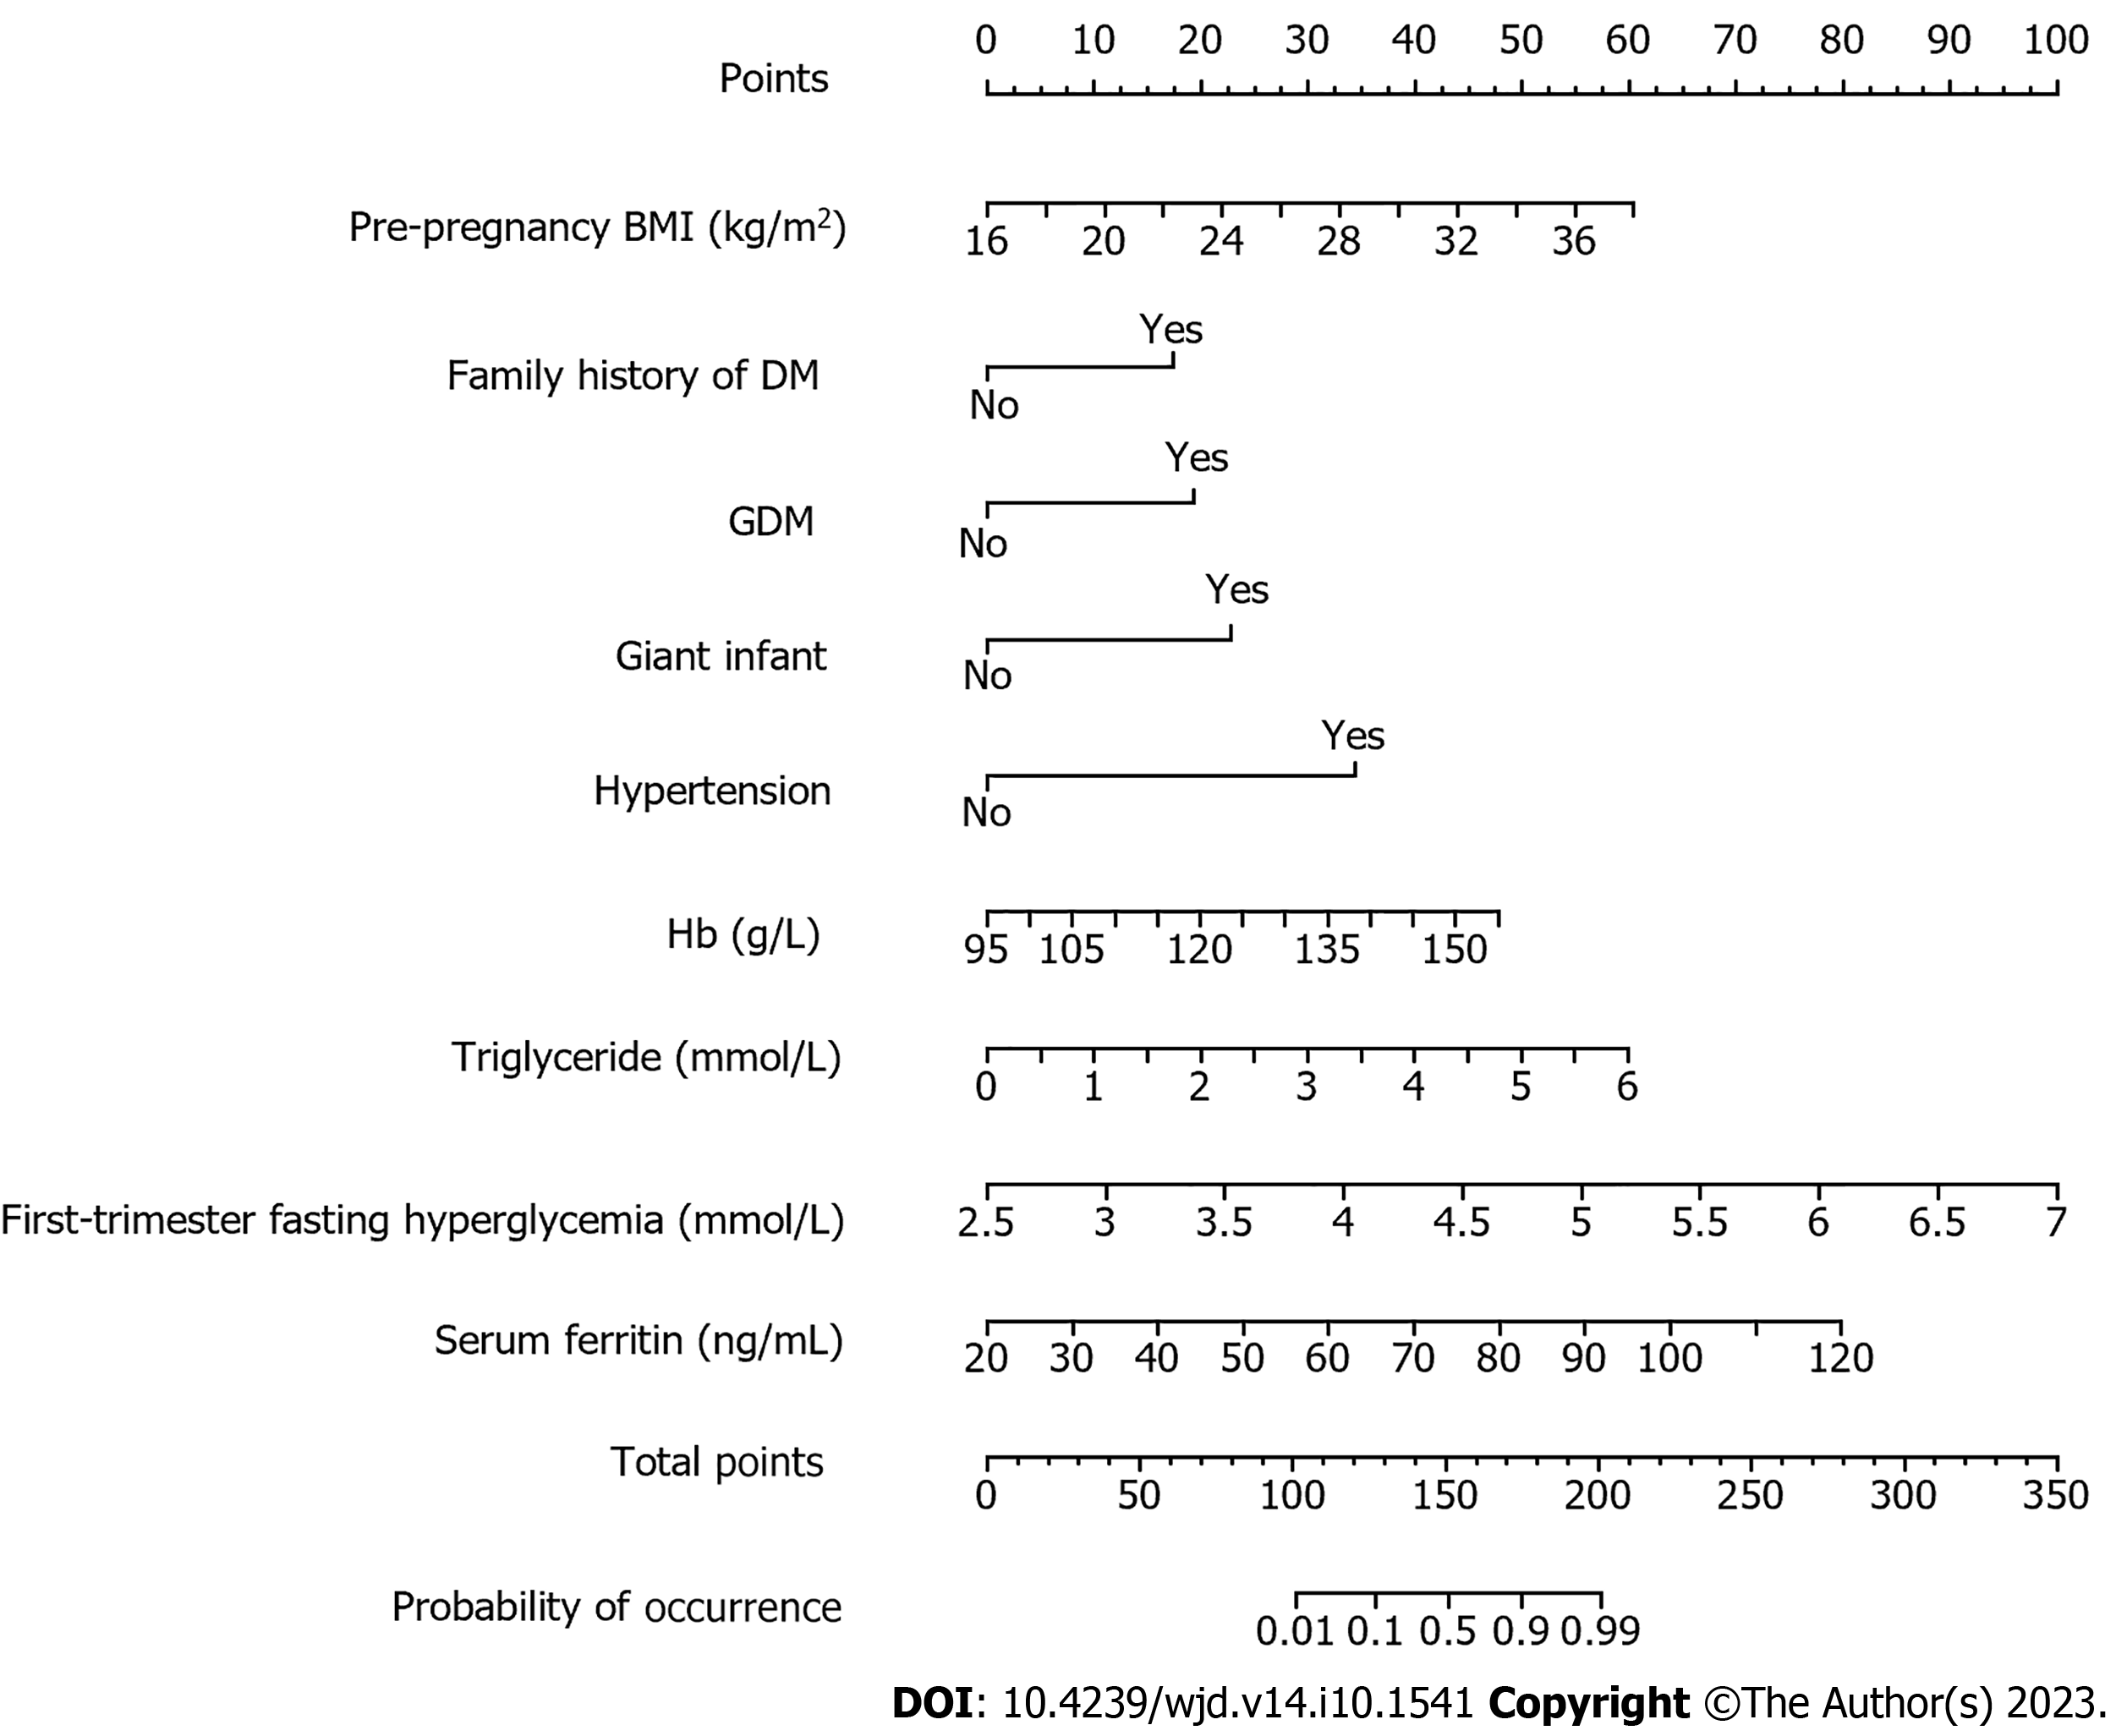
Figure 1 Risk prediction nomogram model of gestational diabetes mellitus.
BMI: Body mass index; DM: Diabetes mellitus; GDM: Gestational diabetes mellitus; Hb: Hemoglobin.
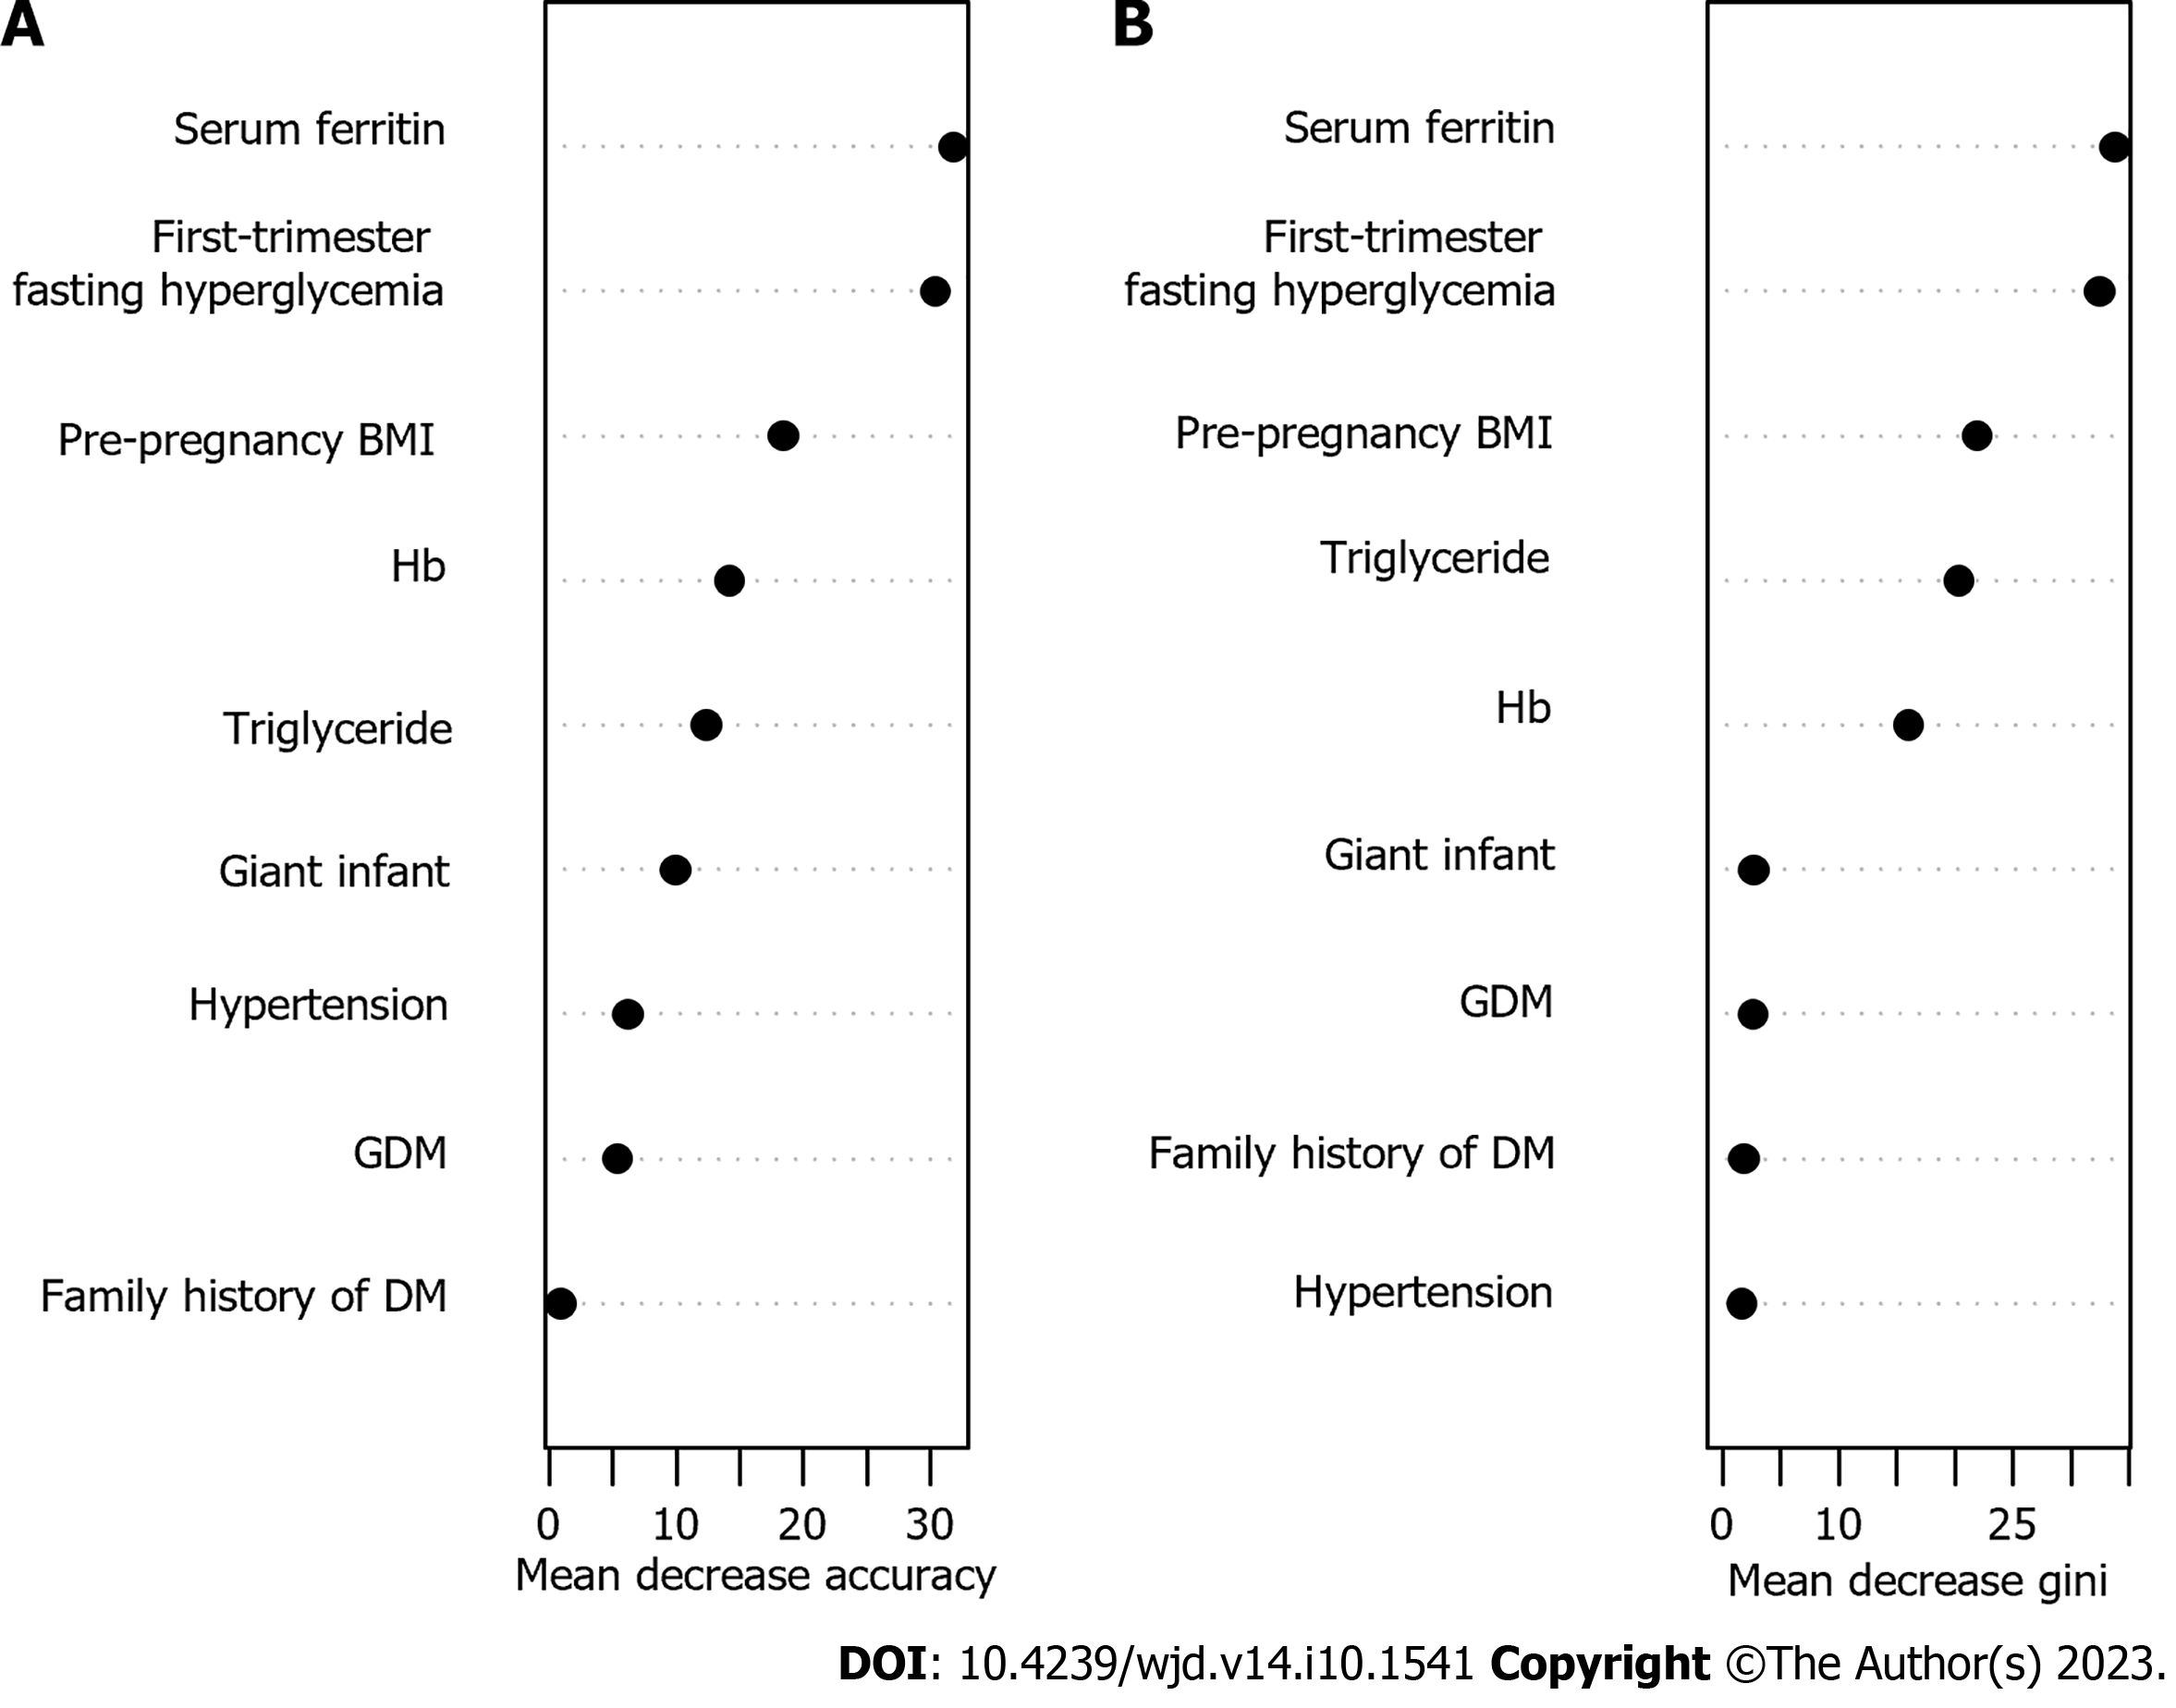
Figure 2 Variable importance analysis of random forest model.
A: The diagram shows that the value of each variable was changed into a random number, and the random forest also measured the degree of reduction in accuracy; B: The importance of each variable was compared by calculating the heterogeneous influence of each variable on the observations on each node of the classification tree. The larger the value, the greater the importance of the variable. BMI: Body mass index; DM: Diabetes mellitus; GDM: Gestational diabetes mellitus; Hb: Hemoglobin.
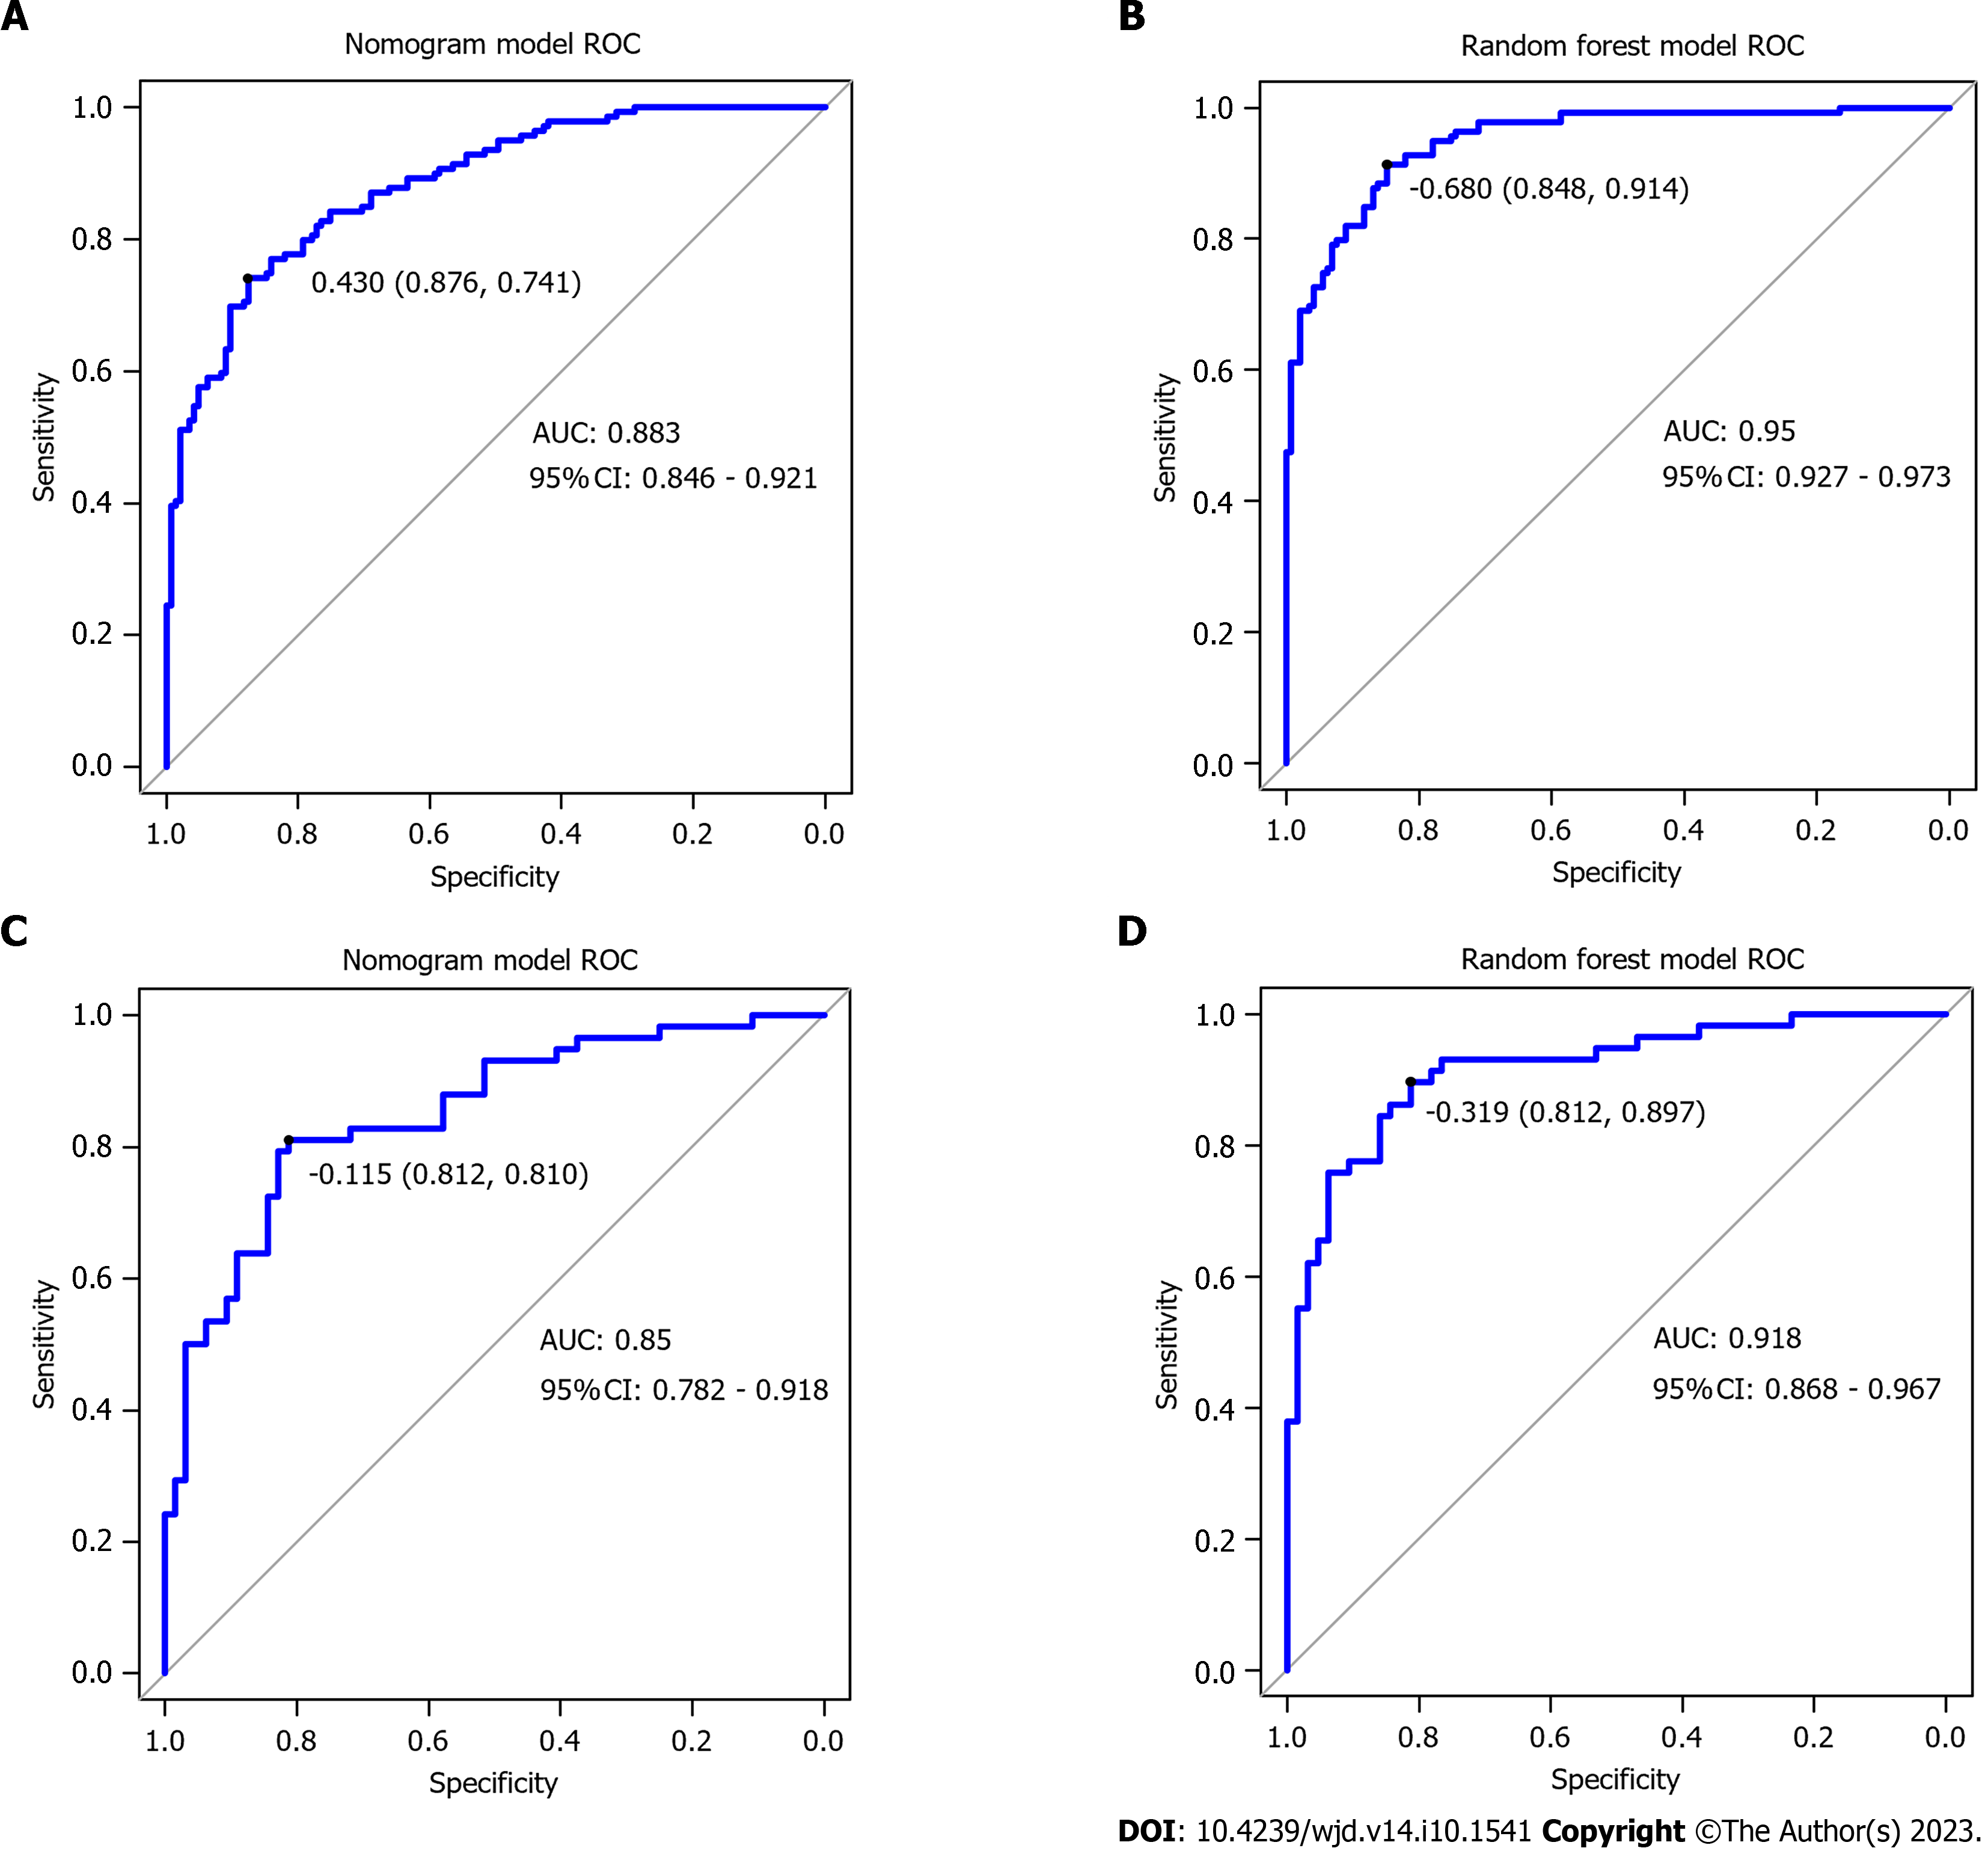
Figure 3 Receiver operating characteristic curve of the two models for predicting gestational diabetes mellitus.
A: The figure shows the receiver operating characteristic curve (ROC) curve of the training set nomogram; B: The figure shows the ROC curve of the training set random forest model; C: The figure shows the ROC curve of the validation set line graph; D: The figure shows the ROC curve of the validation set random forest model. ROC: Receiver operating characteristic curve; AUC: Area under the curve.
- Citation: Lin Q, Fang ZJ. Establishment and evaluation of a risk prediction model for gestational diabetes mellitus. World J Diabetes 2023; 14(10): 1541-1550
- URL: https://www.wjgnet.com/1948-9358/full/v14/i10/1541.htm
- DOI: https://dx.doi.org/10.4239/wjd.v14.i10.1541


