Copyright
©The Author(s) 2023.
World J Diabetes. Oct 15, 2023; 14(10): 1532-1540
Published online Oct 15, 2023. doi: 10.4239/wjd.v14.i10.1532
Published online Oct 15, 2023. doi: 10.4239/wjd.v14.i10.1532
Figure 1 Changes in blood-glucose-related indexes before and after treatment.
A: Comparison of fasting blood glucose changes before and after treatment; B: Comparison of 2-h postprandial glucose changes before and after treatment; C: Comparison of glycosylated hemoglobin changes before and after treatment. aP < 0.01; bP < 0.0001. FBG: Fasting blood glucose; 2h PG: 2-h postprandial glucose; HbA1c: Hemoglobin.
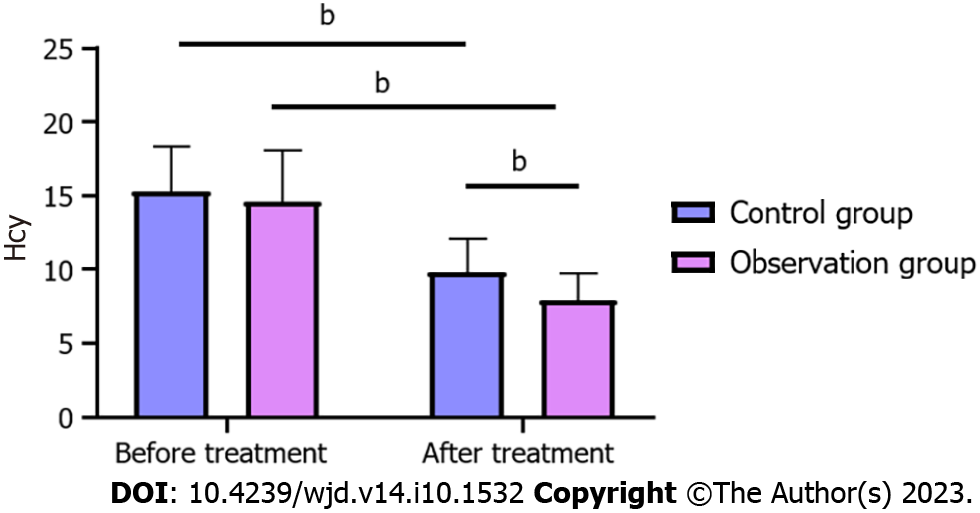
Figure 2 Changes of homocysteine before and after treatment.
bP < 0.0001. Hcy: Homocysteine.
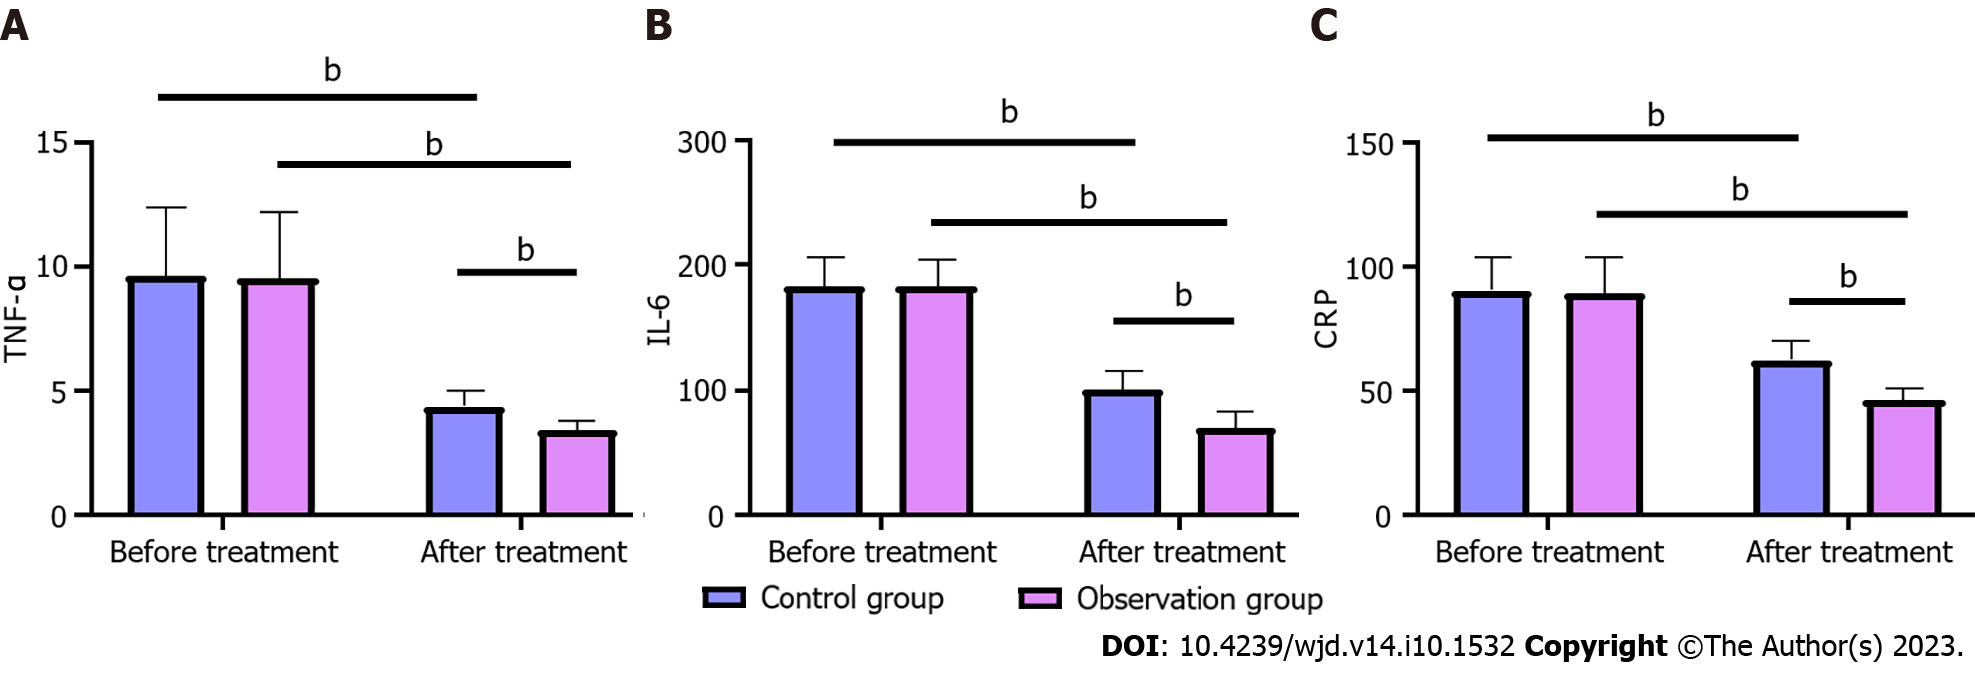
Figure 3 Changes in serum inflammatory cytokines before and after treatment.
A: Comparison of tumor necrosis factor-α changes before and after treatment; B: Comparison of interleukin-6 changes before and after treatment; C: Comparison of C-reactive protein changes before and after treatment. bP < 0.0001. TNF-α: Tumor necrosis factor-α; IL-6: Interleukin-6; CRP: C-reactive protein.
- Citation: Wang Y, Song M, Qi BR. Effects of insulin aspart and metformin on gestational diabetes mellitus and inflammatory markers. World J Diabetes 2023; 14(10): 1532-1540
- URL: https://www.wjgnet.com/1948-9358/full/v14/i10/1532.htm
- DOI: https://dx.doi.org/10.4239/wjd.v14.i10.1532


