Copyright
©The Author(s) 2023.
World J Diabetes. Jan 15, 2023; 14(1): 48-61
Published online Jan 15, 2023. doi: 10.4239/wjd.v14.i1.48
Published online Jan 15, 2023. doi: 10.4239/wjd.v14.i1.48
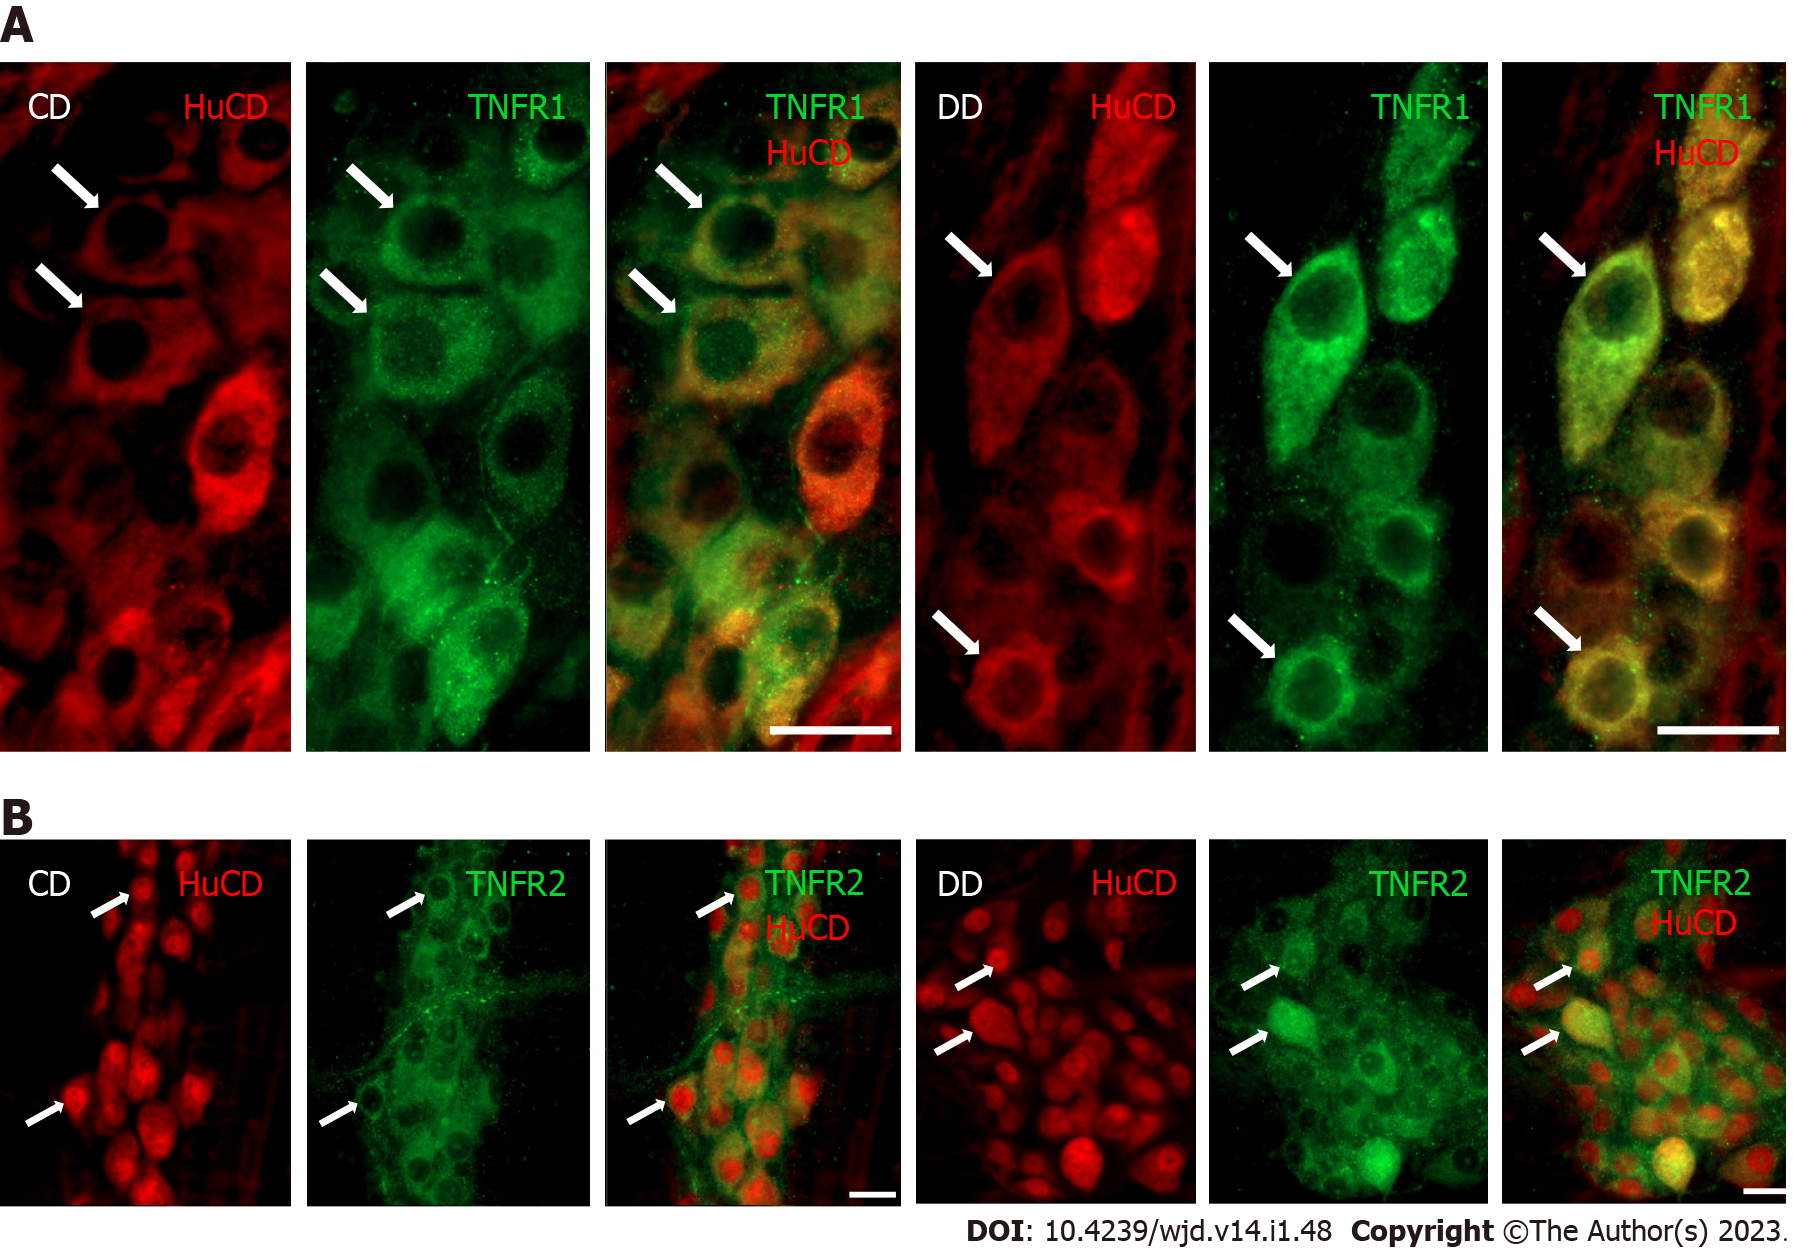
Figure 1 Representative fluorescent micrographs of whole-mount preparations of myenteric ganglia from the duodenum of a control and a diabetic rat after TNFR1-HuCD or TNFR2-HuCD double-labeling immunohistochemistry.
HuCD as a pan-neuronal marker was applied to label myenteric neurons. A: TNFR1-HuCD; B: TNFR2-HuCD. Arrows indicate myenteric neurons. Scale bar: 20 μm. CD: Control duodenum; DD: Diabetic duodenum.
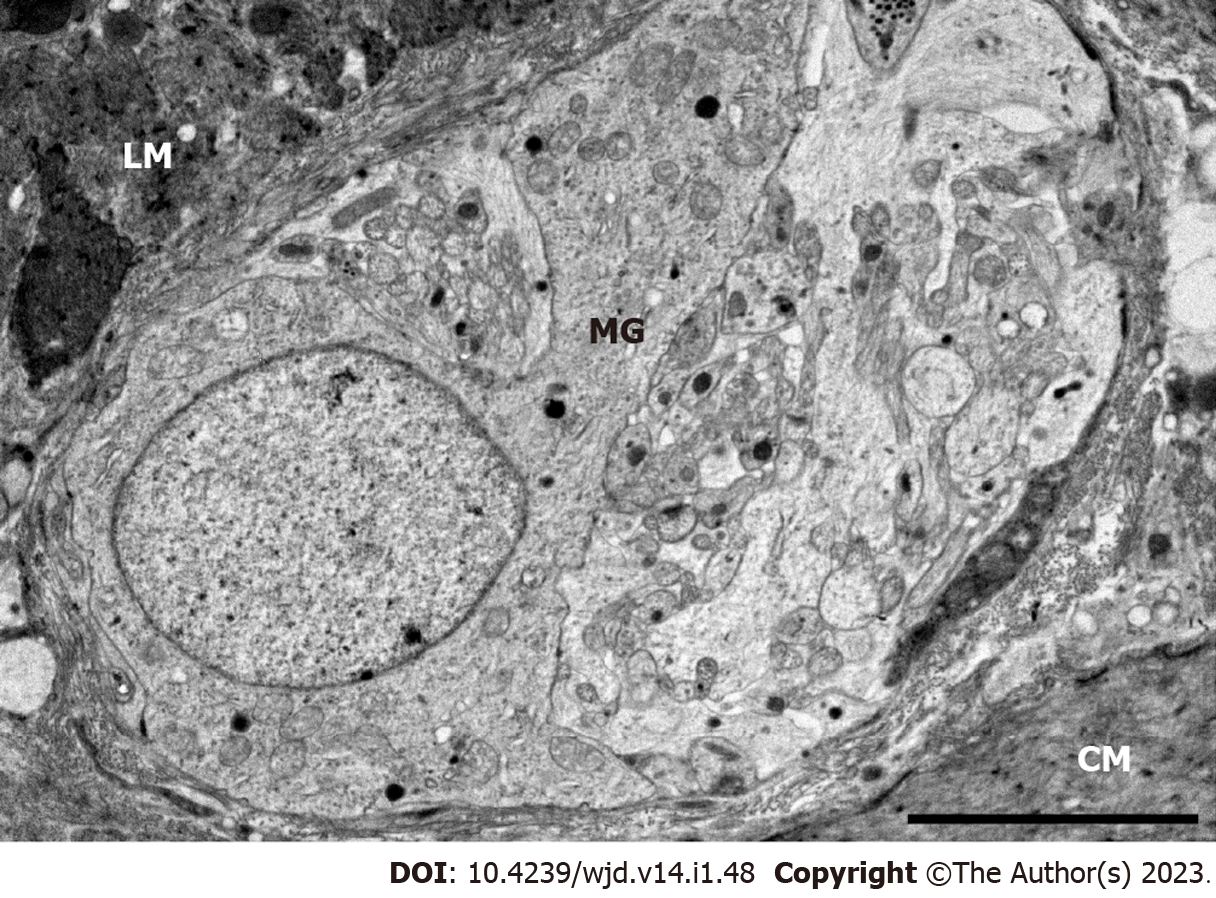
Figure 2 Representative electron micrograph of myenteric ganglia from the duodenum of a control rat.
Scale bar: 5 μm. MG: Myenteric ganglia; LM: Longitudinal smooth muscle layer; CM: Circular smooth muscle layer.
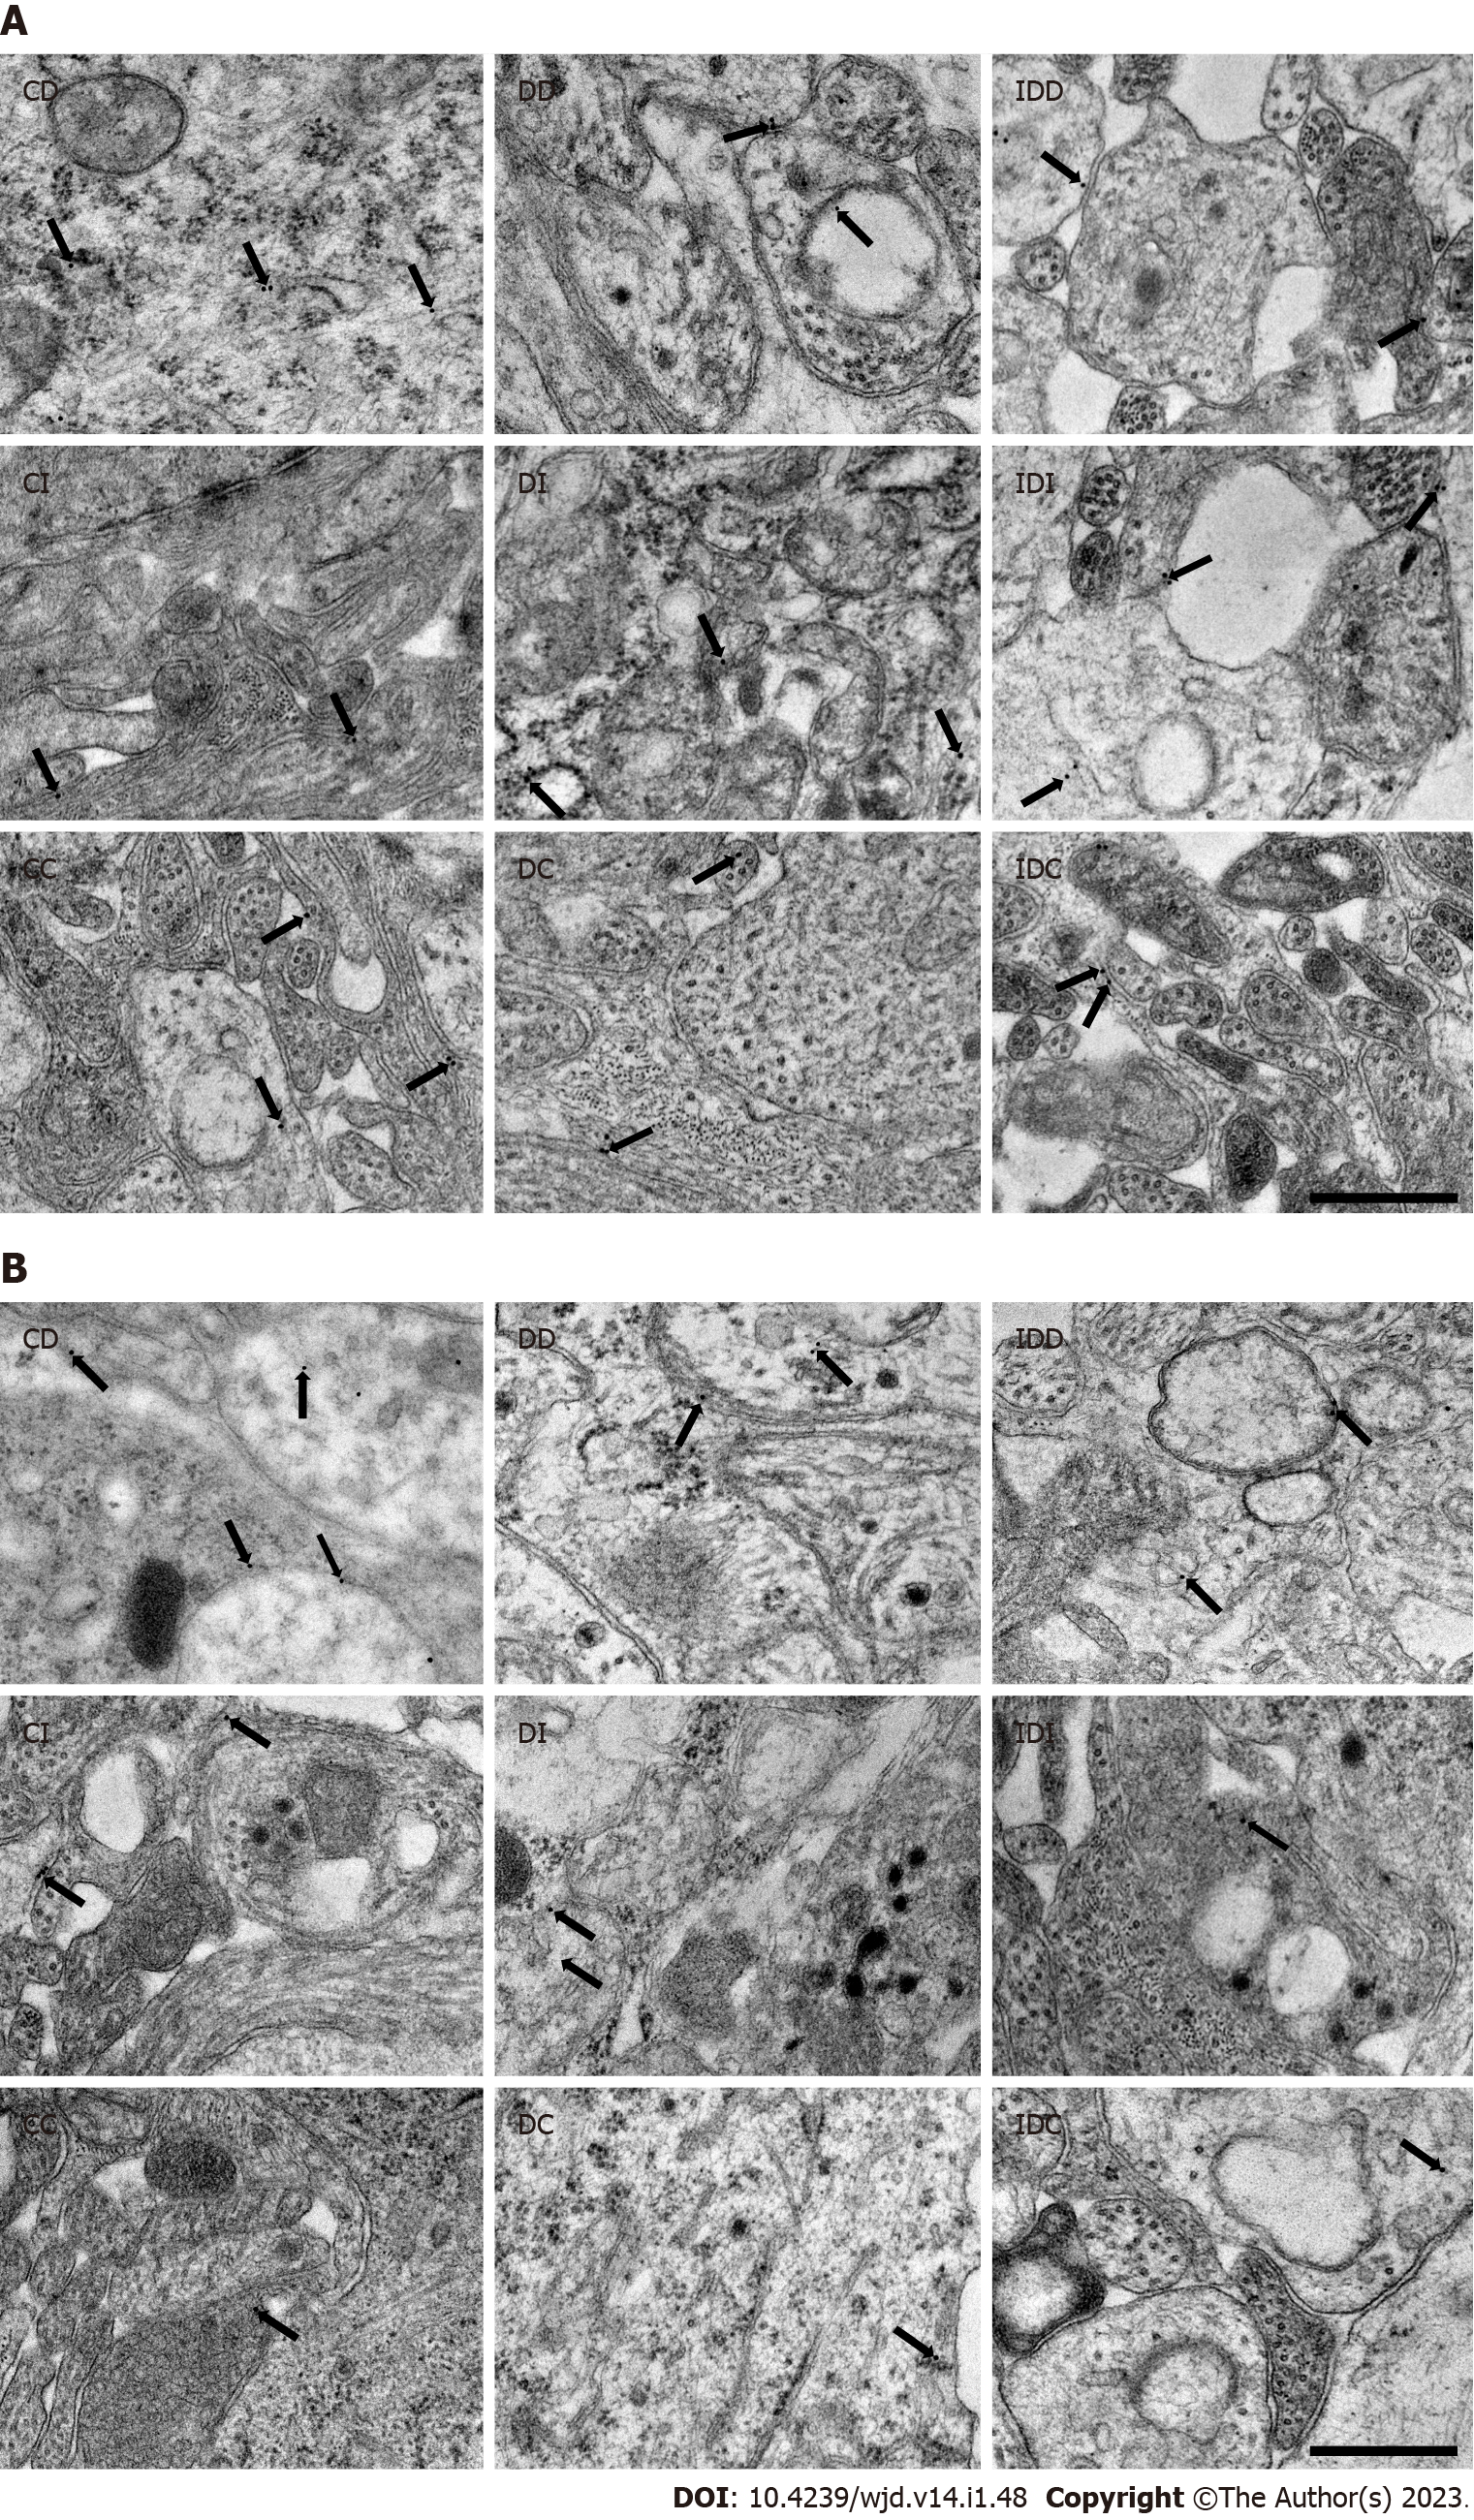
Figure 3 Representative electron micrographs of portions of the ganglionic neuropil or perikaryon of myenteric neurons from different gut segments of control, diabetic and insulin-treated diabetic rats after TNFR1 or TNFR2 post-embedding immunohistochemistry.
A: TNFR1; B: TNFR2. Arrows indicate 18 nm gold particles labeling TNFR1/TNFR2. Scale bar: 500 nm. CD: Control duodenum; CI: Control ileum; CC: Control colon; DD: Diabetic duodenum; DI: Diabetic ileum; DC: Diabetic colon; IDD: Insulin-treated diabetic duodenum; IDI: Insulin-treated diabetic ileum; IDC: Insulin-treated diabetic colon.
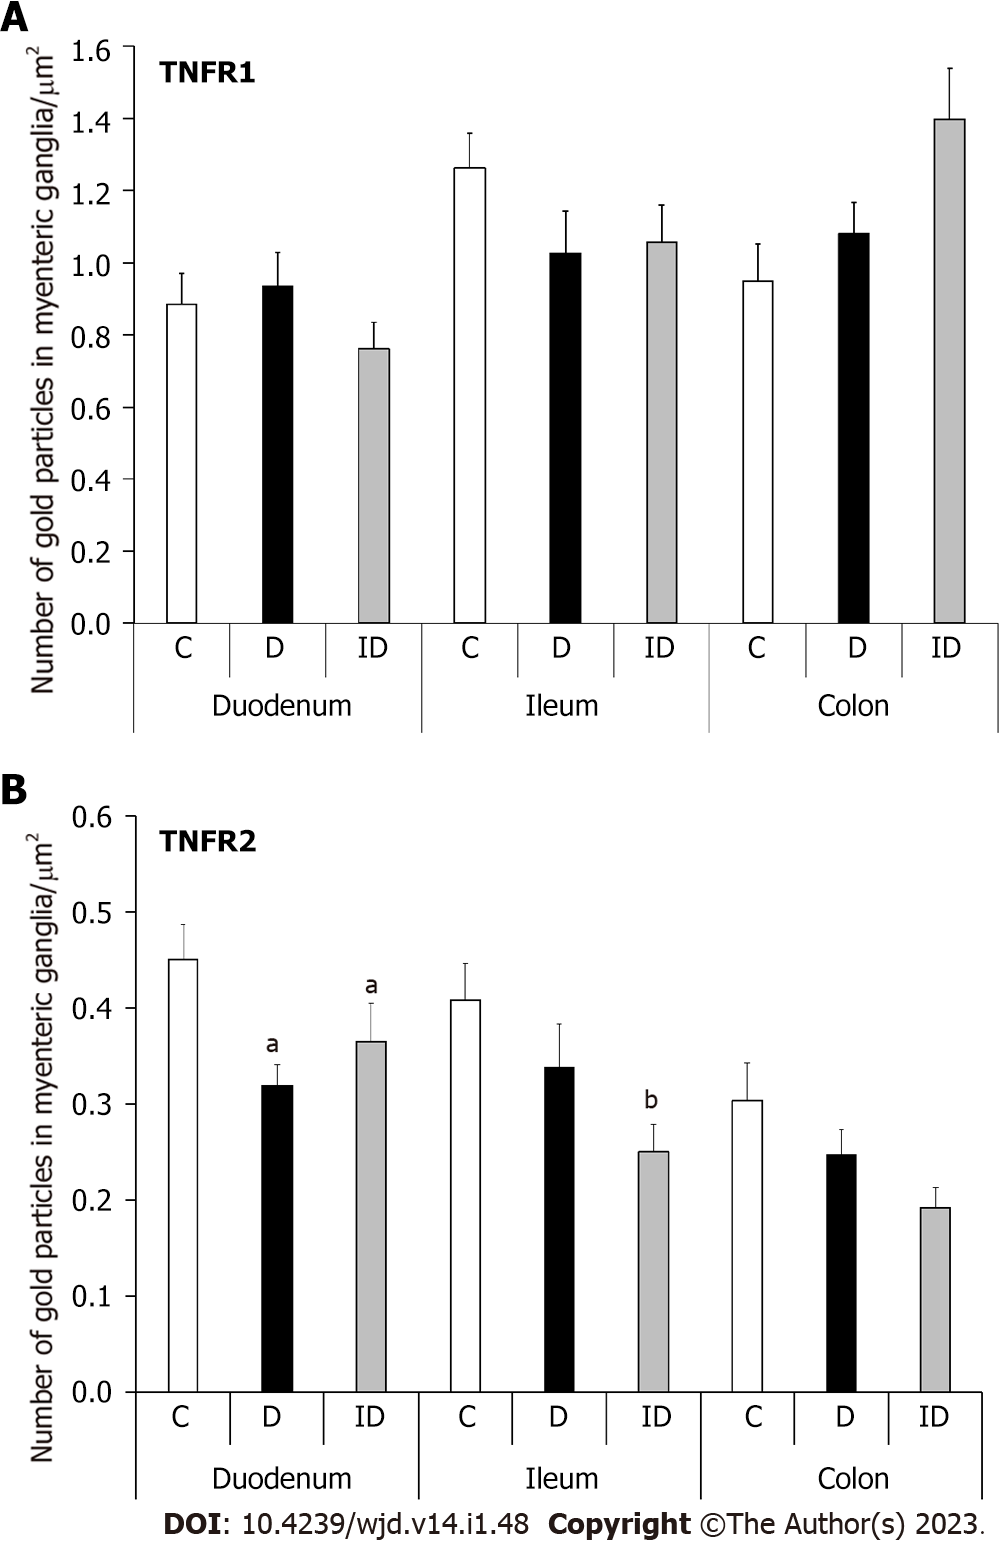
Figure 4 Quantitative evaluation of gold particles labeling TNFR1 and TNFR2 in myenteric ganglia from different gut segments of control, diabetic and insulin-treated diabetic rats.
A: TNFR1; B: TNFR2. The number of TNFR1-labeling gold particles did not change significantly in any experimental conditions and gut segments. Meanwhile, the TNFR2 density significantly decreased in the diabetic duodenum, which was not prevented by insulin. Data were expressed as means ± SE. aP < 0.05, bP < 0.01 (relative to the controls). C: Controls; D: Diabetics; ID: Insulin-treated diabetics.
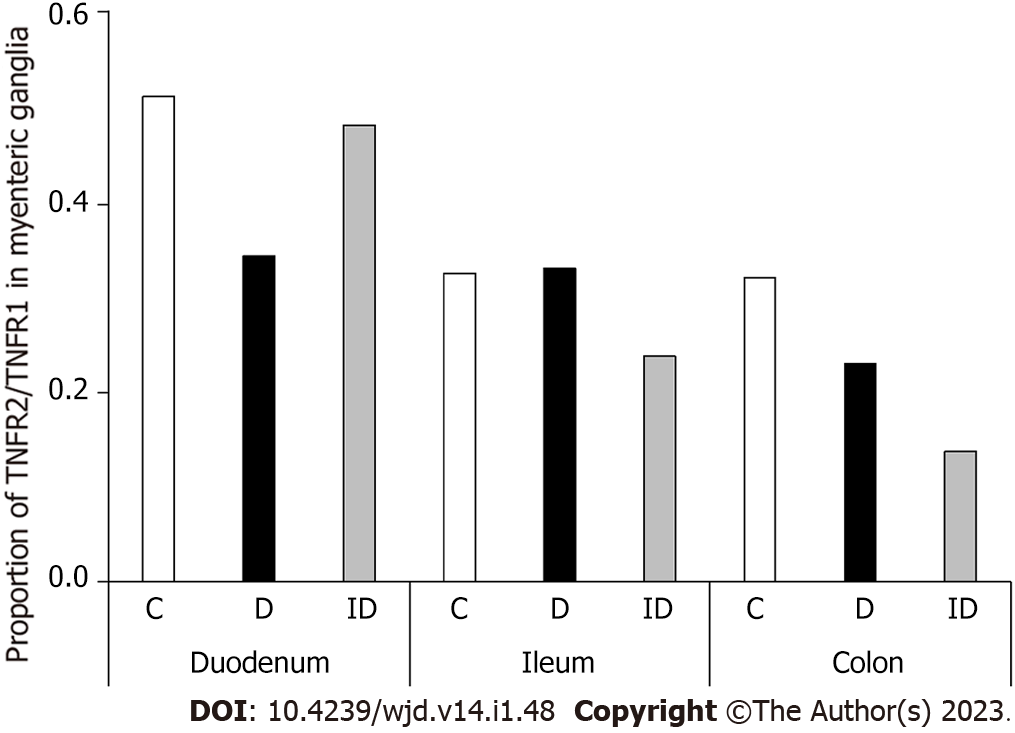
Figure 5 Proportion of TNFR2/TNFR1 density in myenteric ganglia from different gut segments of control, diabetic and insulin-treated diabetic rats.
The TNFR2/TNFR1 proportion mostly decreased in the duodenum of diabetics. C: Controls; D: Diabetics; ID: Insulin-treated diabetics.
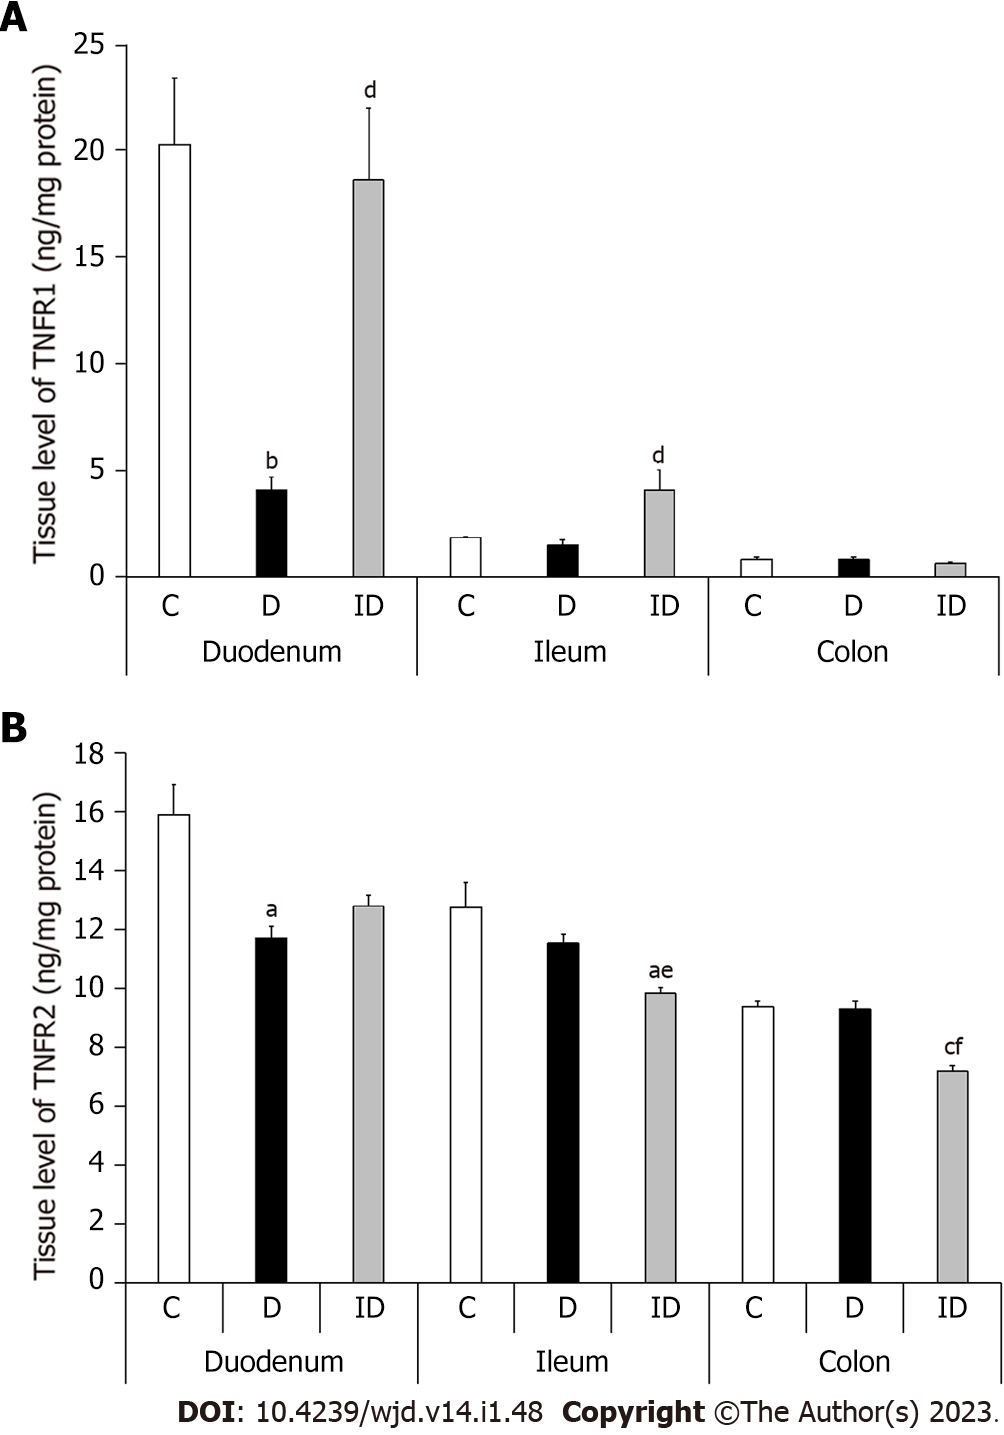
Figure 6 Tissue levels of TNFR1 and TNFR2 in intestinal smooth muscle layer homogenates including the myenteric plexus from the different gut segments of control, diabetic and insulin-treated diabetic rats.
A: TNFR1; B: TNFR2. Both the TNFR1 and TNFR2 levels decreased remarkably in the duodenum of diabetics, but they remained unchanged in other segments. Data are expressed as means ± SE. aP < 0.01, bP < 0.001, cP < 0.0001 (relative to the controls). dP < 0.01, eP < 0.001, fP < 0.0001 (between diabetics and insulin-treated diabetics). C: Controls; D: Diabetics; ID: Insulin-treated diabetics.
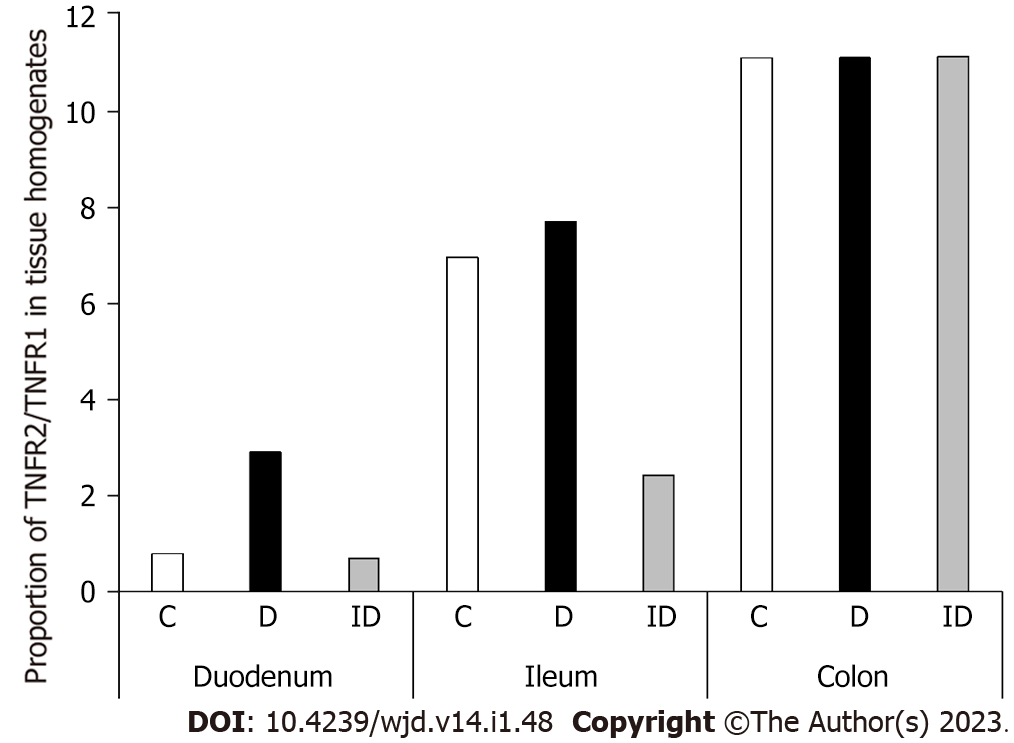
Figure 7 Proportion of TNFR2/TNFR1 levels in tissue homogenates from different gut segments of control, diabetic and insulin-treated diabetic rats.
The TNFR2/TNFR1 proportion only increased robustly in the duodenum of diabetics and it has been restored by insulin treatment. C: Controls; D: Diabetics; ID: Insulin-treated diabetics.
- Citation: Barta BP, Onhausz B, AL Doghmi A, Szalai Z, Balázs J, Bagyánszki M, Bódi N. Gut region-specific TNFR expression: TNFR2 is more affected than TNFR1 in duodenal myenteric ganglia of diabetic rats. World J Diabetes 2023; 14(1): 48-61
- URL: https://www.wjgnet.com/1948-9358/full/v14/i1/48.htm
- DOI: https://dx.doi.org/10.4239/wjd.v14.i1.48


