Copyright
©The Author(s) 2023.
World J Diabetes. Jan 15, 2023; 14(1): 17-25
Published online Jan 15, 2023. doi: 10.4239/wjd.v14.i1.17
Published online Jan 15, 2023. doi: 10.4239/wjd.v14.i1.17
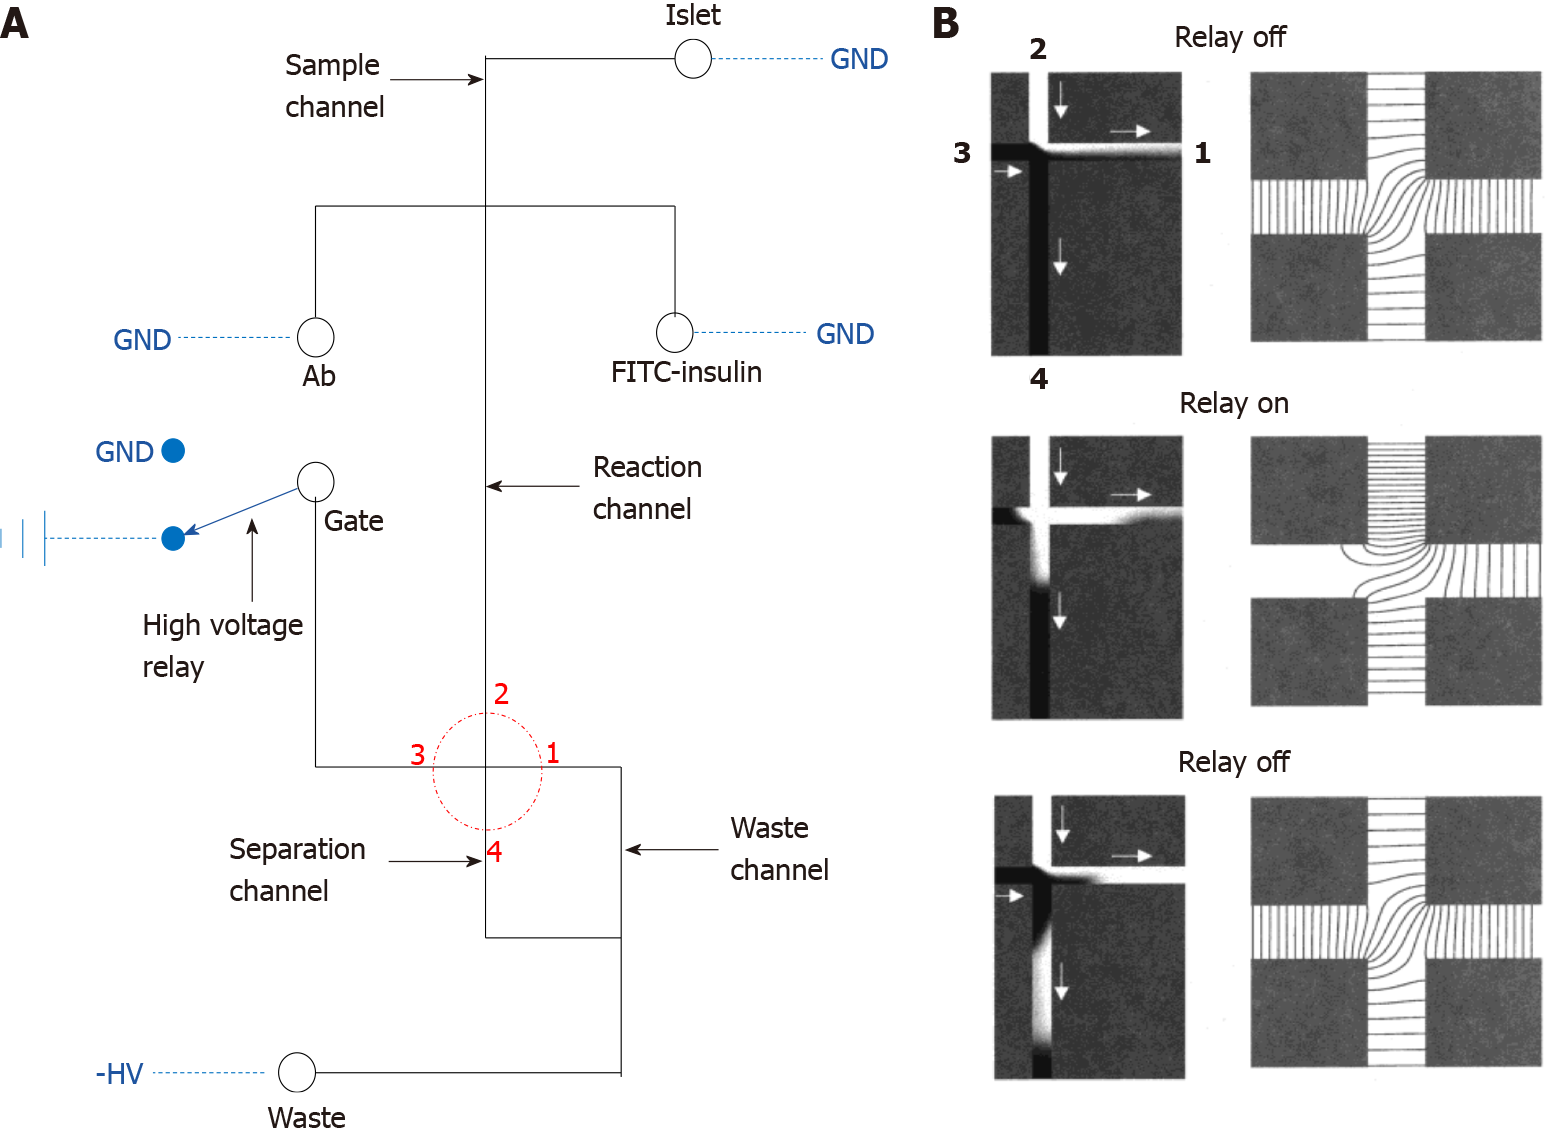
Figure 1 Diagram of the classical electrophoresis-based immunoassay microfluidic chip.
A: The fluid channel and electric circuit on the microfluidic device. The solid black line represents the fluid channel and the blue dashed line indicates the electric connection, the fluid part consists of the sample, immunoassay buffer, gate and waste port, these ports are separately connected to the ground, high voltage relay or a negative high voltage, the red dotted circle highlights the key separation crossroad on the device; B: Larger image of the red dotted circle. The left panel represents the fluid simulation, white fluid represents the sample, black fluid represents the fluid from the gate port, and the right panel demonstrates the equipotential lines. GND: Ground. A: Citation: Roper MG, Shackman JG, Dahlgren GM, Kennedy RT. Microfluidic chip for continuous monitoring of hormone secretion from live cells using an electrophoresis-based immunoassay. Anal Chem 2003; 75: 4711-4717. Copyright© American Chemical Society 2003. Published by ACS Publications. The authors have obtained the permission for figure using from the American Chemical Society (Supplementary material); B: Citation: Ermakov SV, Jacobson SC, Ramsey JM. Computer simulations of electrokinetic injection techniques in microfluidic devices. Anal Chem 2000; 72: 3512-3517. Copyright© American Chemical Society 2000. Published by ACS Publications. The authors have obtained the permission for figure using from the American Chemical Society (Supplementary material).
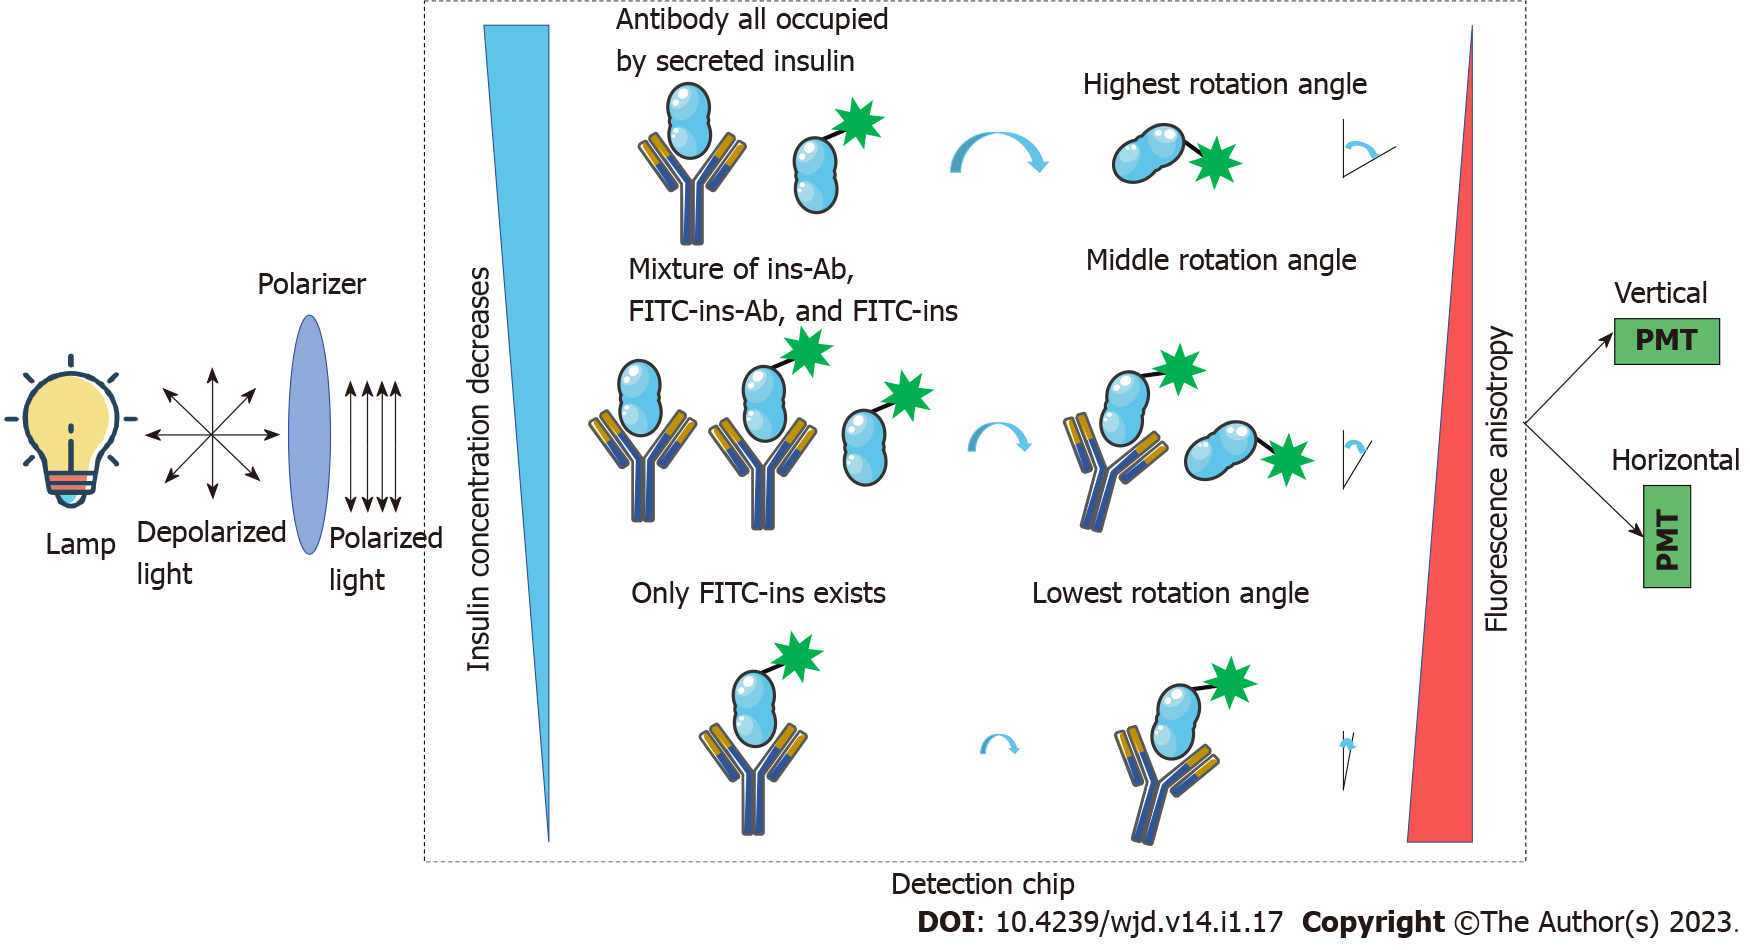
Figure 2 Theory of fluorescence anisotropy-based insulin sensing.
The lamp generates depolarized light and goes through the polarizer, and after polarization, the polarized light is used as the excitation source for the fluorophores. Different concentrations of non-labeled insulin will compete with fluorescein isothiocyanate-labeled-insulin for insulin antibodies, thus, generating different fluorescence anisotropy which can be sensed by a vertical and horizontal photomultiplier. The sensed signal is used for the calculation of non-labeled insulin concentration. FITC: Fluorescein isothiocyanate; PMT: Photomultiplier.
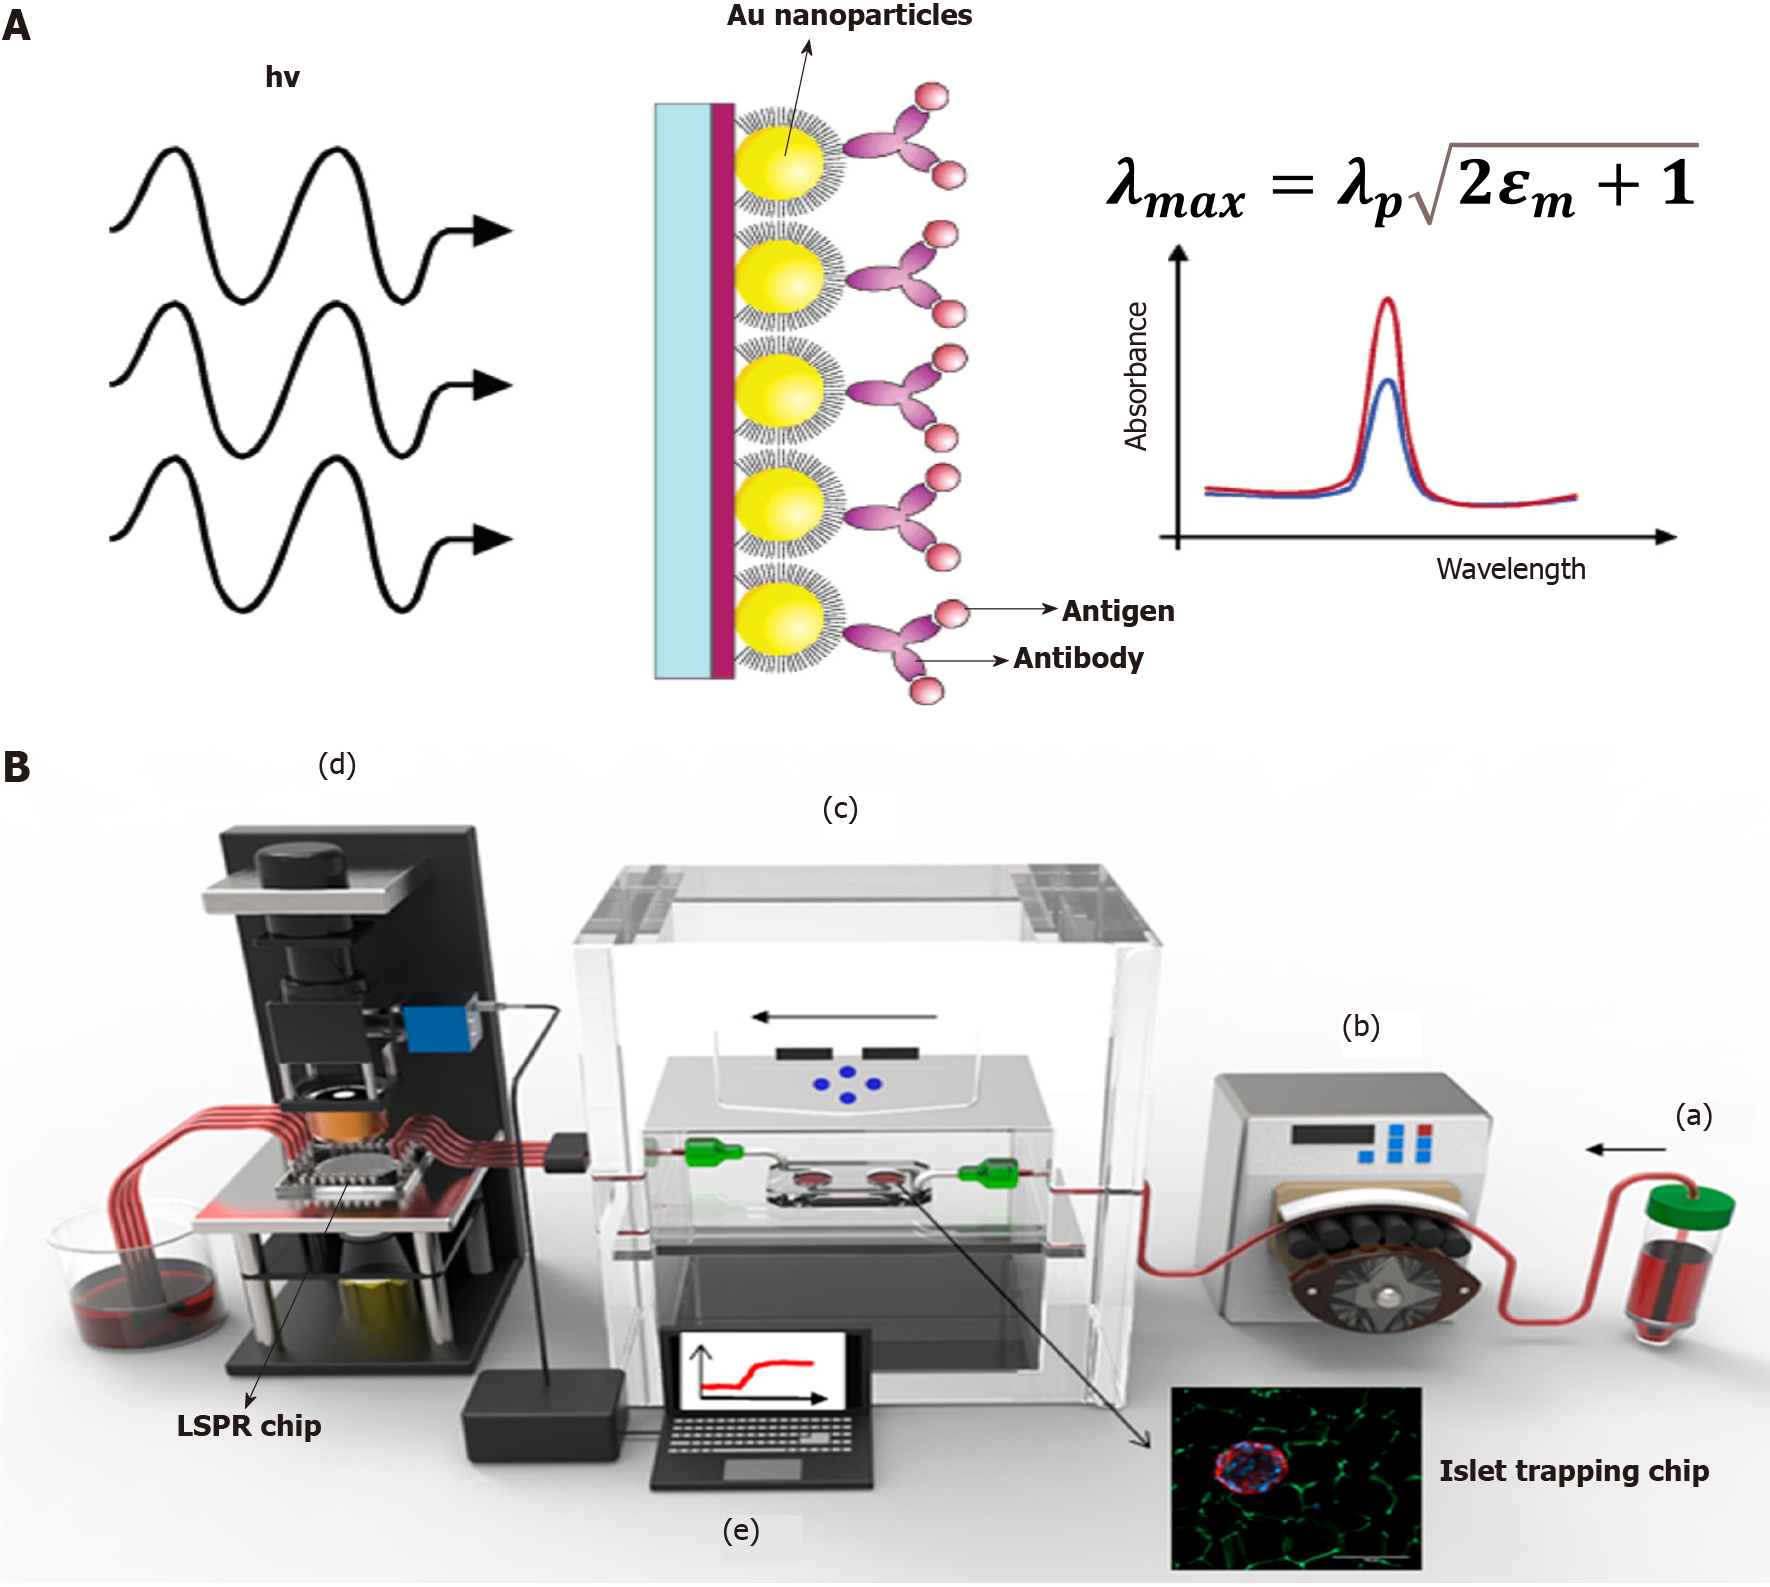
Figure 3 Localized surface plasmon resonance-based islet secretome sensing.
A: Theory of localized surface plasmon resonance (LSPR) and spectral curve before and after antigen binding; B: A real-world system for online islet trapping, perfusion and islet secretome monitoring. In general, the perfusate is pumped into the islet trapping chip by the peristaltic pump, and islet secretions are pumped out to the LSPR chip for further measurement; a: Culture medium or perfusate for islets; b: Peristaltic pump provide force for buffer; c: Islet trapping chip with tissue culture module; d: The LSPR detection module for spectral shift signal capturing; e: Work station for real-time signal transducing. LSPR: Localized surface plasmon resonance. A: Citation: Frederix F, Friedt JM, Choi KH, Laureyn W, Campitelli A, Mondelaers D, Maes G, Borghs G. Biosensing based on light absorption of nanoscaled gold and silver particles. Anal Chem 2003; 75: 6894-6900. Copyright© American Chemical Society 2003. Published by ACS Publications. The authors have obtained the permission for figure using from the American Chemical Society (Supplementary material); B: Citation: Ortega MA, Rodríguez-Comas J, Yavas O, Velasco-Mallorquí F, Balaguer-Trias J, Parra V, Novials A, Servitja JM, Quidant R, Ramón-Azcón J. In Situ LSPR Sensing of Secreted Insulin in Organ-on-Chip. Biosensors (Basel) 2021; 11. Copyright© 2021 by the authors. Published by MDPI. No special permission is required to reuse all or part of article published by MDPI, including figures and tables (https://www.mdpi.com/openaccess).
- Citation: Li W, Peng YF. Advances in microfluidic chips based on islet hormone-sensing techniques. World J Diabetes 2023; 14(1): 17-25
- URL: https://www.wjgnet.com/1948-9358/full/v14/i1/17.htm
- DOI: https://dx.doi.org/10.4239/wjd.v14.i1.17


