Copyright
©The Author(s) 2022.
World J Diabetes. Sep 15, 2022; 13(9): 765-775
Published online Sep 15, 2022. doi: 10.4239/wjd.v13.i9.765
Published online Sep 15, 2022. doi: 10.4239/wjd.v13.i9.765
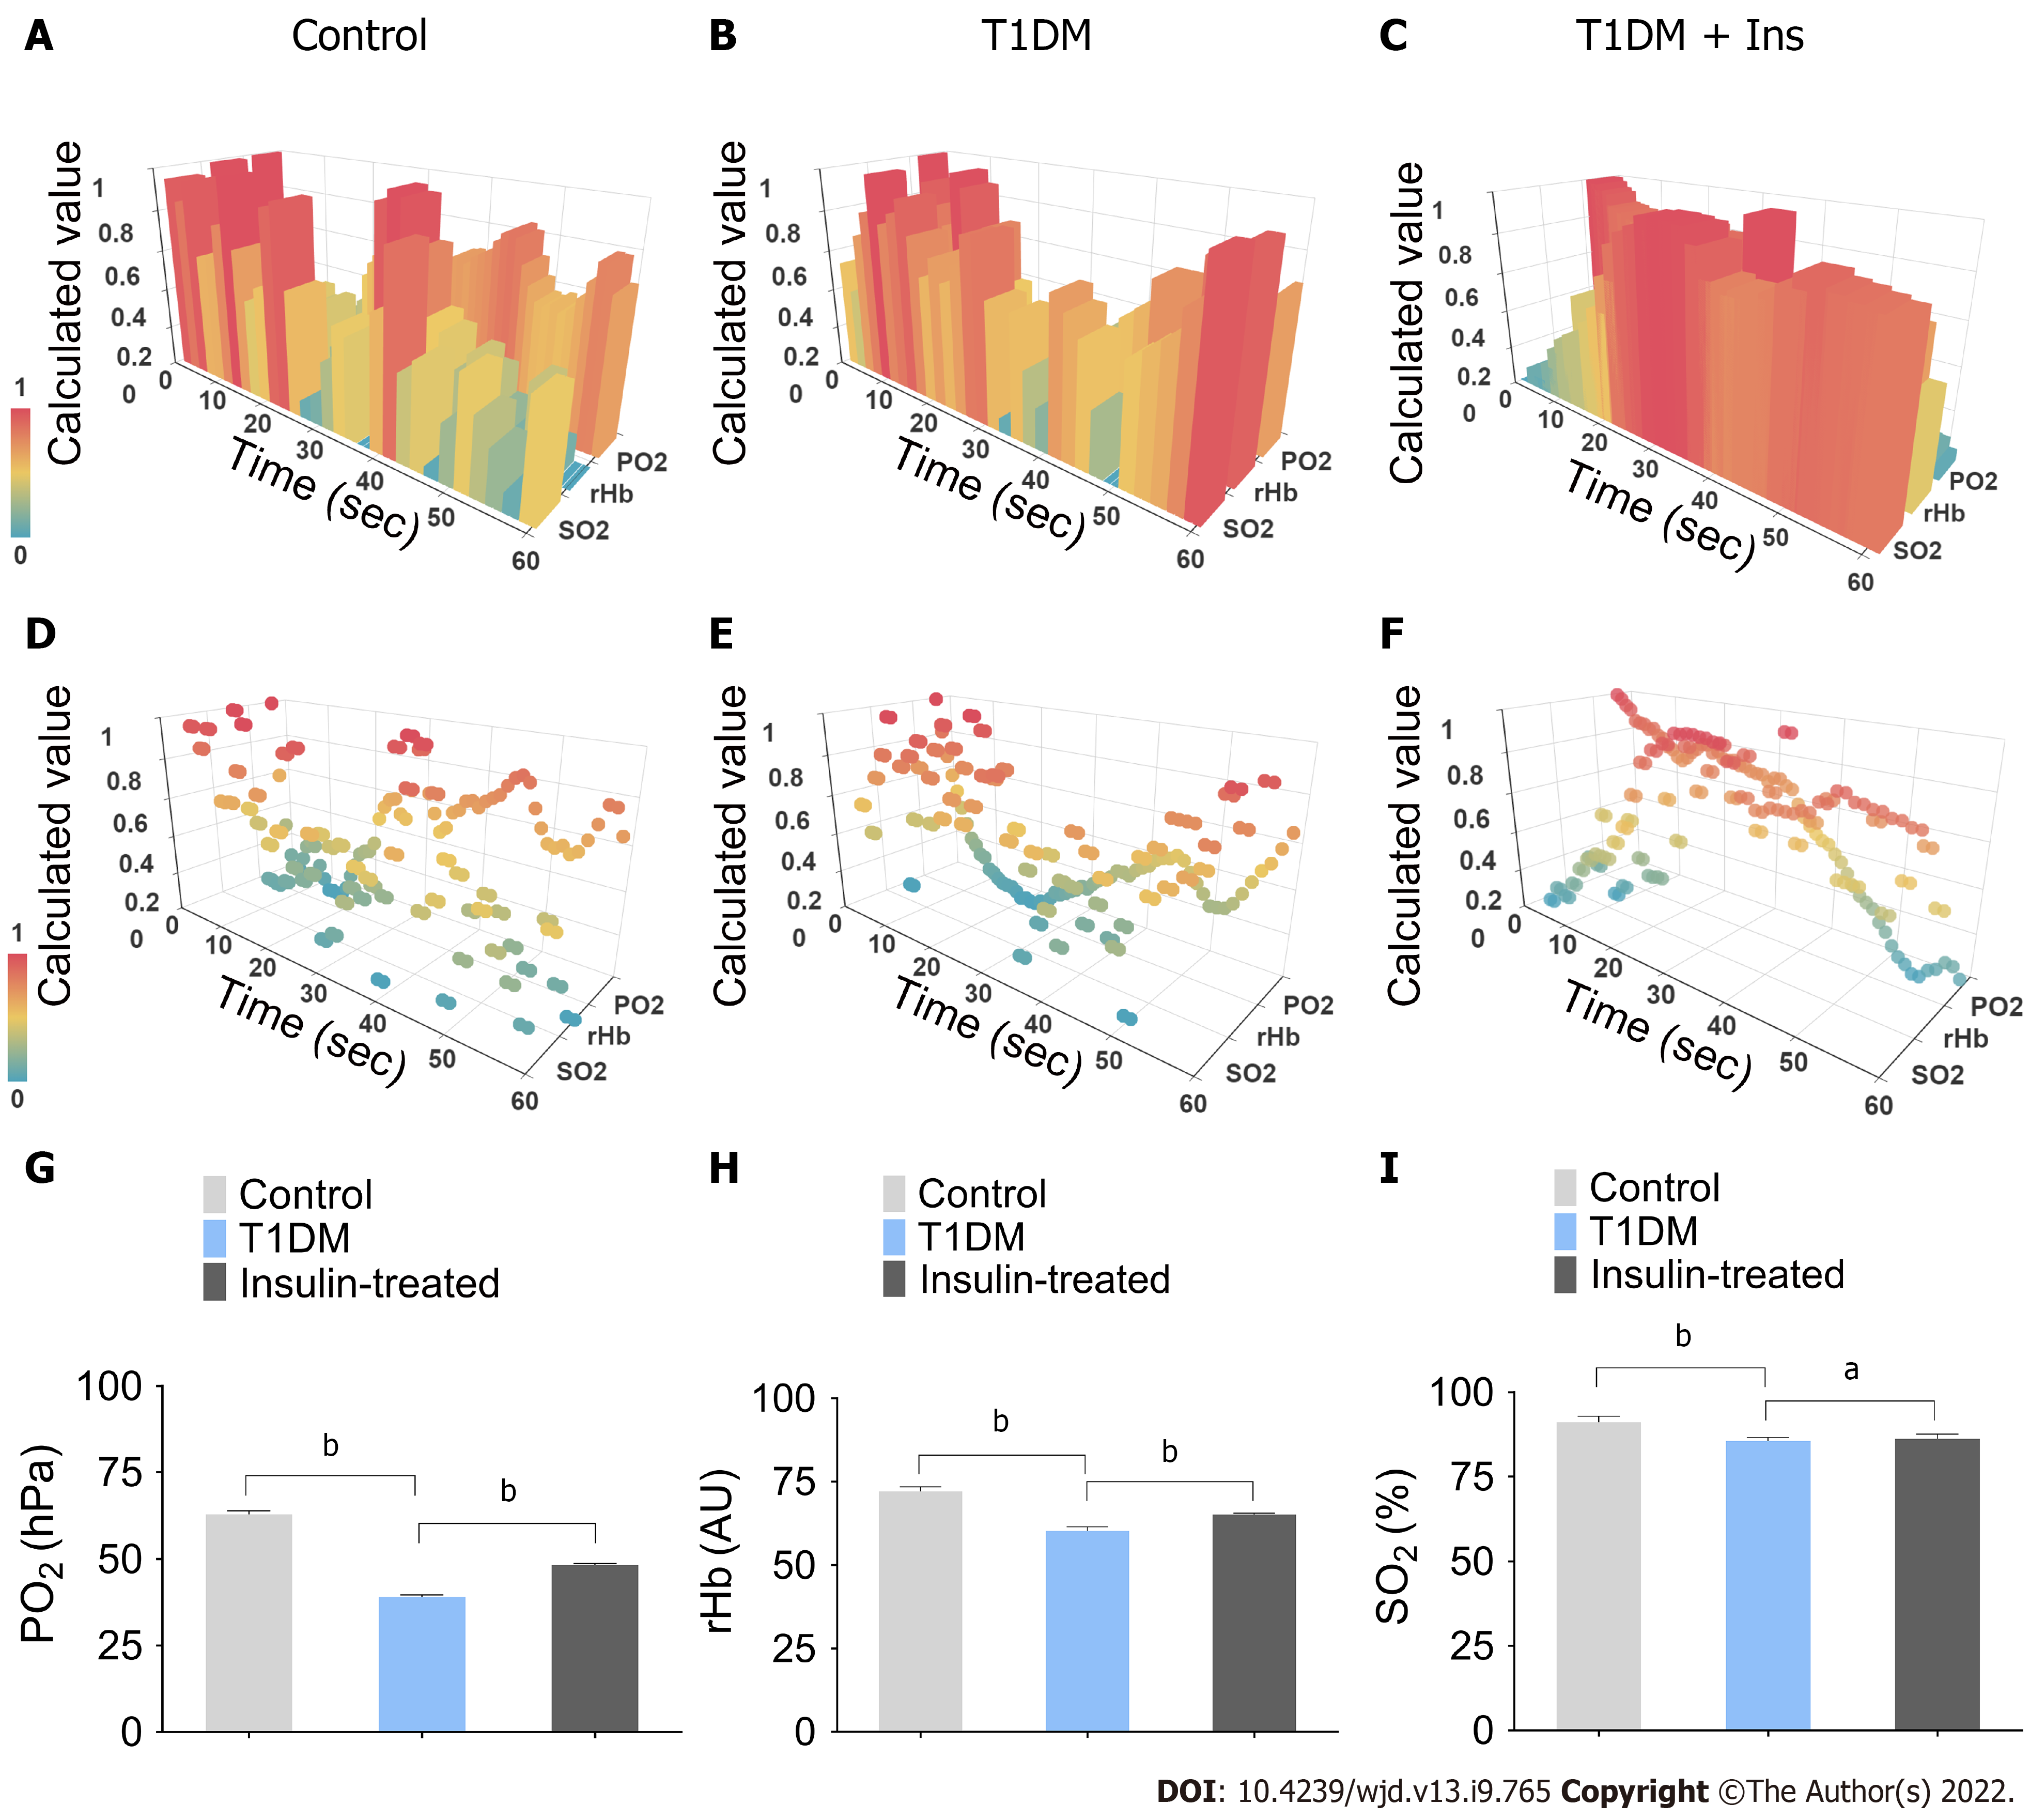
Figure 1 Integrated pancreatic microcirculatory oxygen profile.
A-F: The pancreatic microcirculatory oxygen parameters of control, type 1 diabetes mellitus (T1DM) and insulin-treated mice were captured by probes of O2C and Microx TX3. Python and Apache ECharts were used to generate and visualize the three-dimensional (3-D) module of the integrated pancreatic microcirculatory oxygen profile; G-I: Comparisons of pancreatic microcirculatory oxygen profiles among groups. Partial pressure of oxygen, relative amount of hemoglobin, and hemoglobin oxygen saturation levels in control and T1DM mice with or without insulin administration are illustrated. aP < 0.05, bP < 0.01. Control, control mice; T1DM, STZ-induced T1DM mice without insulin administration; Insulin-treated, STZ-induced diabetic mice with 1.5 IU administration. T1DM: type 1 diabetes mellitus; Ins: Insulin; SO2: Hemoglobin oxygen saturation; rHb: Relative amount of hemoglobin; PO2: Partial pressure of oxygen; O2C: Oxygen to See.
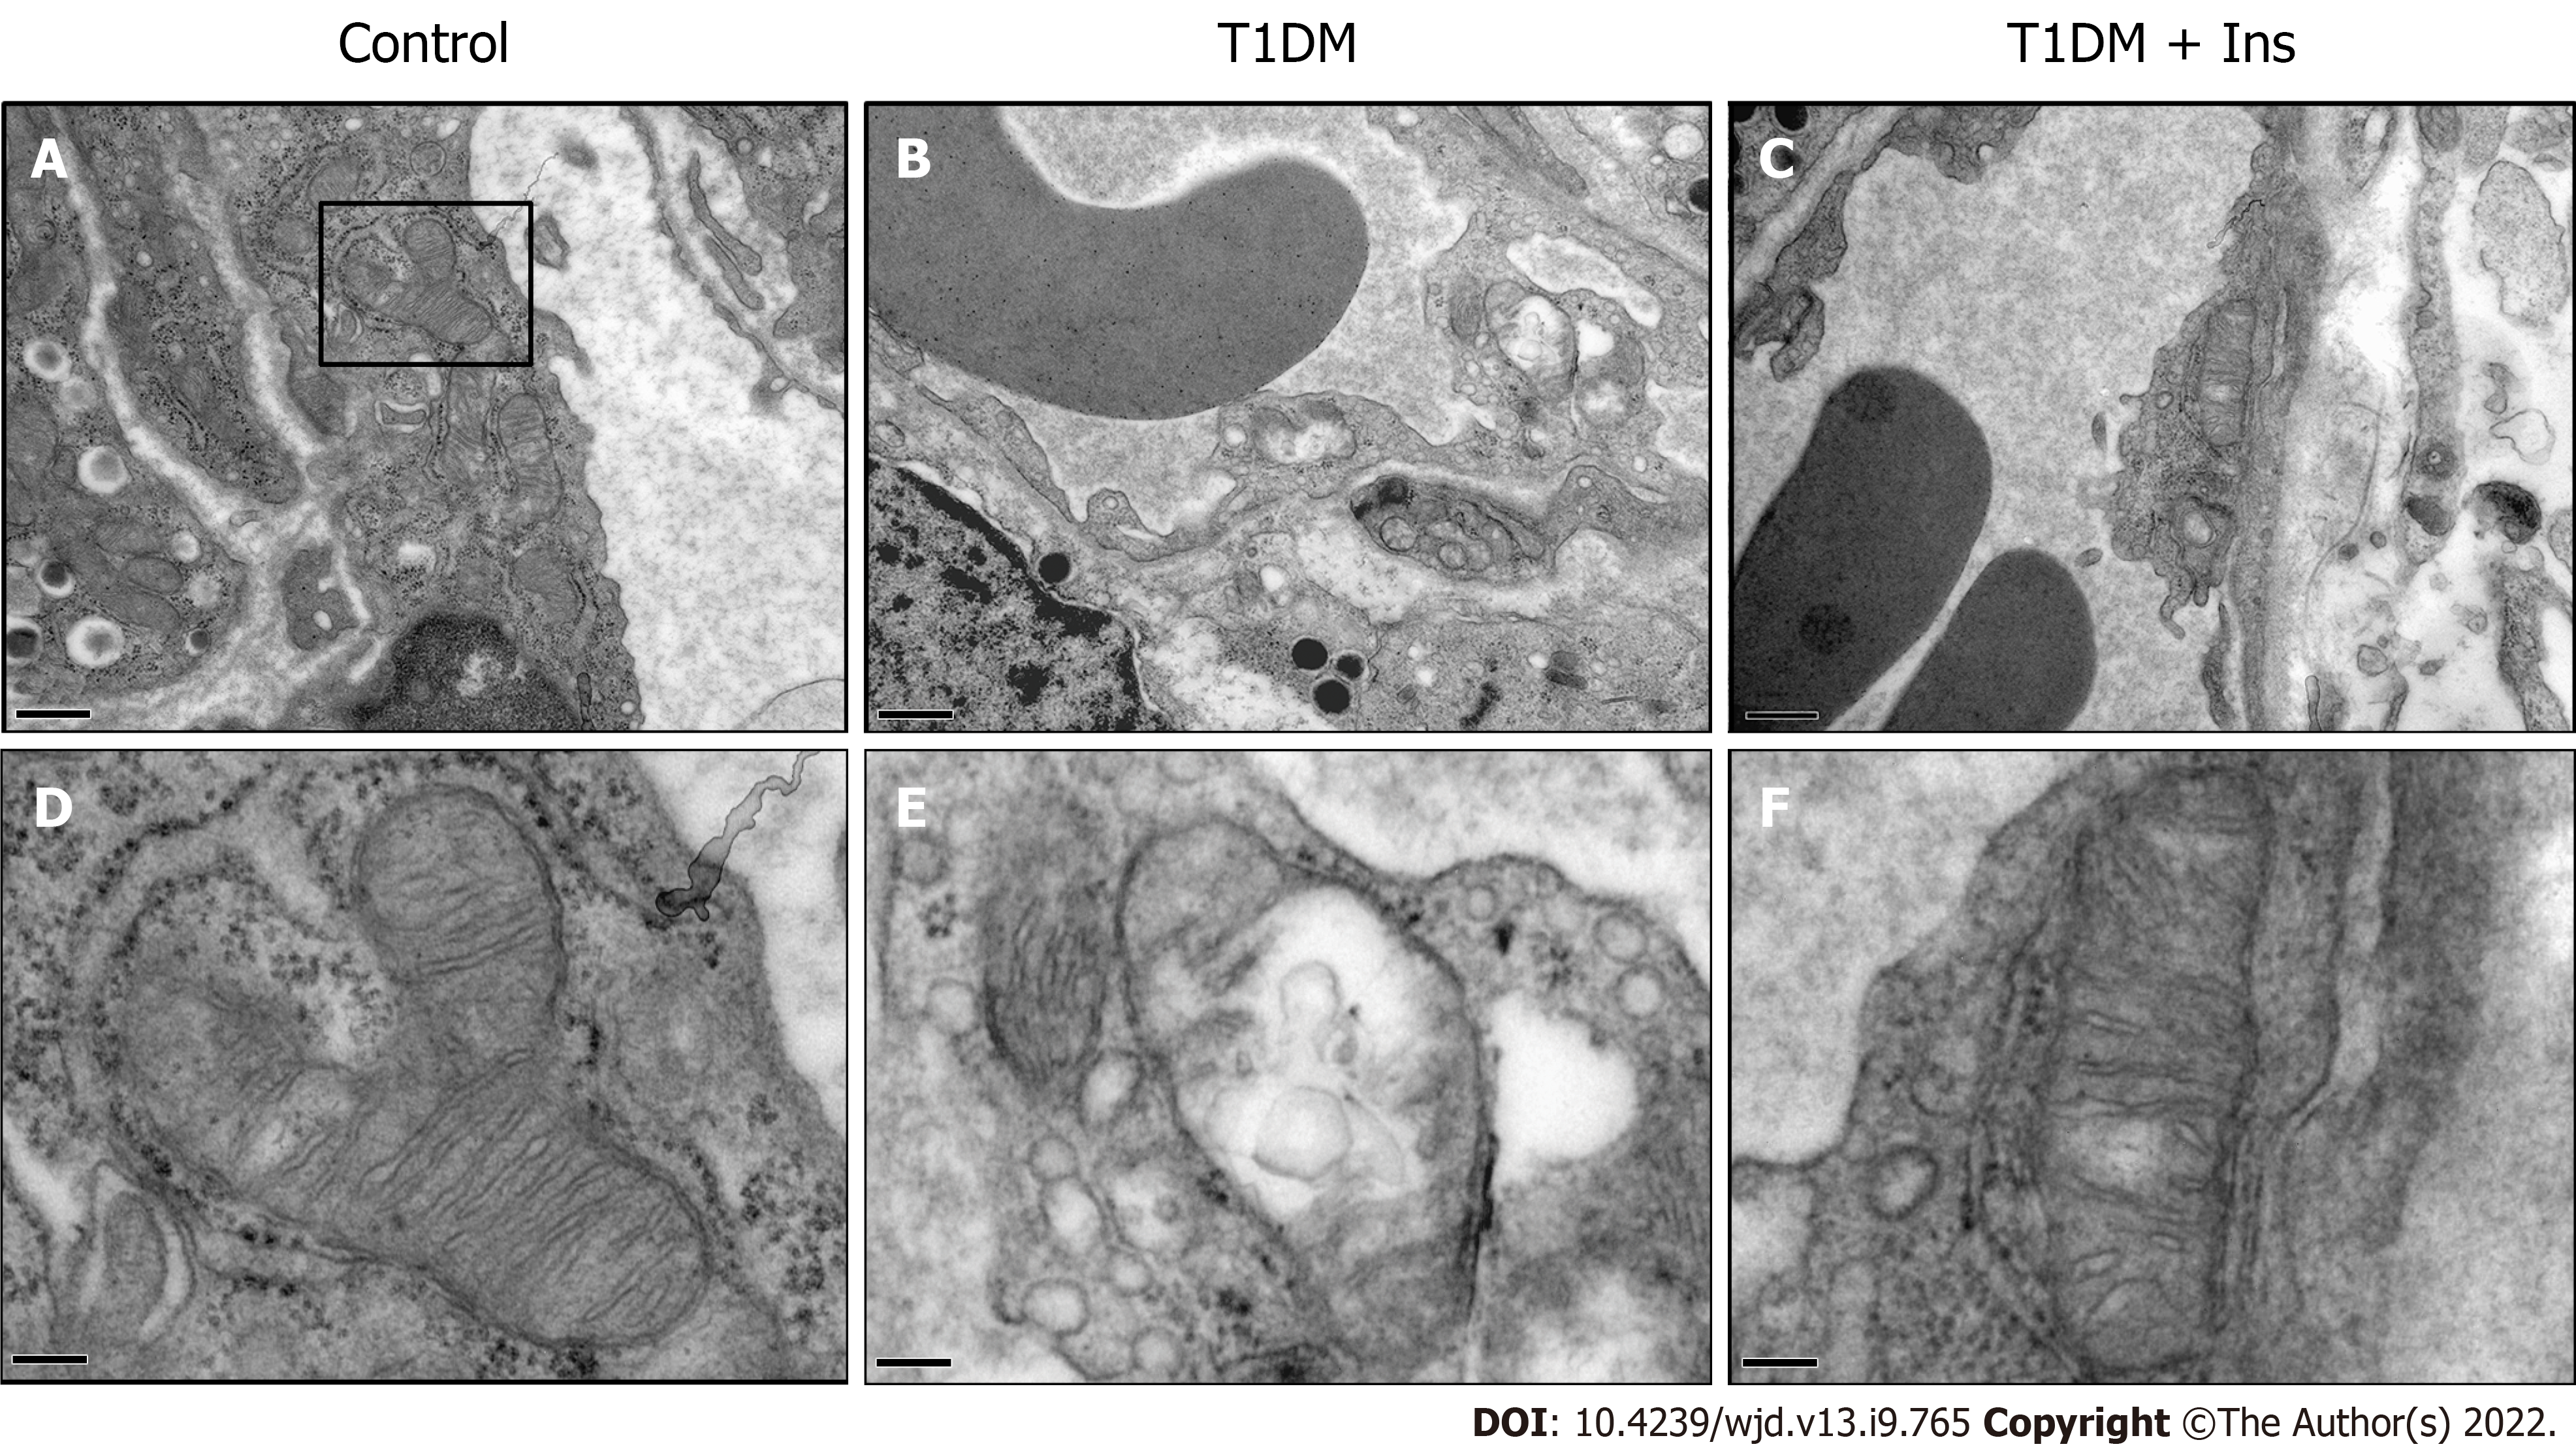
Figure 2 Glucotoxicity induced ultrastructural damage to mitochondria in islet microvascular endothelial cells.
The ultrastructure of pancreatic islet microvascular endothelial cells (IMECs) in the control (A), type 1 diabetes mellitus (T1DM) (B) and insulin-treated groups (C) was revealed by TEM (upper panels, scale bar = 0.5 μm). The ultrastructure of mitochondria in IMECs in the control (D), T1DM (E) and insulin-treated groups (F) is shown in the lower panels. Swollen mitochondria with cristae rupture or disappearance and a transparent matrix were found in T1DM mice. Restored mitochondria were observed after insulin administration (lower panels, scale bar = 2 μm).
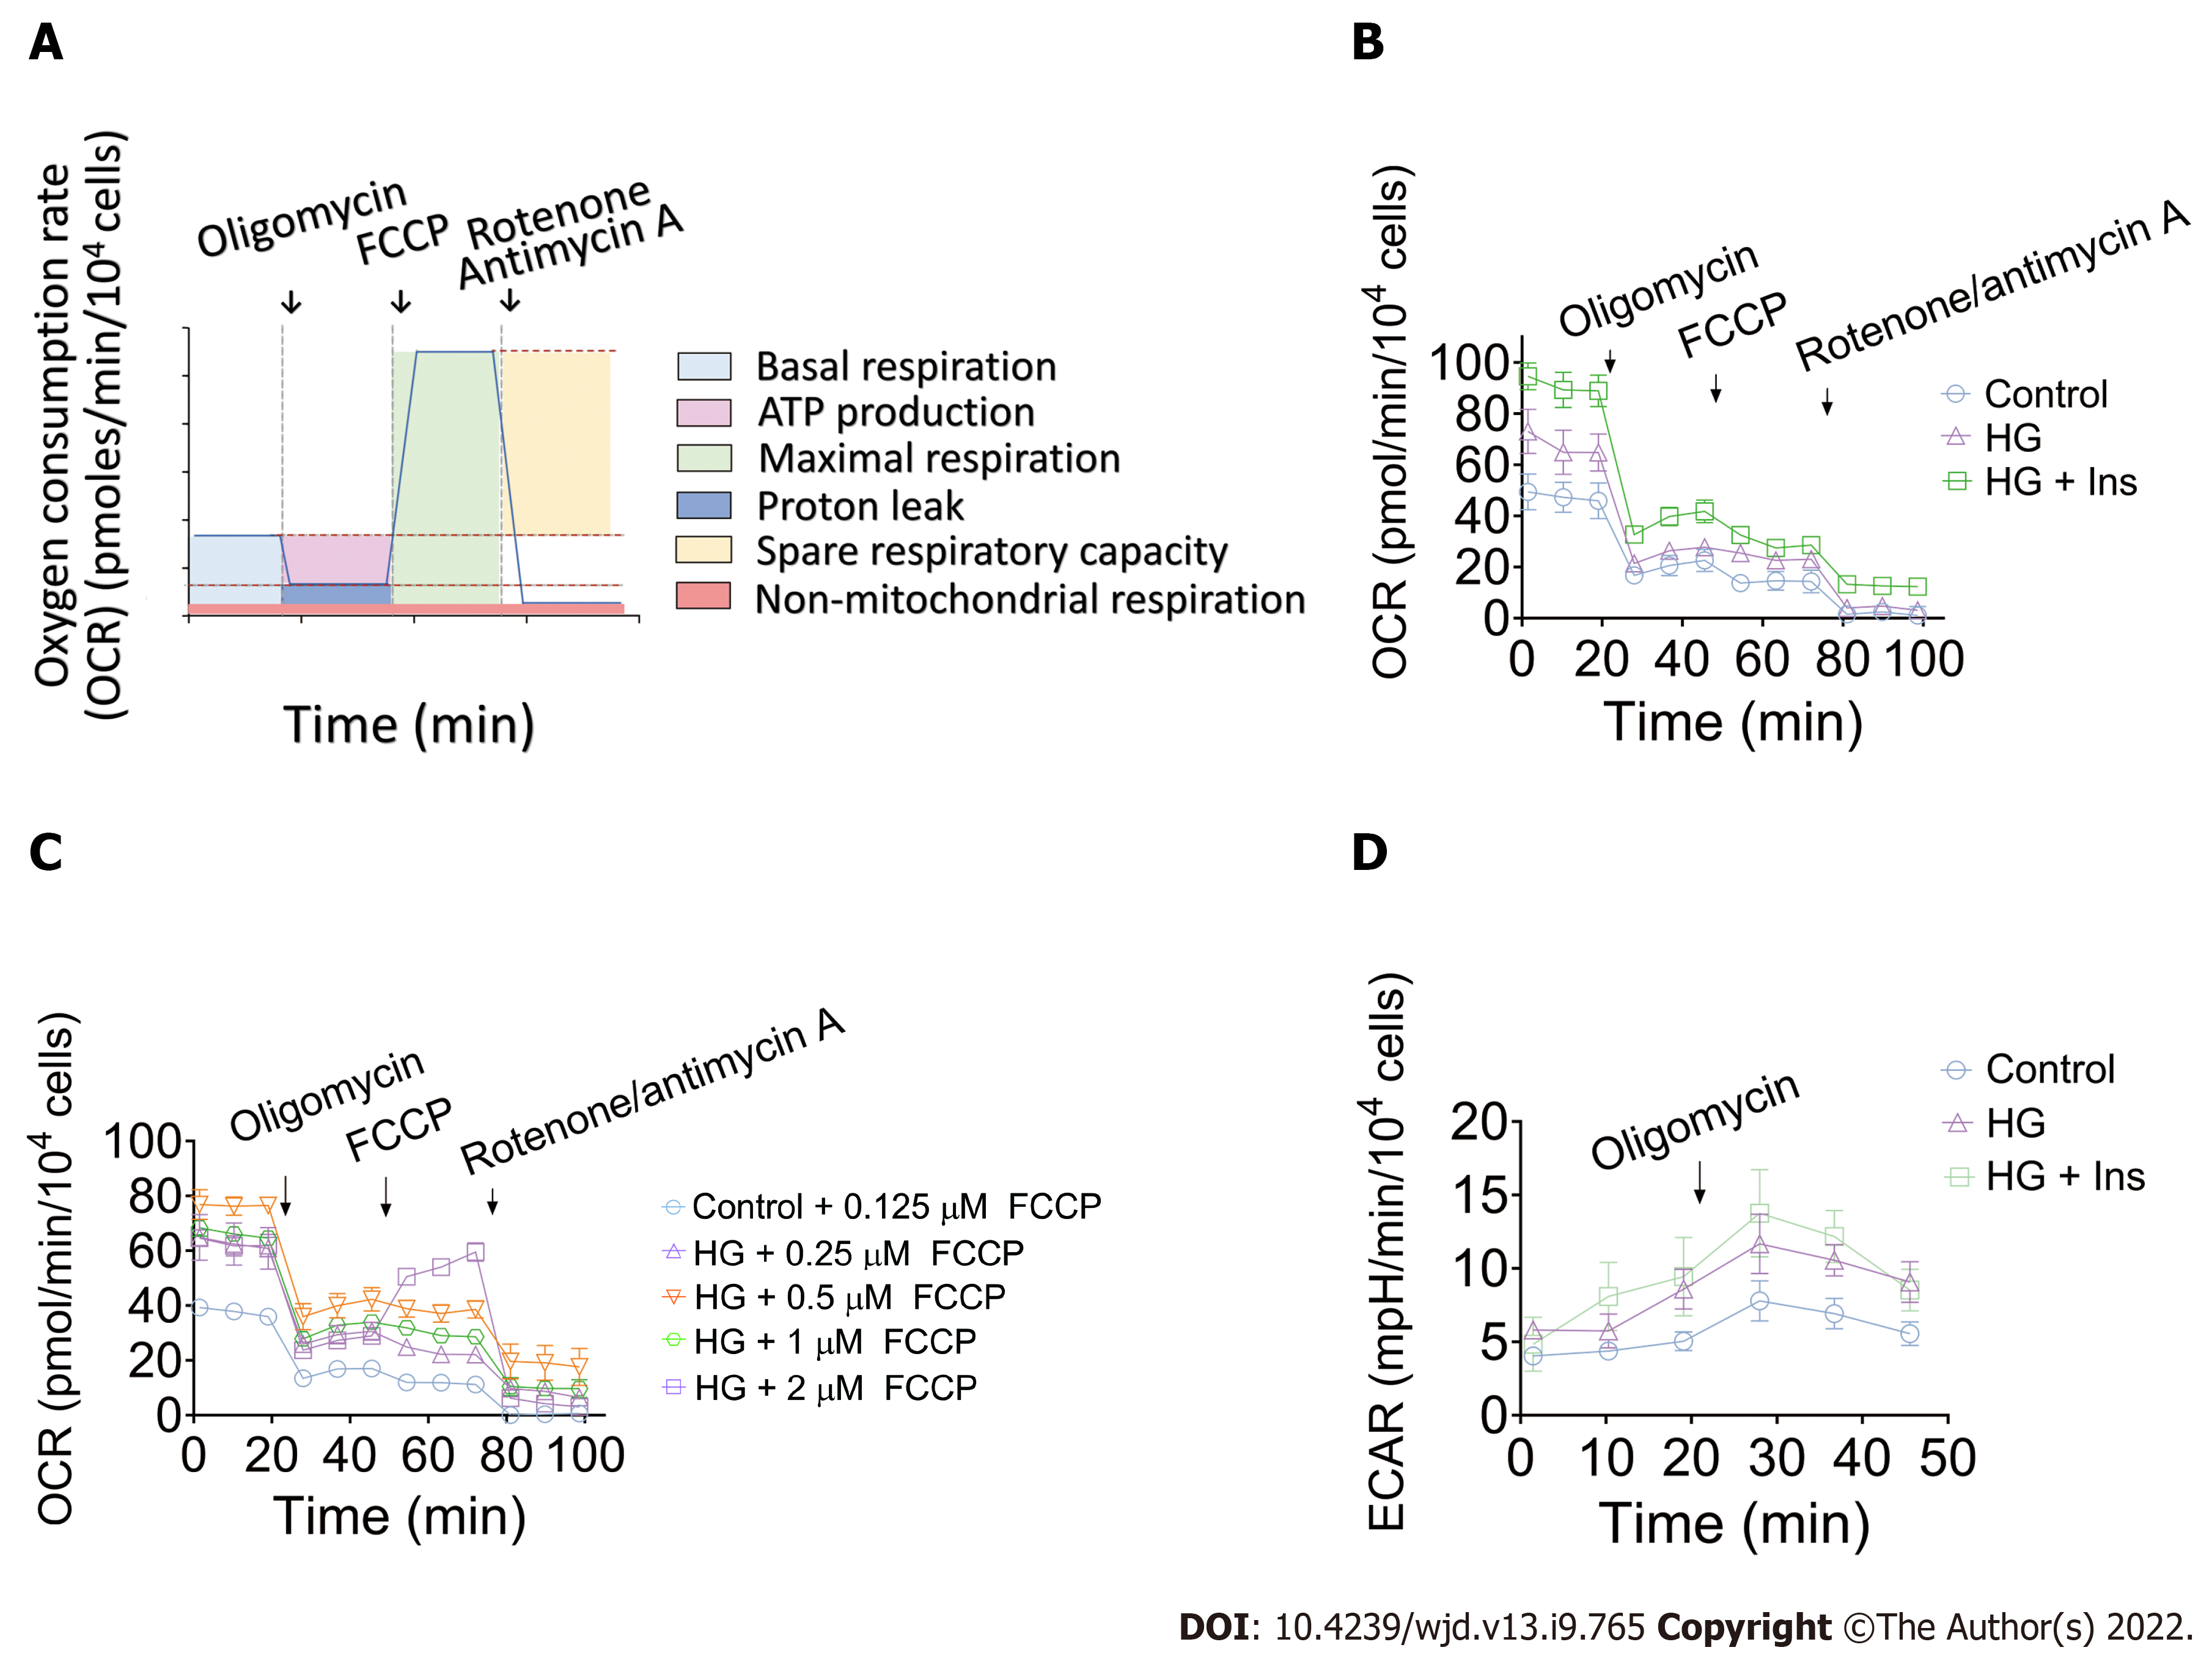
Figure 3 Characterization of mitochondrial function in the control, glucotoxicity-exposed, and insulin-treated islet microvascular endothelial cell groups.
A: Schematic representation of real-time mitochondrial respiration. The parameters of mitochondrial function were measured by kinetic oxygen consumption rate (OCR) analysis, starting from basal detection and after the injection of oligomycin (complex V inhibition), carbonyl cyanide 4-(trifluoromethoxy) phenylhydrazone (FCCP, maximal respiration induction), and rotenone/antimycin A mixture (electron transport chain inhibition). Non-mitochondrial respiration was directly measured. Basal respiration, ATP production, maximal respiration, proton leak, and mitochondrial spare respiratory capacity were then calculated according to the OCR curve; B: Representative kinetic curve of mitochondrial OCR in control, glucotoxicity-exposed islet microvascular endothelial cells (IMECs) (HG), and insulin-treated IMECs (HG + Ins) after sequential injection of oligomycin, FCCP, and rotenone/antimycin A; C: Representative kinetic curve of mitochondrial OCR in control and glucotoxicity-exposed IMECs (HG) after sequential injection of gradient FCCP concentrations; D: Representative kinetic curve of extracellular acidification rate (ECAR) after injection of oligomycin. The peak values of ECAR reflect the glycolytic capacity. The data are presented as the mean ± SEM, n = 4 for each group. OCR: Oxygen consumption rate; FCCP: Carbonyl cyanide 4-(trifluoromethoxy) phenylhydrazone; HG: High glucose; Ins: Insulin.
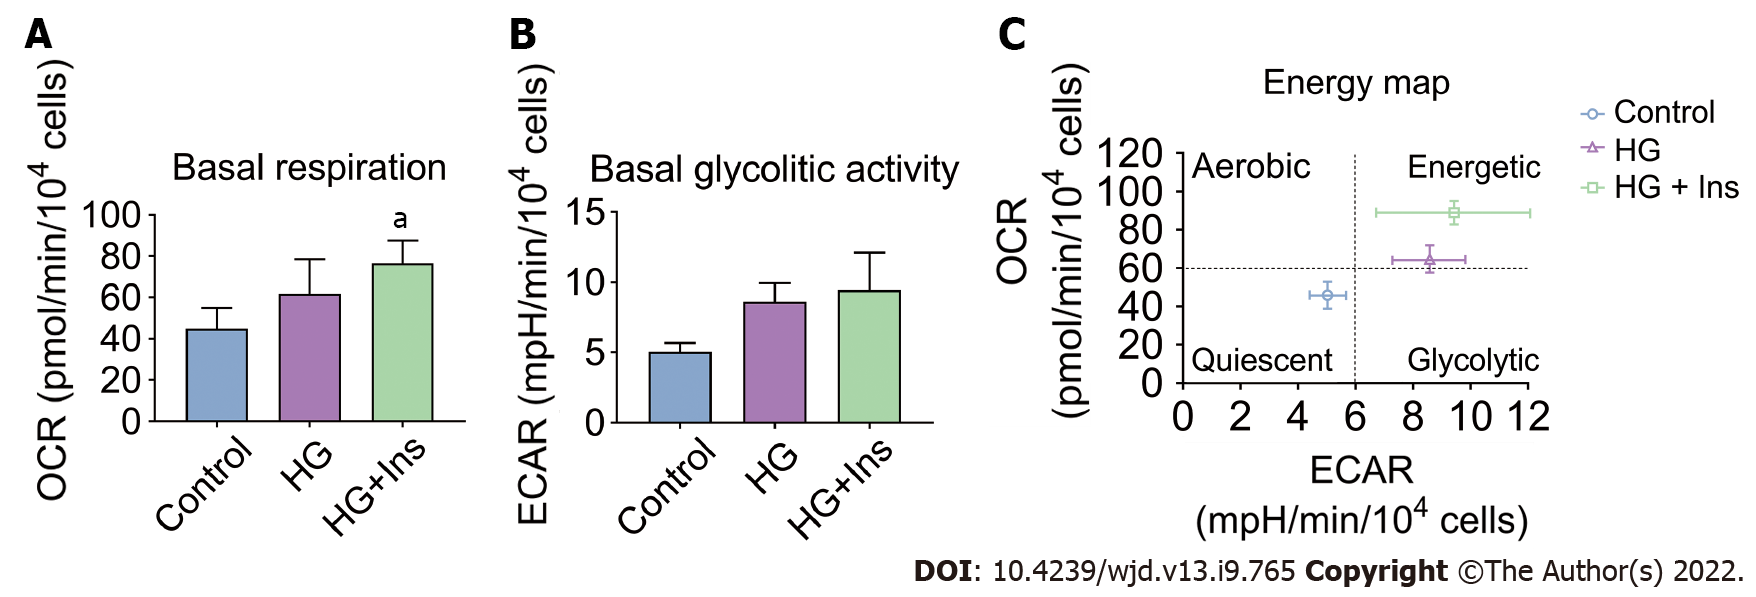
Figure 4 Basal respiration and glycolytic activity in islet microvascular endothelial cells.
The oxygen consumption rate and extracellular acidification rate were measured and compared among control, glucotoxicity-exposed islet microvascular endothelial cells (IMECs) (HG), and IMECs (HG + Ins). A: Basal respiration among groups; B: Basal glycolytic activity among groups; C: Glucotoxicity-exposed and insulin administered IMECs display distinct metabolic phenotypes. The data are presented as the mean ± SEM, n = 4 for each group. aP < 0.05. OCR: Oxygen consumption rate; ECAR: Extracellular acidification rate; HG: High glucose; Ins: Insulin.
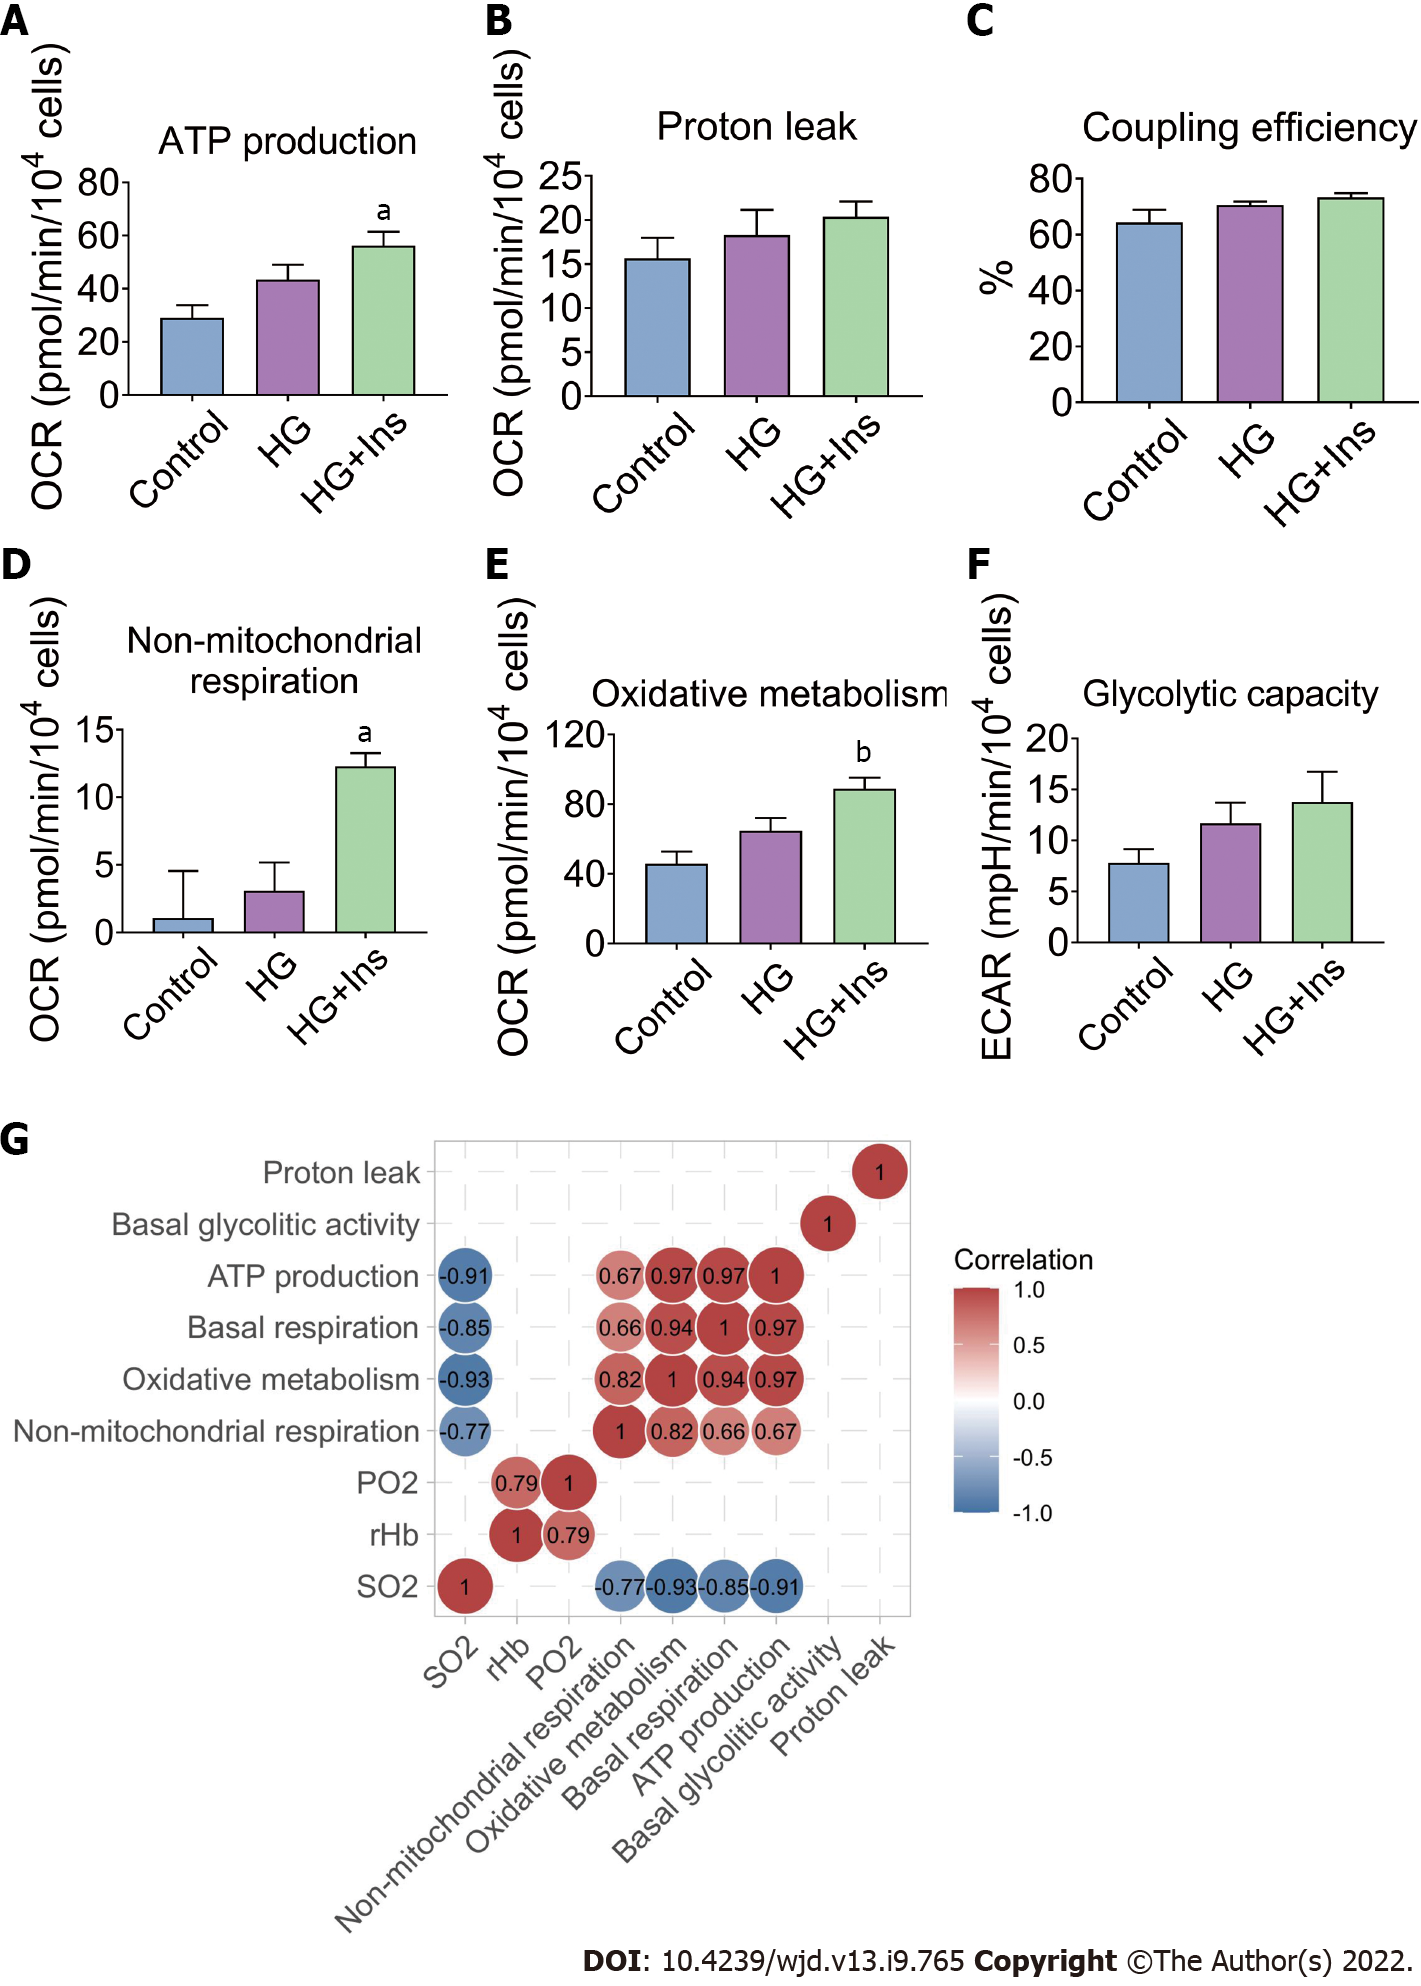
Figure 5 Metabolic characteristics of the islet microvascular endothelial cells.
A-E: Oxygen consumption rates associated with mitochondrial ATP production, proton leak, coupling efficiency, non-mitochondrial respiration and oxidative metabolism; F: Endothelial glycolytic capacity evaluated by extracellular acidification rate; The data are presented as the mean ± SEM, n = 4 for each group. aP < 0.05, bP < 0.01 vs Control; G: The correlation analysis among pancreatic microcirculatory oxygen profile and microvascular endothelial mitochondrial metabolism. The correlation coefficients (r) in the control, glucotoxicity-exposed, and insulin-treated groups are illustrated as matrix plots. The numbers in the figure represent the correlation coefficient (r) values. SO2: oxygen saturation; rHb, relative amount of hemoglobin; PO2: partial oxygen pressure. OCR: Oxygen consumption rate; HG: High glucose; Ins: Insulin.
- Citation: Li BW, Li Y, Zhang X, Fu SJ, Wang B, Zhang XY, Liu XT, Wang Q, Li AL, Liu MM. Role of insulin in pancreatic microcirculatory oxygen profile and bioenergetics. World J Diabetes 2022; 13(9): 765-775
- URL: https://www.wjgnet.com/1948-9358/full/v13/i9/765.htm
- DOI: https://dx.doi.org/10.4239/wjd.v13.i9.765


