Copyright
©The Author(s) 2022.
World J Diabetes. Oct 15, 2022; 13(10): 861-876
Published online Oct 15, 2022. doi: 10.4239/wjd.v13.i10.861
Published online Oct 15, 2022. doi: 10.4239/wjd.v13.i10.861
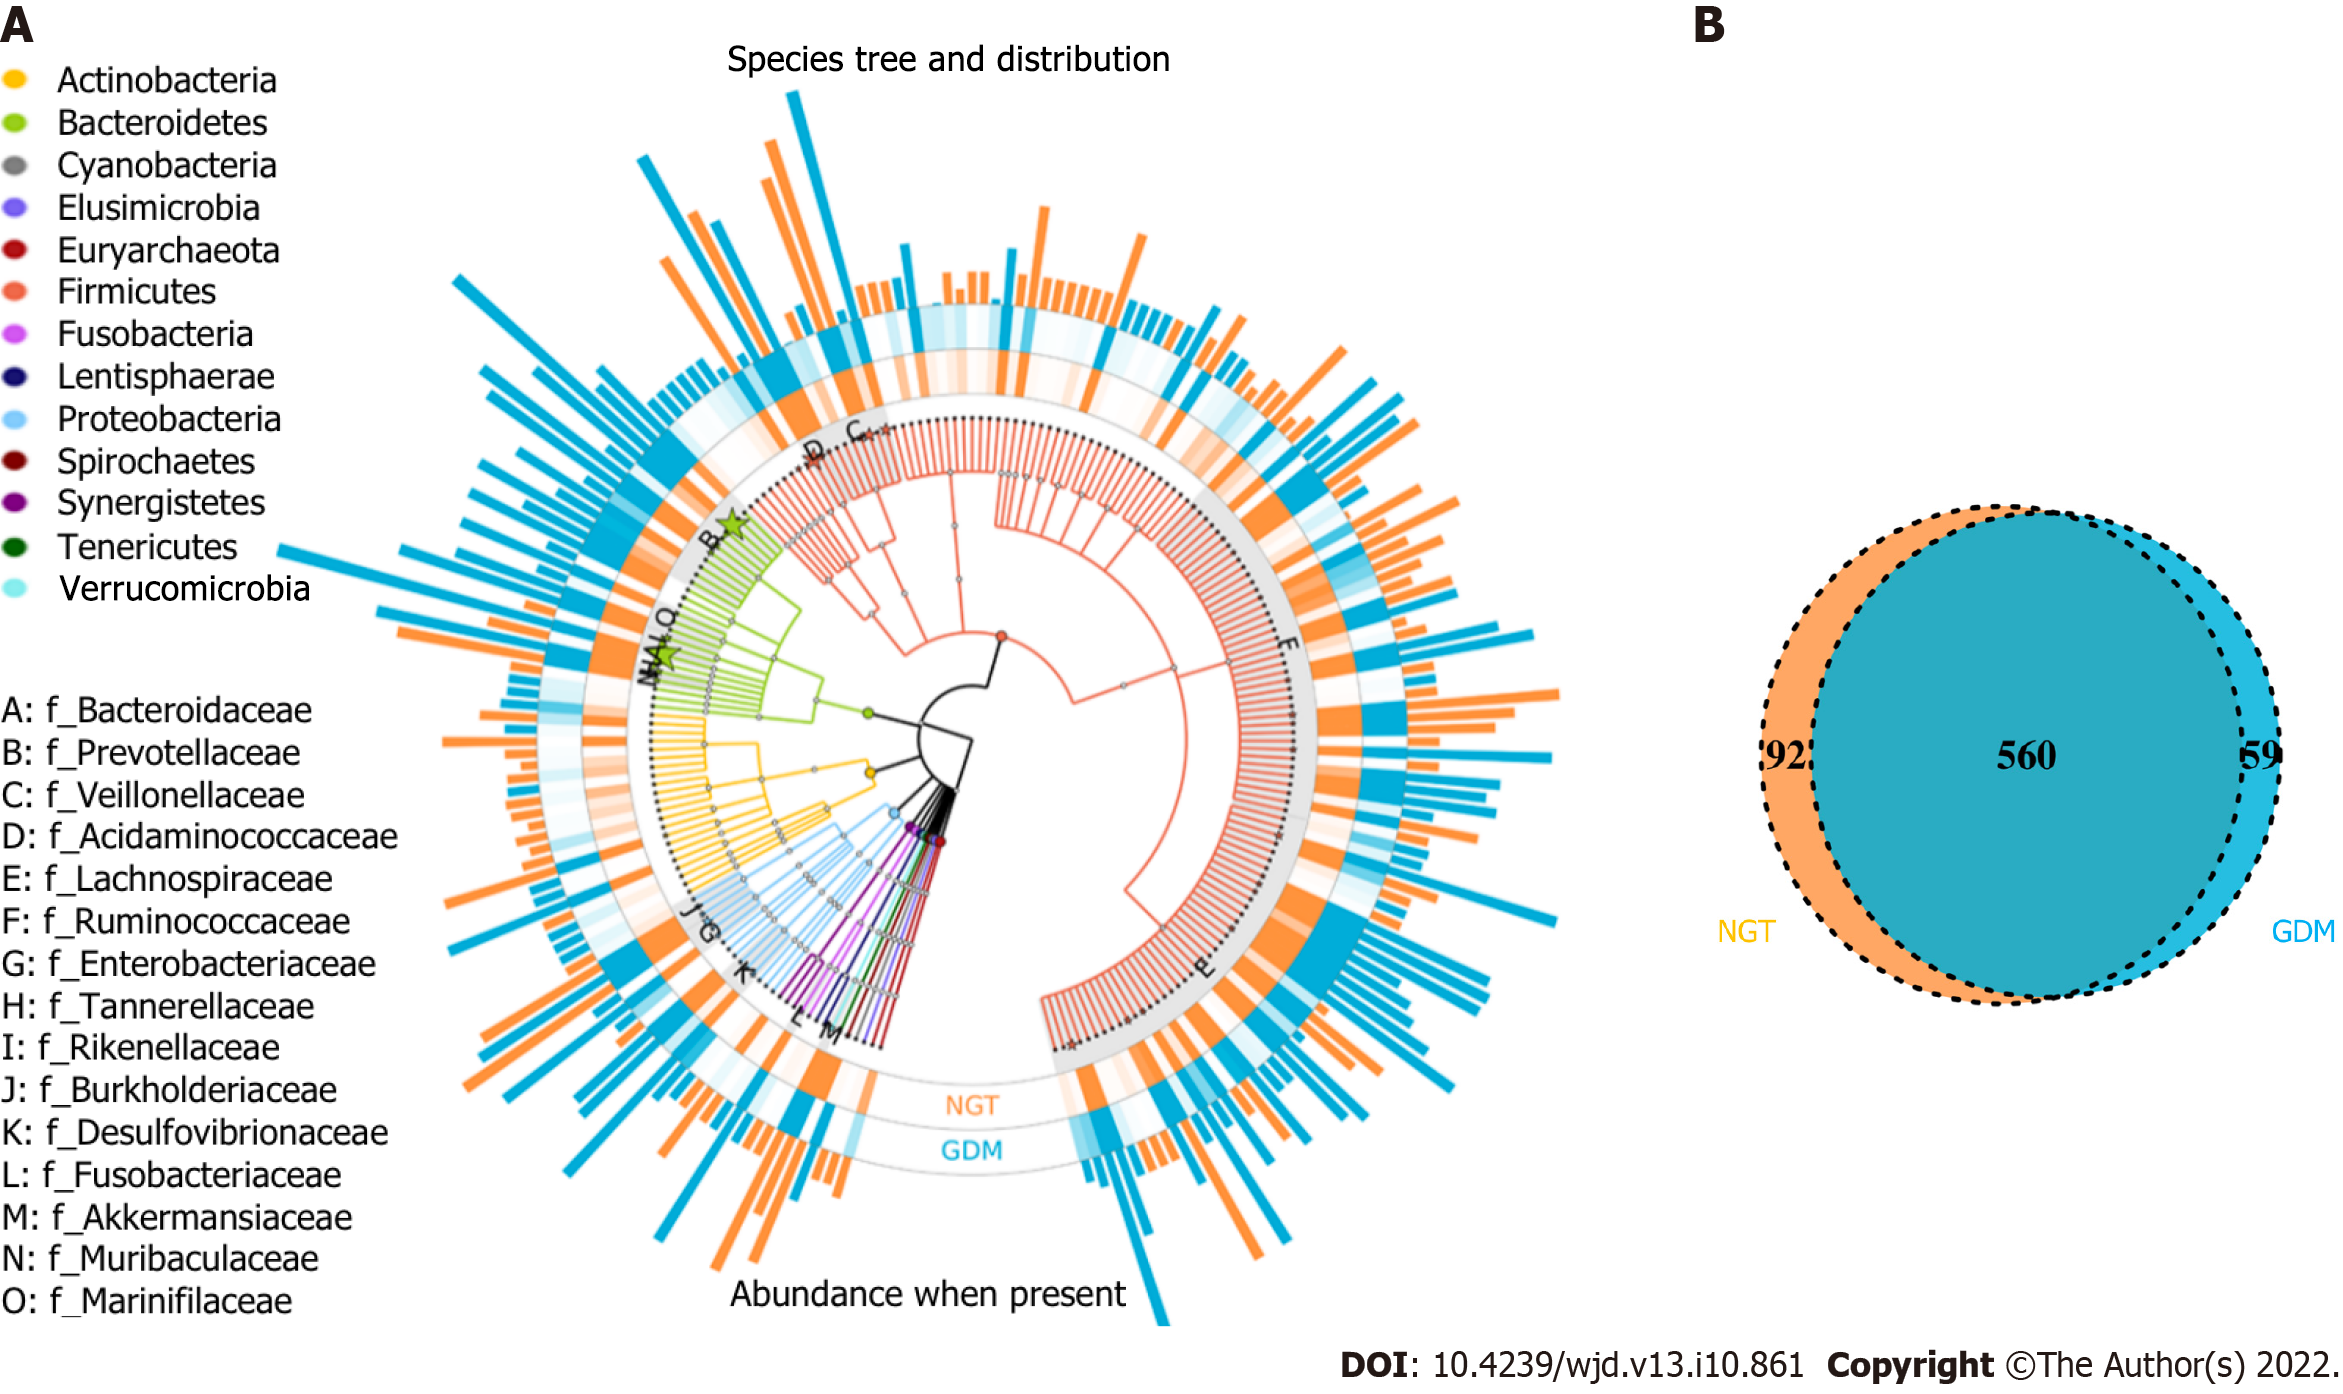
Figure 1 Operational taxonomic units distributions.
A: Species tree and distribution of the gut microbial community; B: Venn diagram showing the common or specific operational taxonomic units between the groups. NGT: Normal glucose tolerance; GDM: Gestational diabetes mellitus.
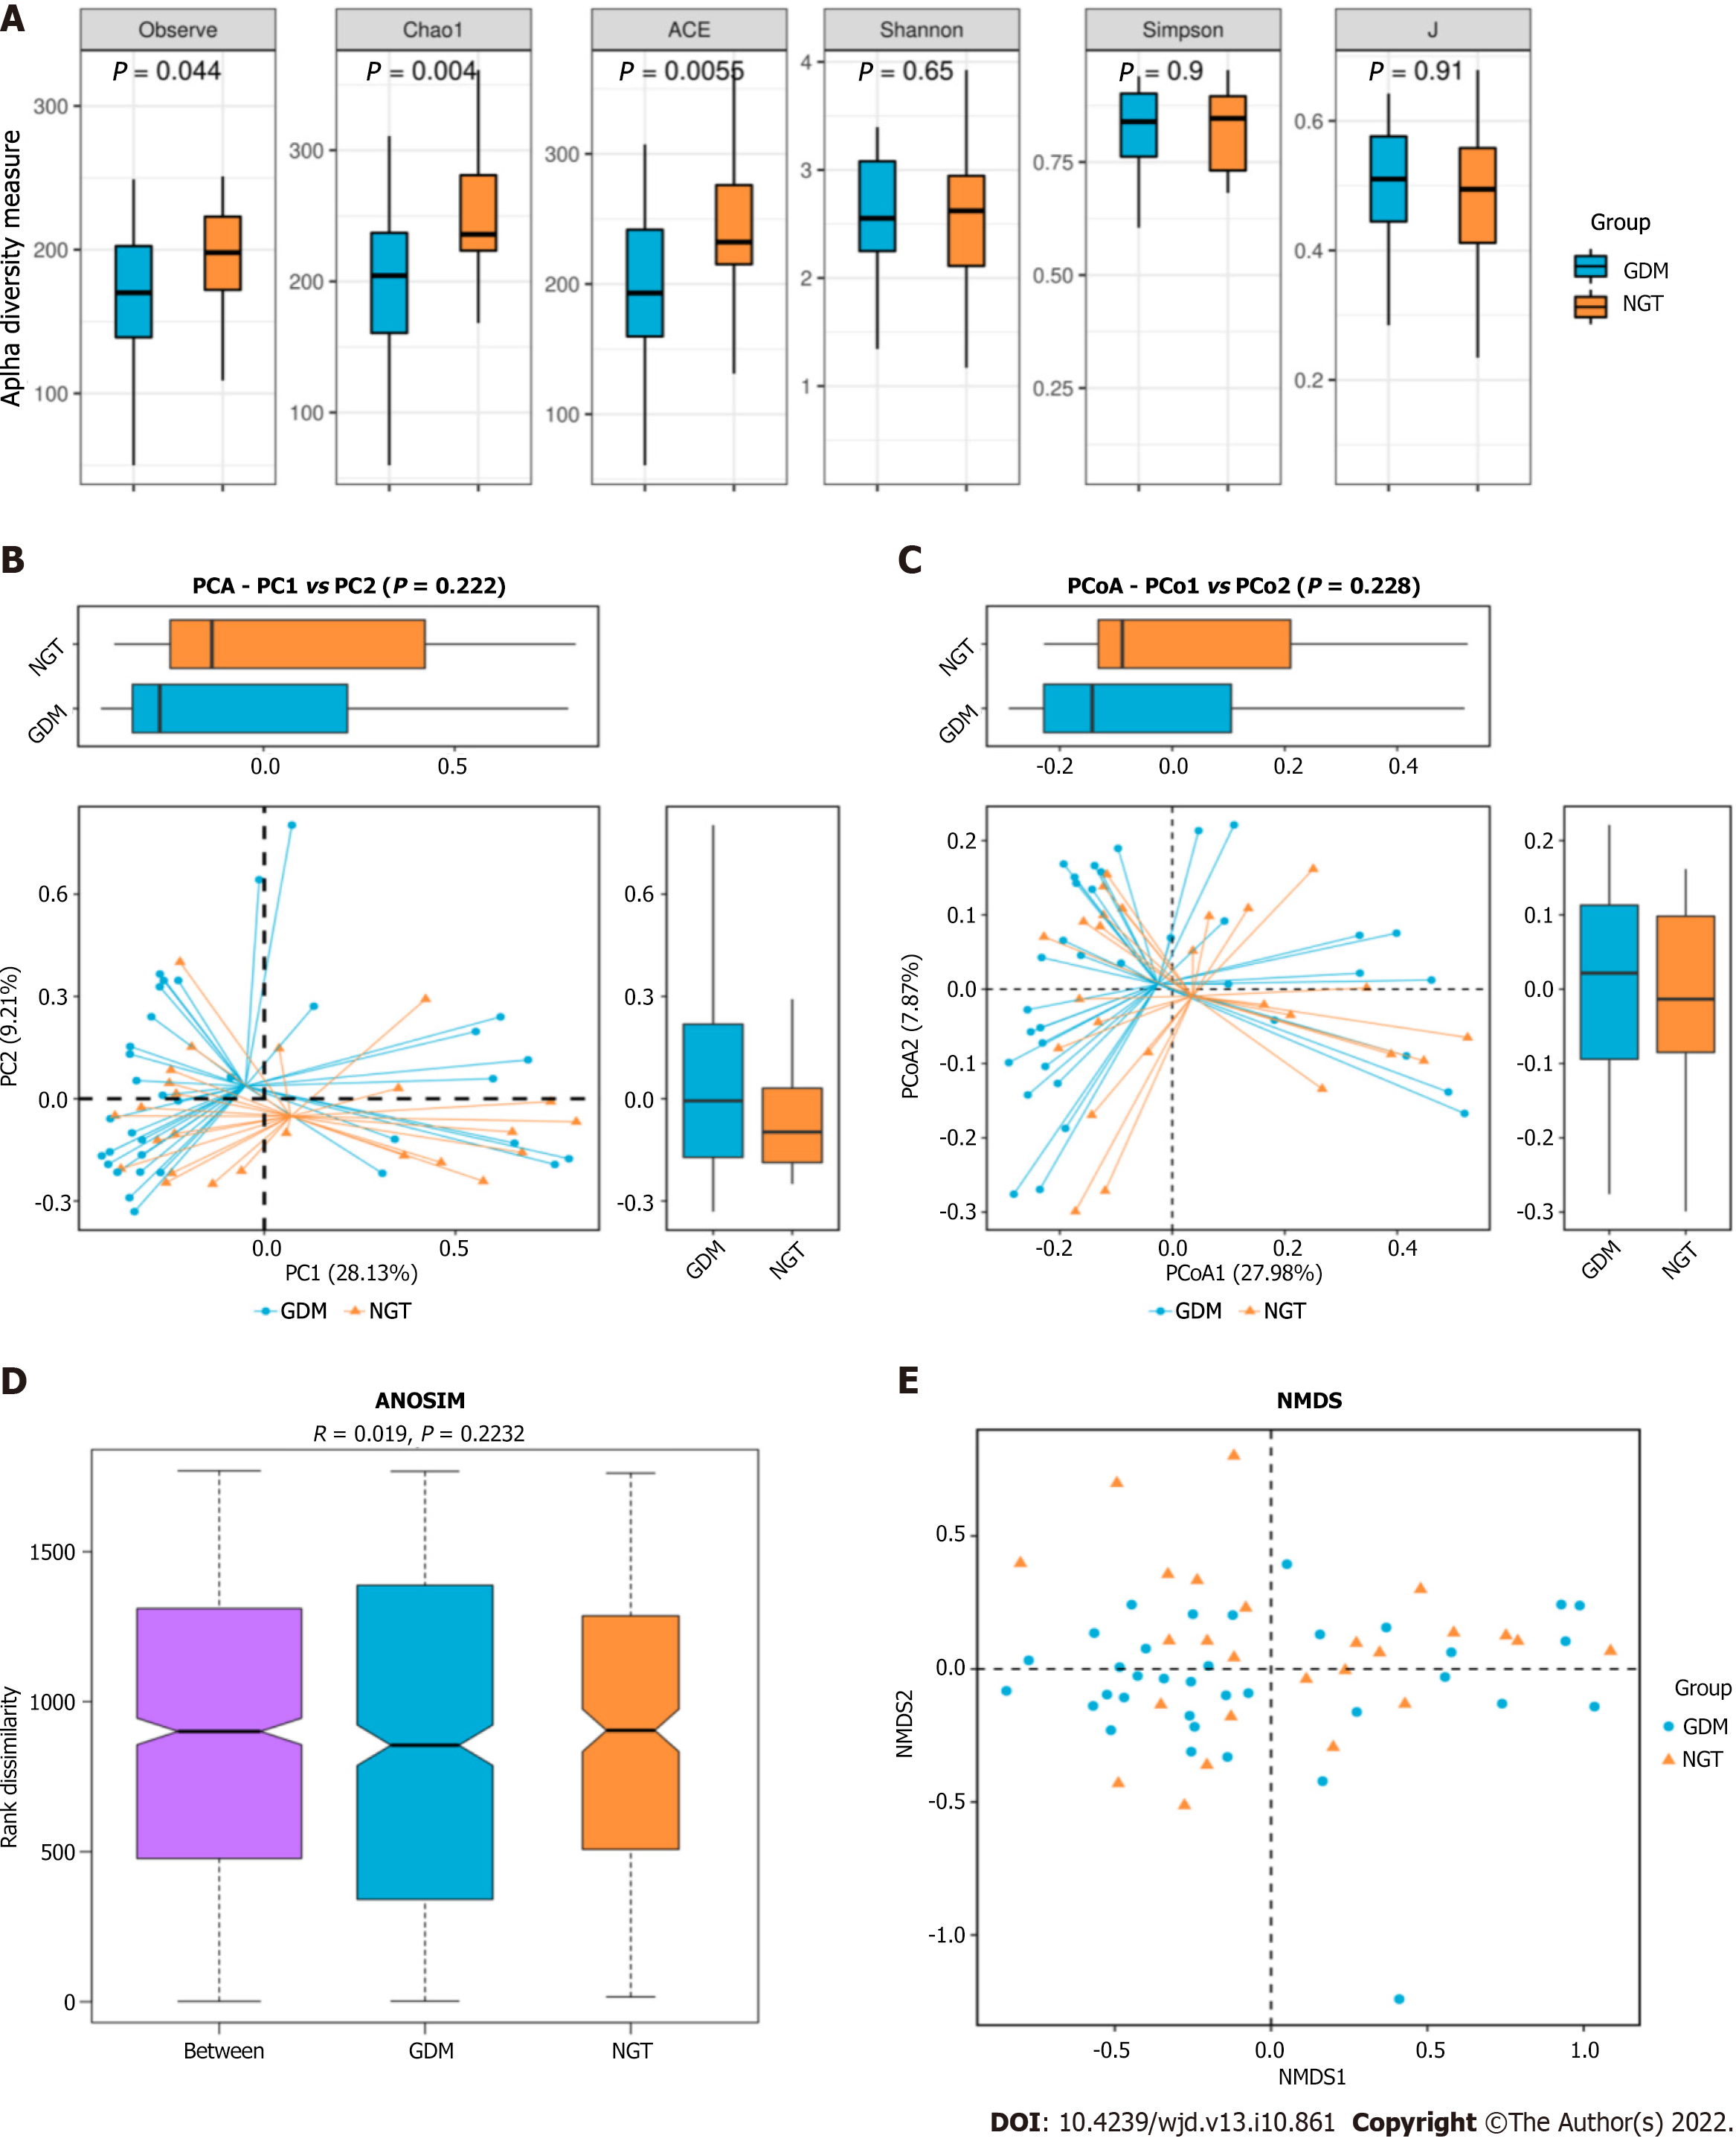
Figure 2 Gut microbiota alpha and beta diversity indices in patients with gestational diabetes mellitus.
A: Gut microbiota alpha diversity indices in patients with gestational diabetes mellitus. The Observed_species, ACE, Chao1, Simpson, Shannon, and J values are shown; B: Principal component analysis score plot based on the relative abundance of operational taxonomic units (97% similarity levels); C: Principal coordinate analysis; D: Similarities analysis; E: Non-metric multidimensional scaling. NGT: Normal glucose tolerance; GDM: Gestational diabetes mellitus; PCoA: Principal coordinate analysis; PCA: Principal component analysis.
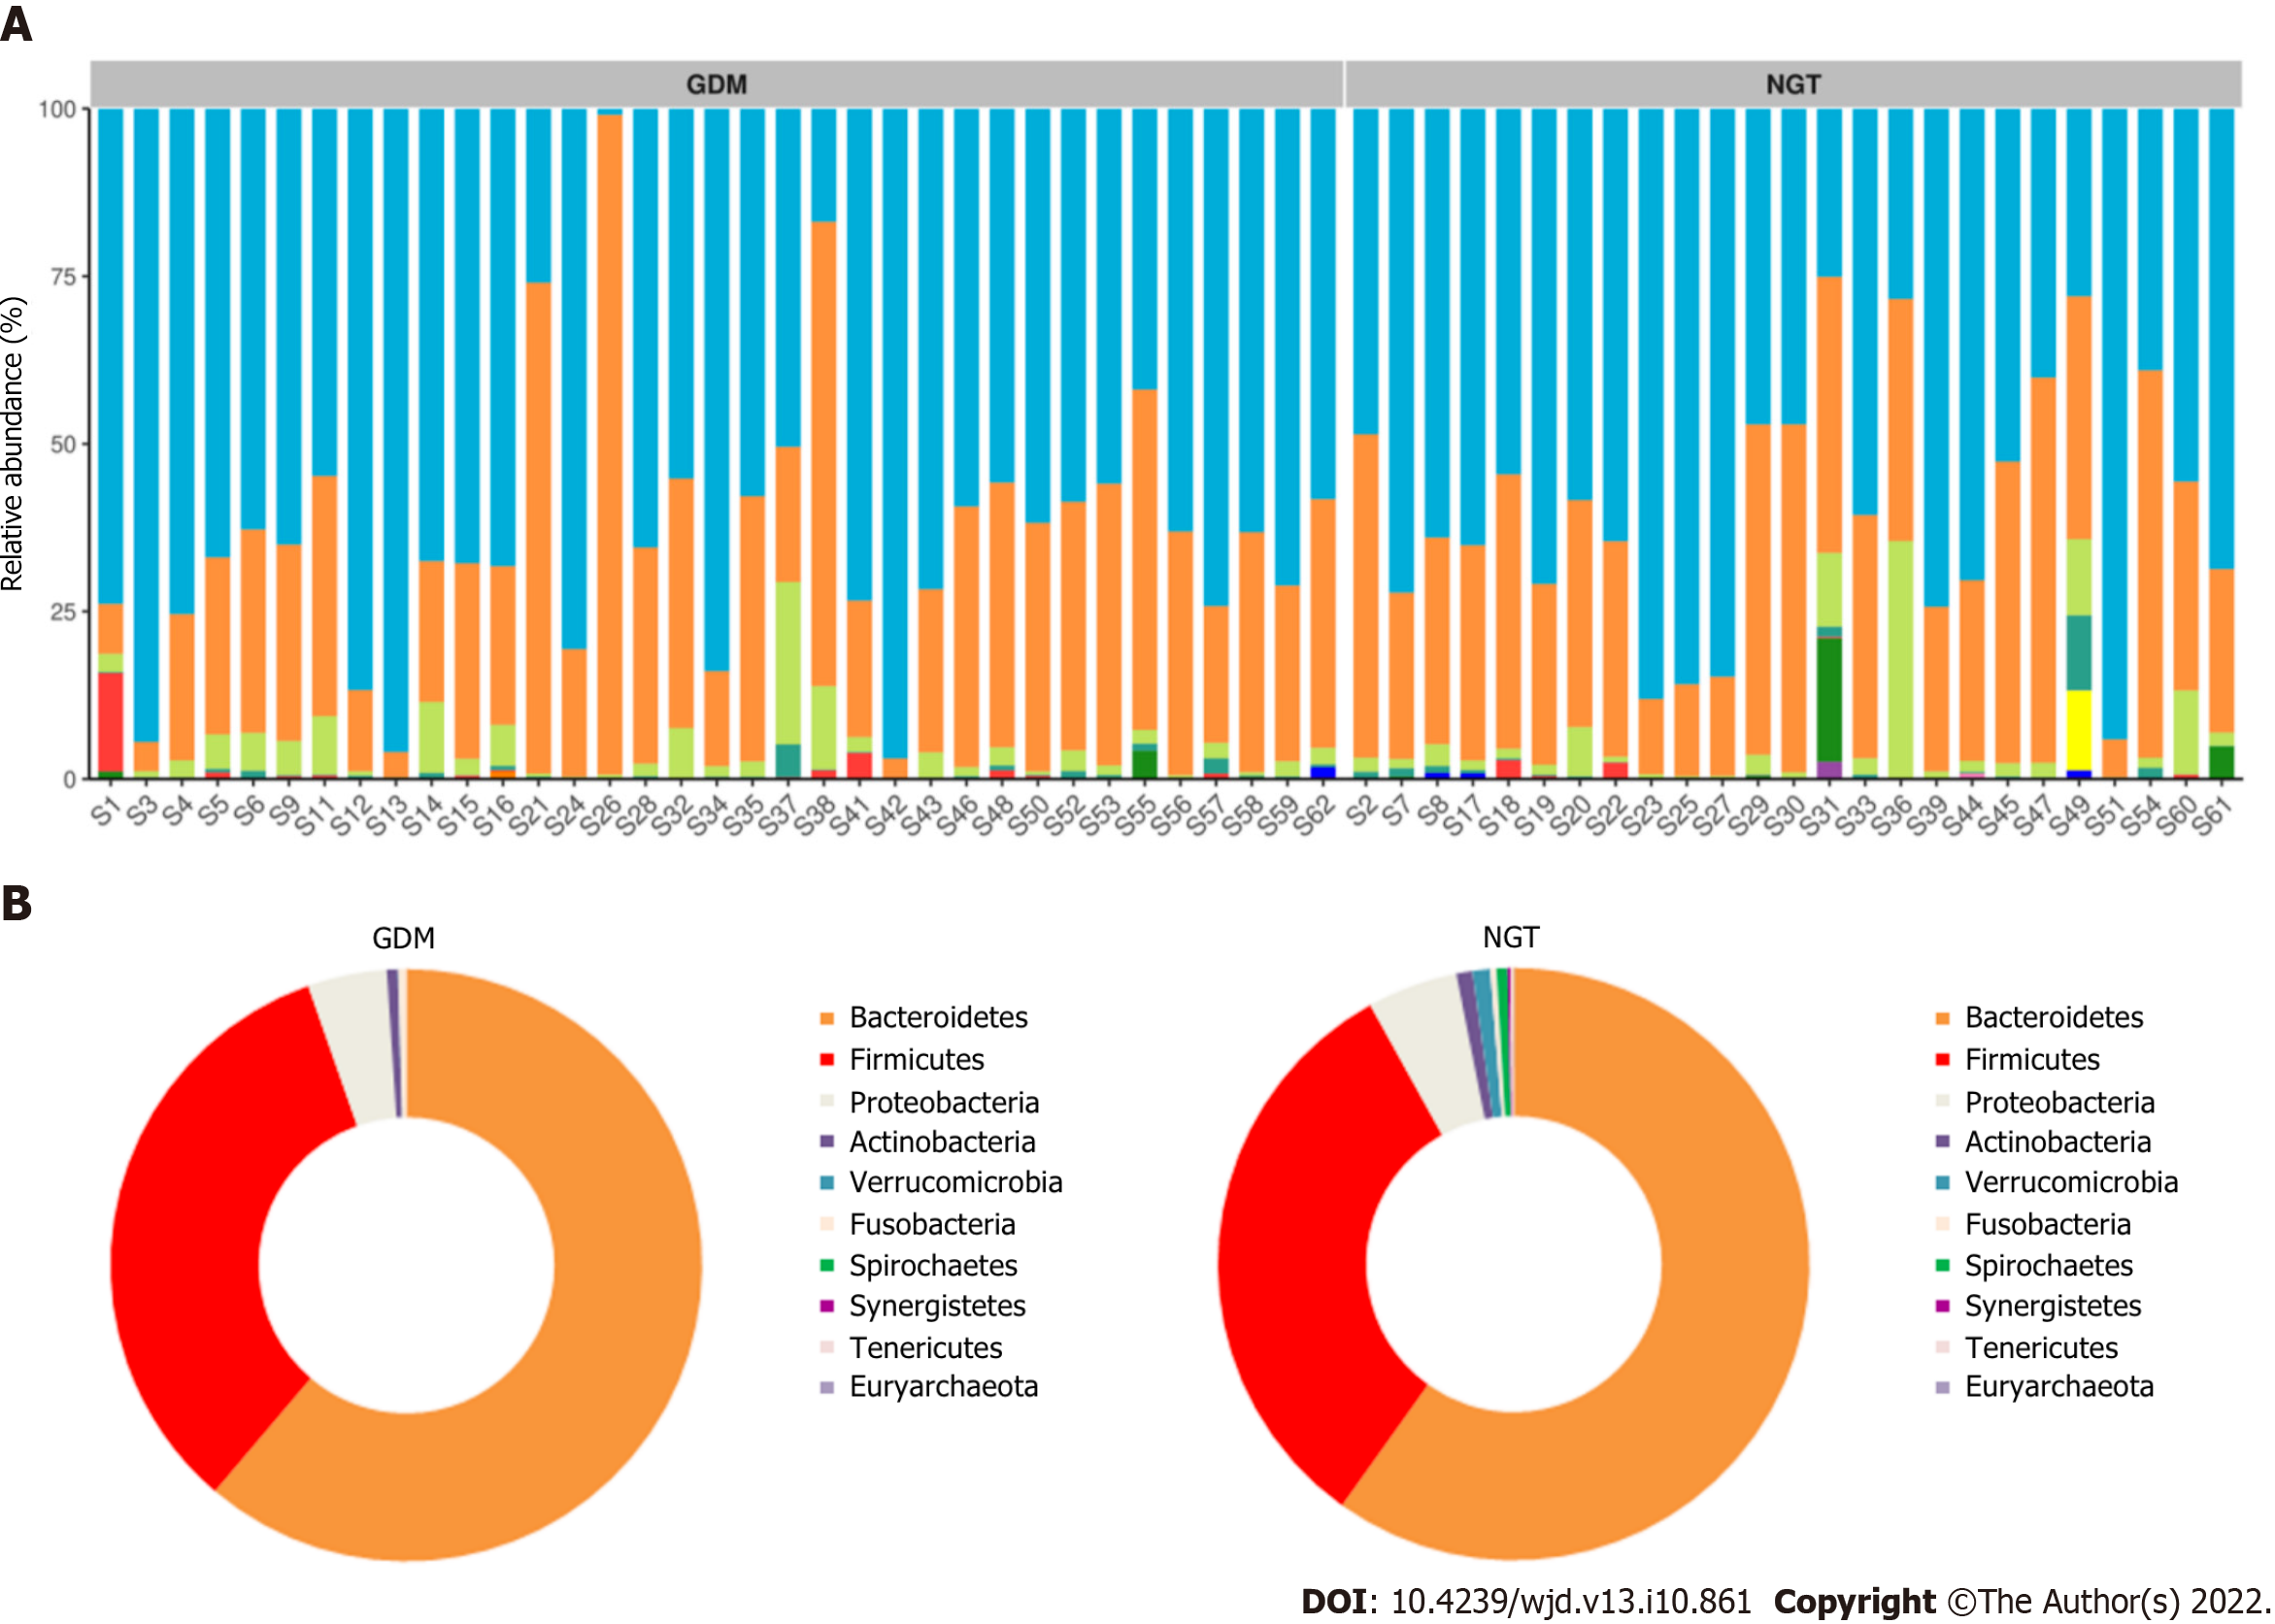
Figure 3 Taxonomy.
A: Top eight abundant species at the phylum level; B: Different bacteria were compared between each group at the phylum level. NGT: Normal glucose tolerance; GDM: Gestational diabetes mellitus.
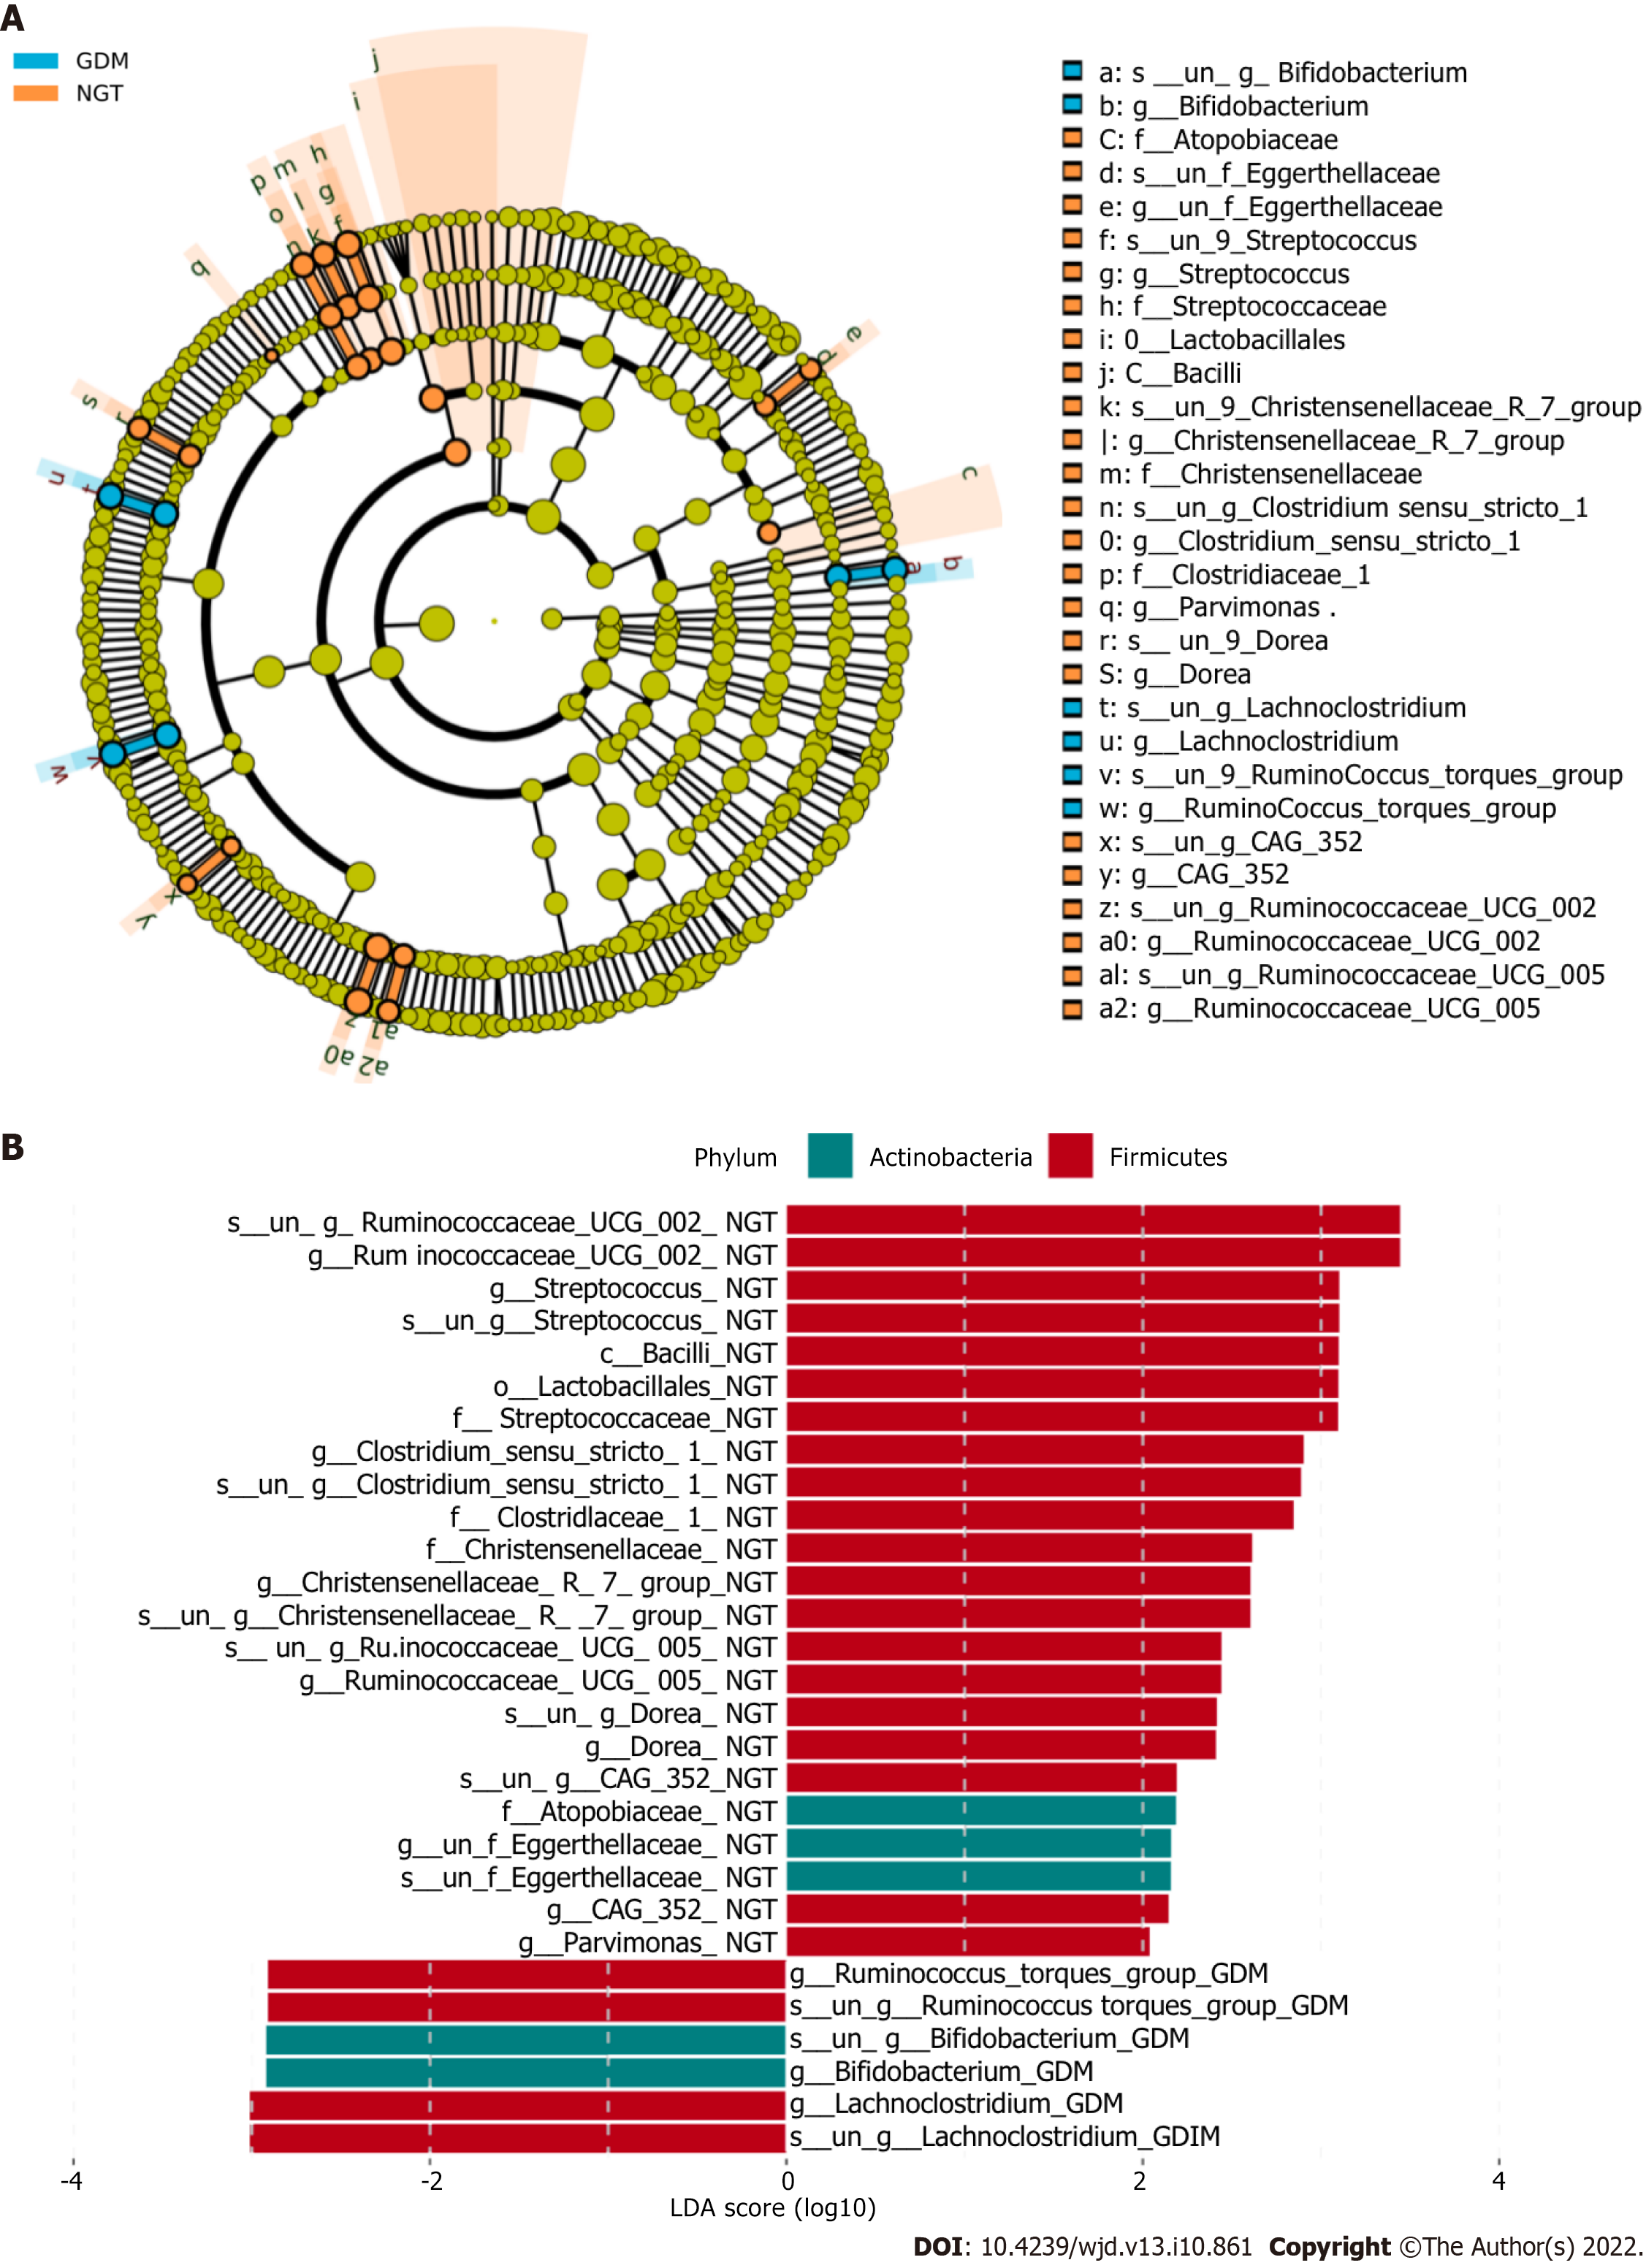
Figure 4 LEfSE analysis to determine which bacterial taxa differ significantly between the groups.
A: At the family level, a greater number of different families were identified between the normal glucose tolerance (NGT) and gestational diabetes mellitus groups (GDM); B: The bacterial taxa whose levels differed significantly between the NGT and GDM groups were identified by LEfSE analysis. NGT: Normal glucose tolerance; GDM: Gestational diabetes mellitus; LDA: Linear discriminant analysis.
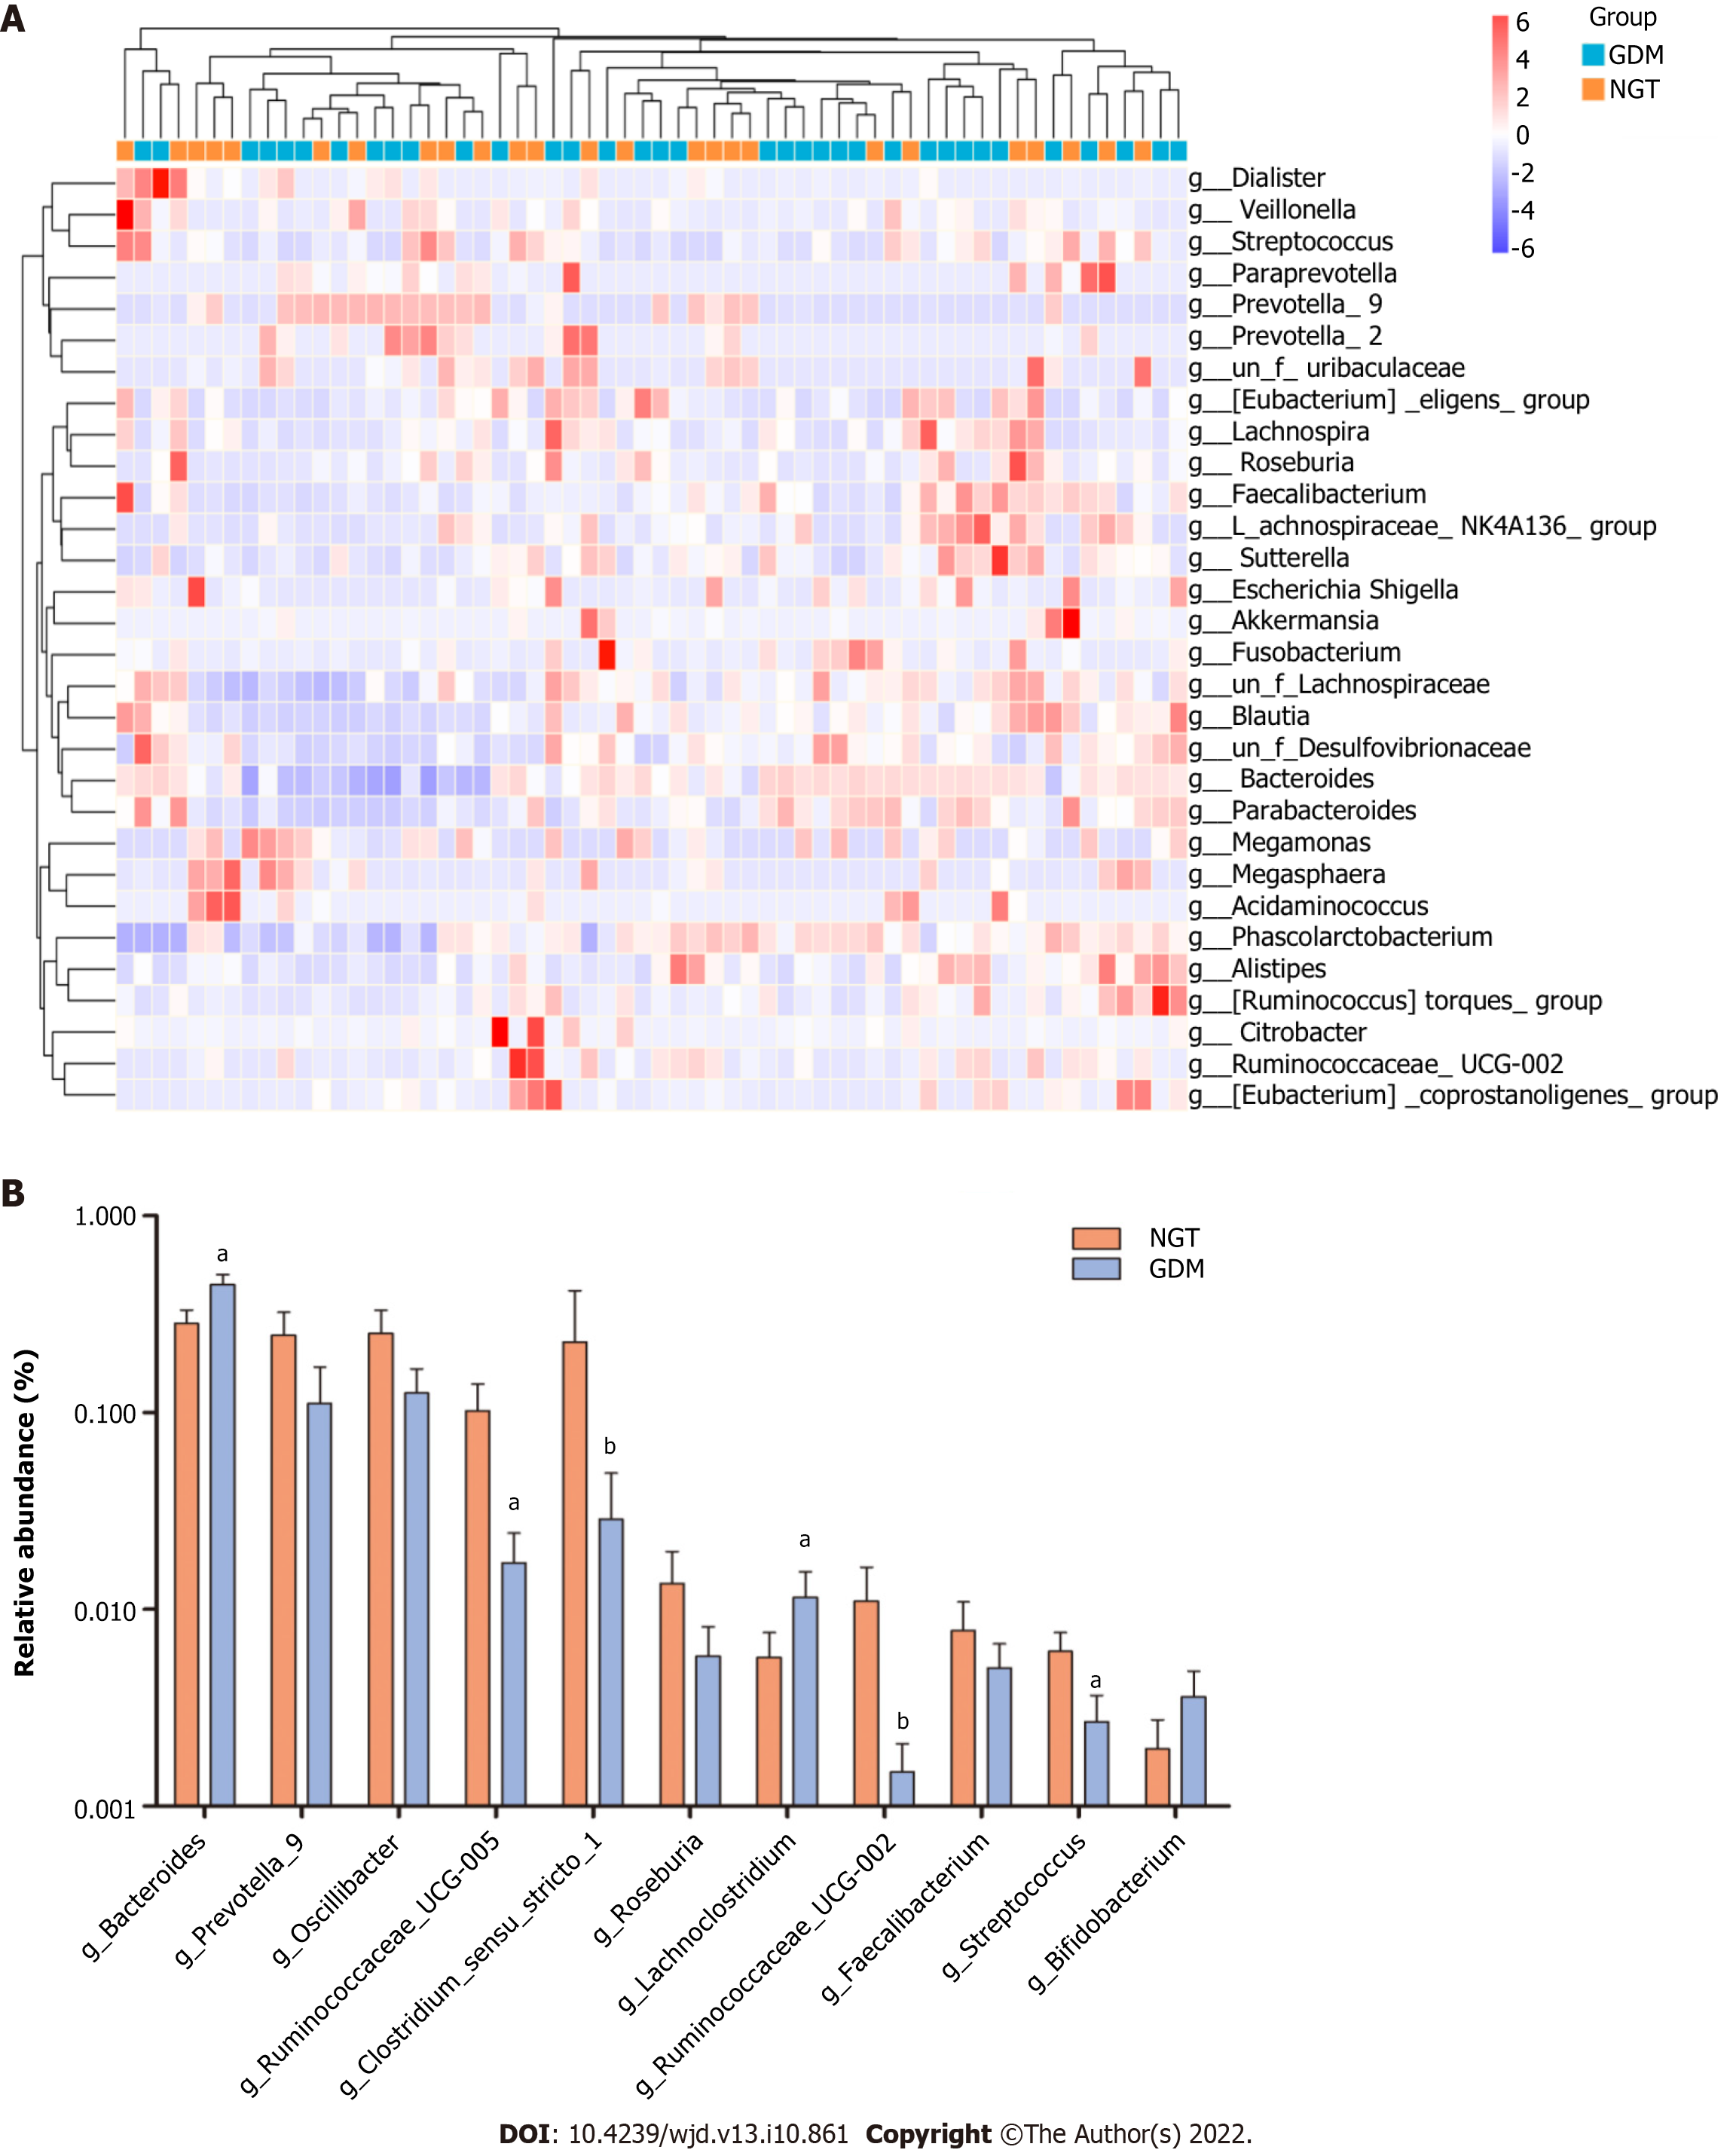
Figure 5 Bacterial genera exhibit significant differences between the two groups.
A: Heatmap showing the relative total abundance of the first 30 genera; B: Microbial community at the genus level between groups. aP < 0.05, GDM group compared with NGT group. NGT: Normal glucose tolerance; GDM: Gestational diabetes mellitus.
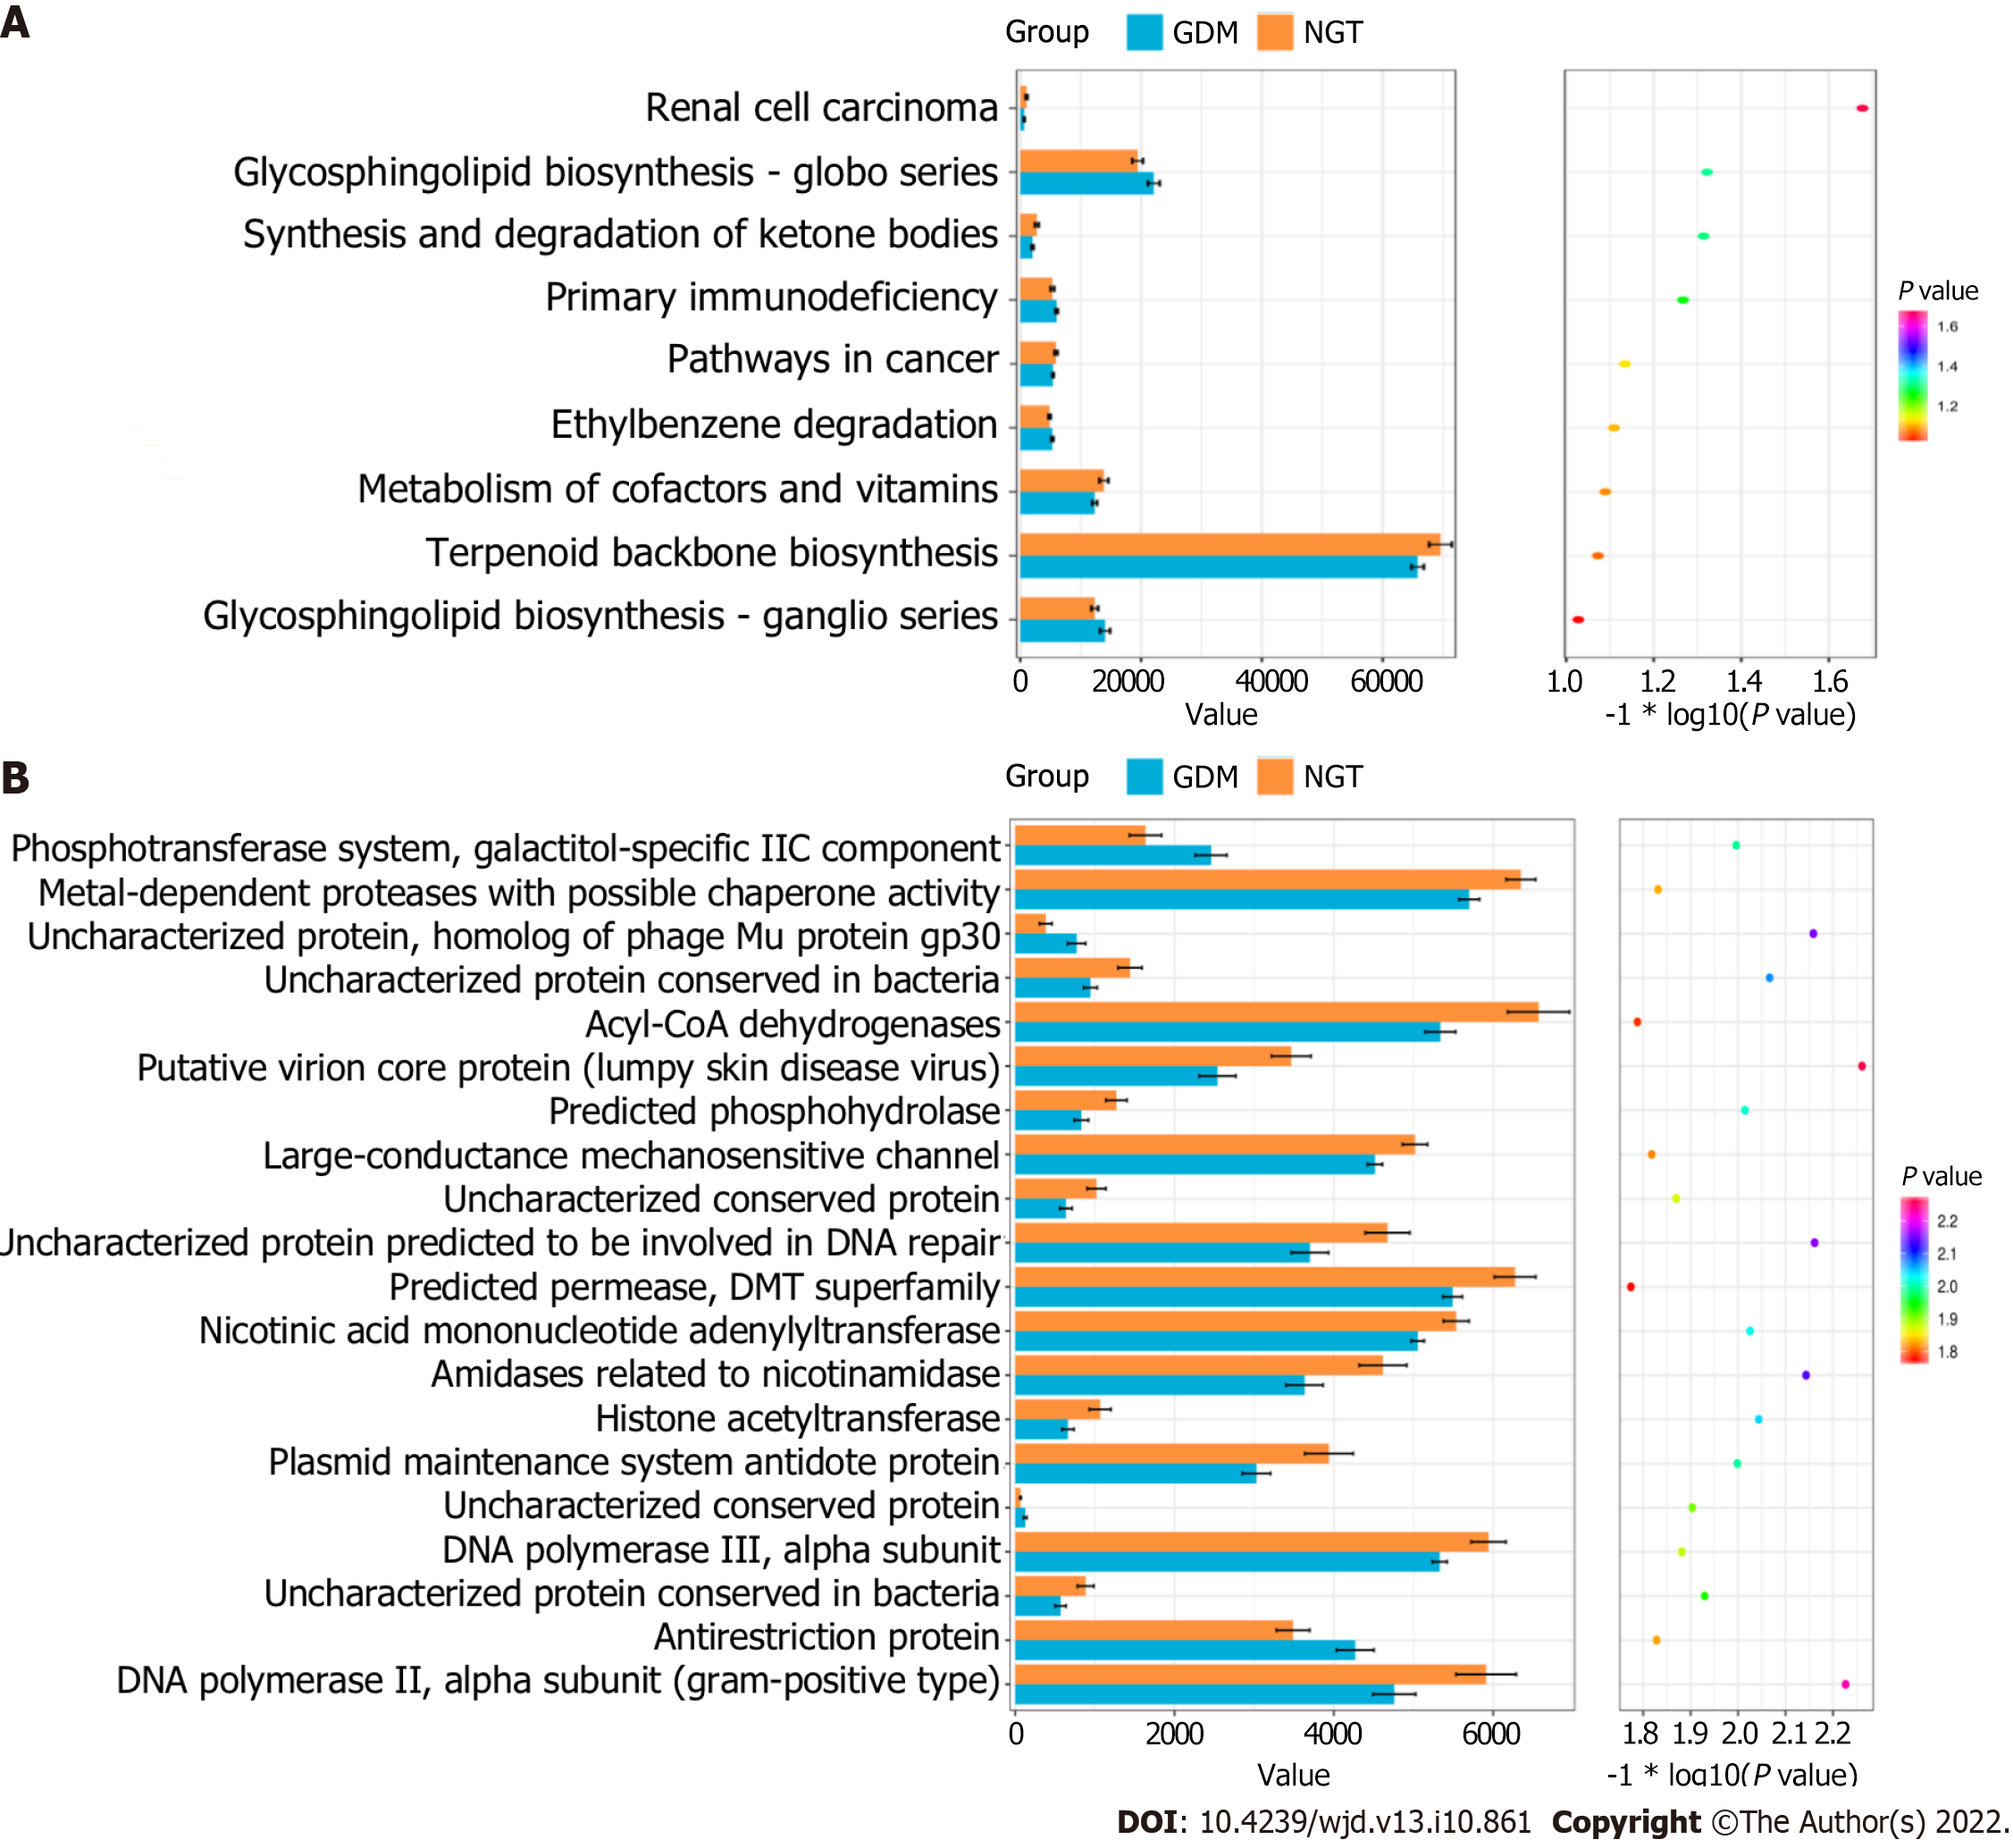
Figure 6 KEGG pathways and COG categories between the GDM and NGT groups.
A: KEGG pathway; B: COG categories. NGT: Normal glucose tolerance; GDM: Gestational diabetes mellitus.
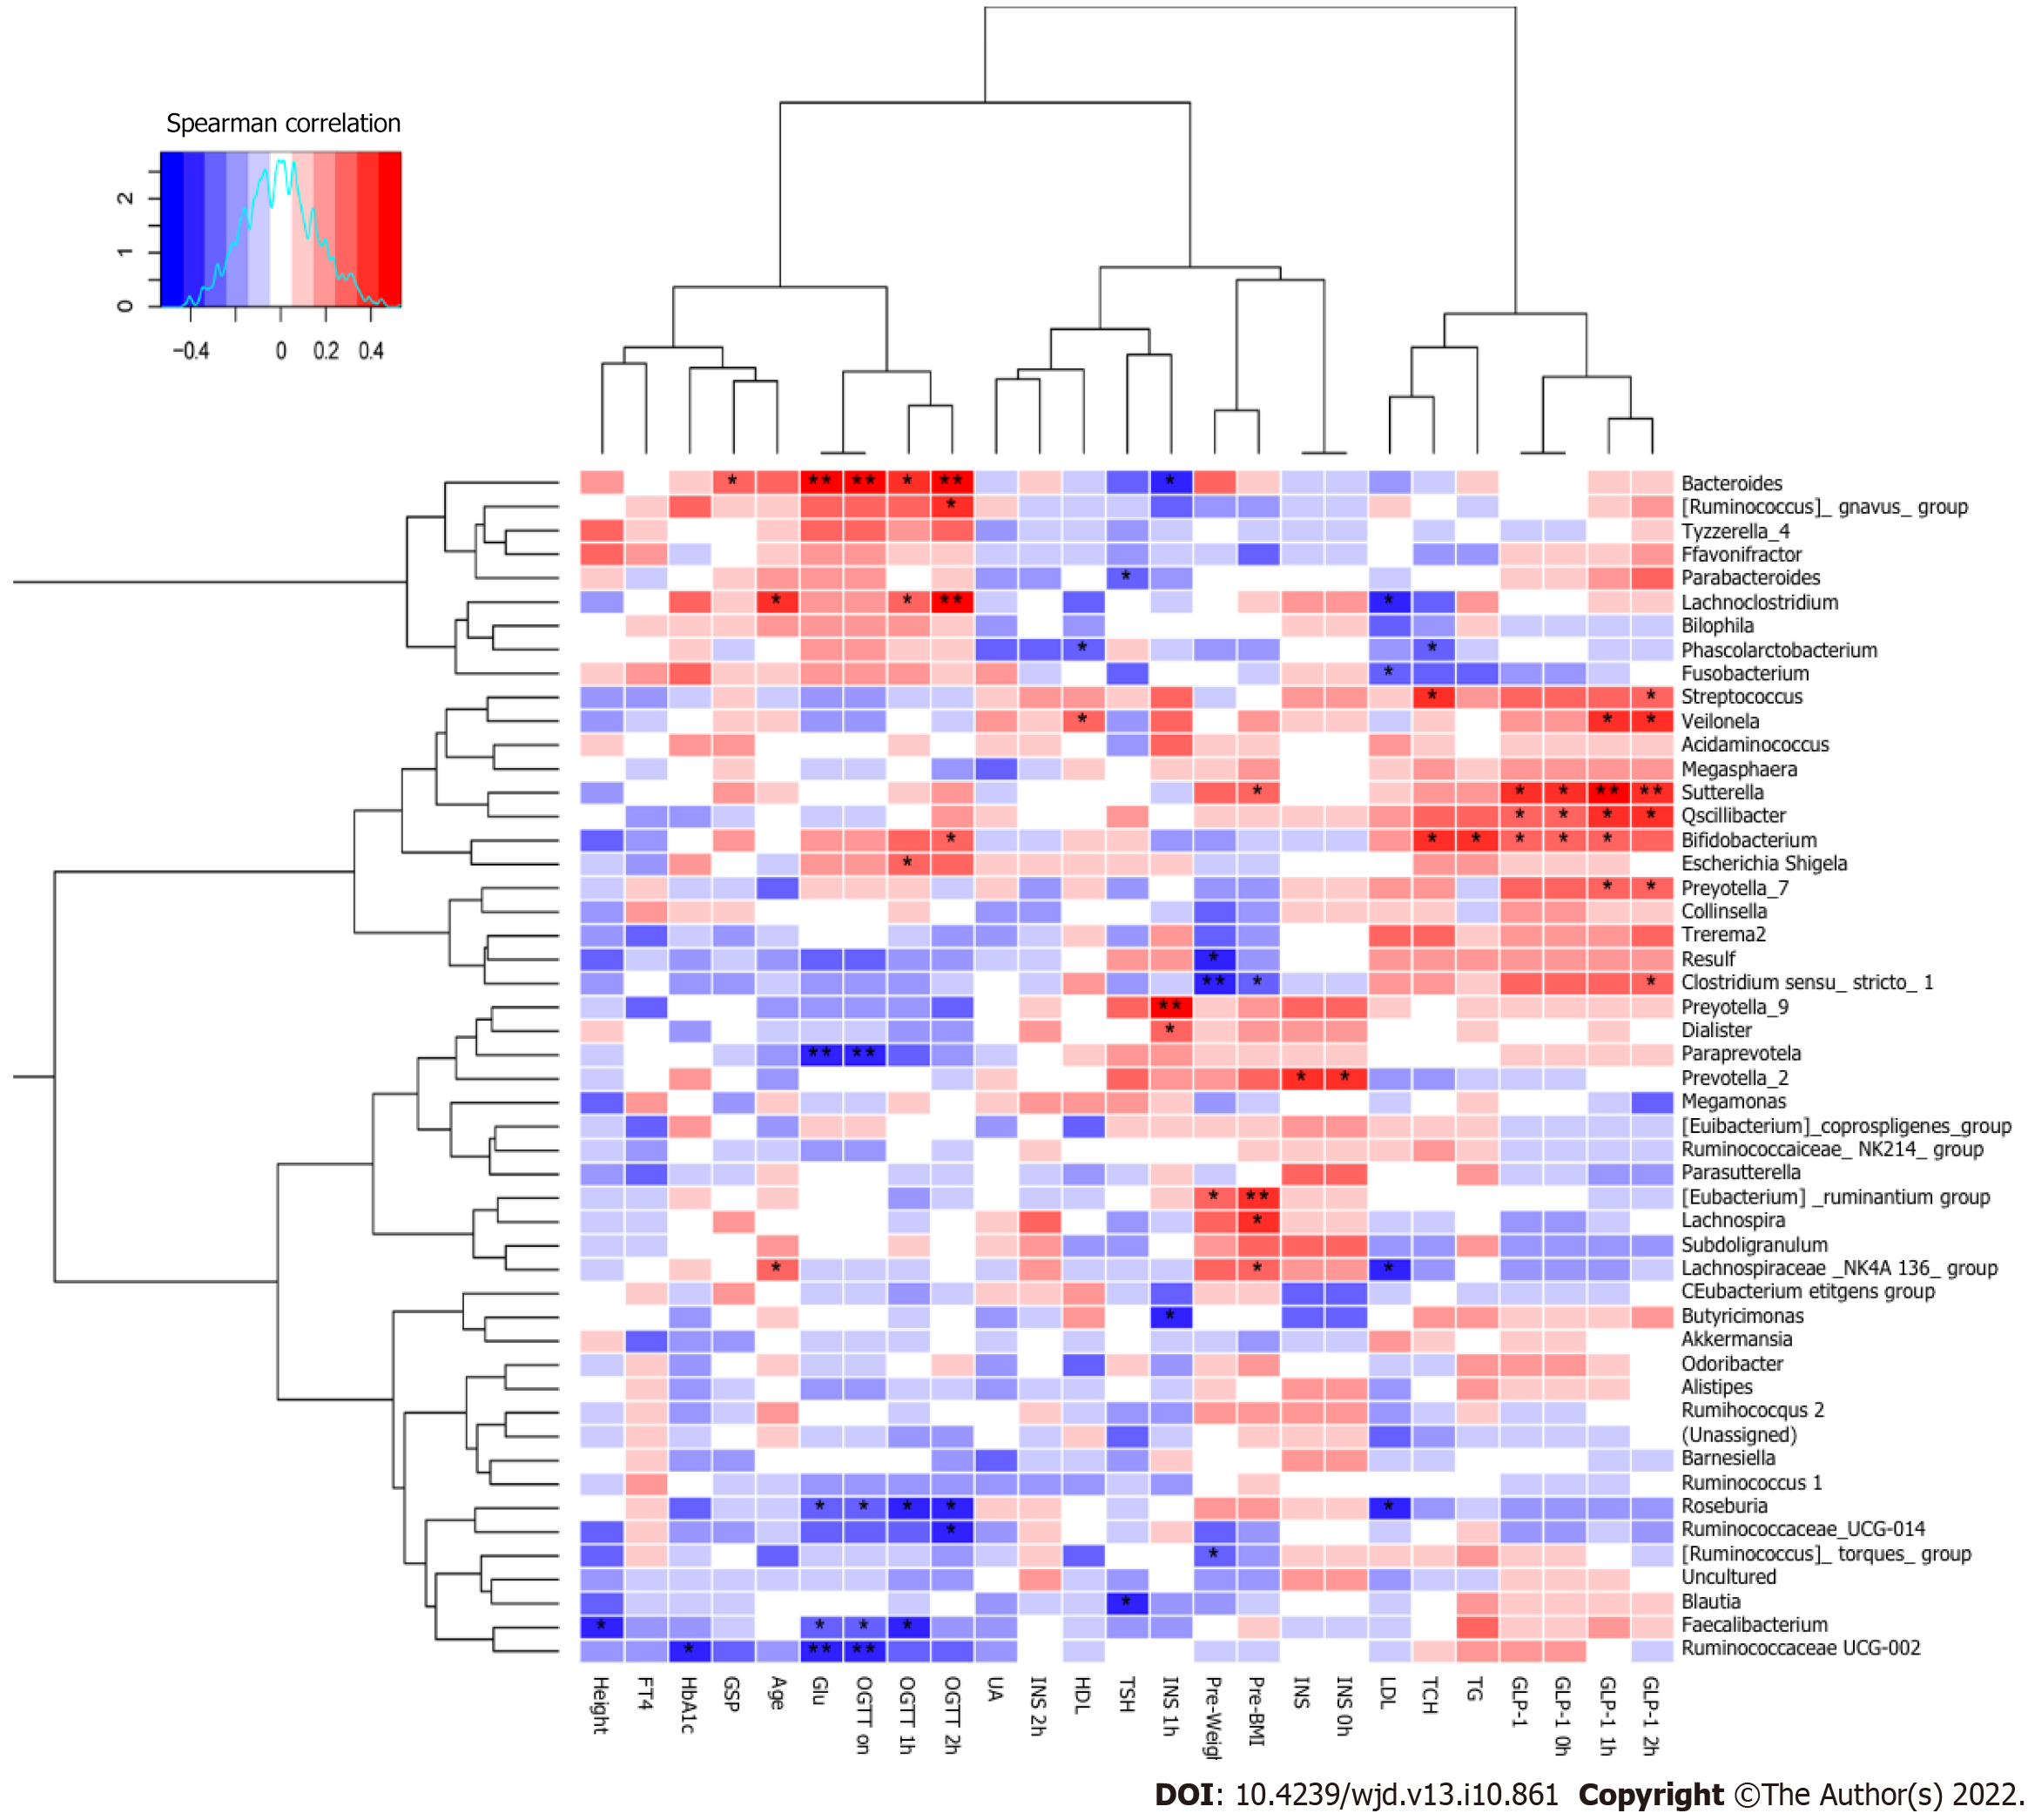
Figure 7 Spearman’s correlations between different dominant genera and blood biochemical traits.
aP < 0.05, bP < 0.01. GDM: Gestational diabetes mellitus; GLP-1: Glucagon-like peptide-1; GSP: Glycosylated serum protein; Glu: Glucose; HbA1c: Hemoglobin A1c; UA: Uric acid; TCH: Total cholesterol; TG: Triglyceride; HDL: High-density lipoprotein; LDL: Low-density lipoprotein; INS: Insulin; OGTT: Oral glucose tolerance test; TSH: Thyroid-stimulating hormone; FT4: Free tetraiodothyronine.
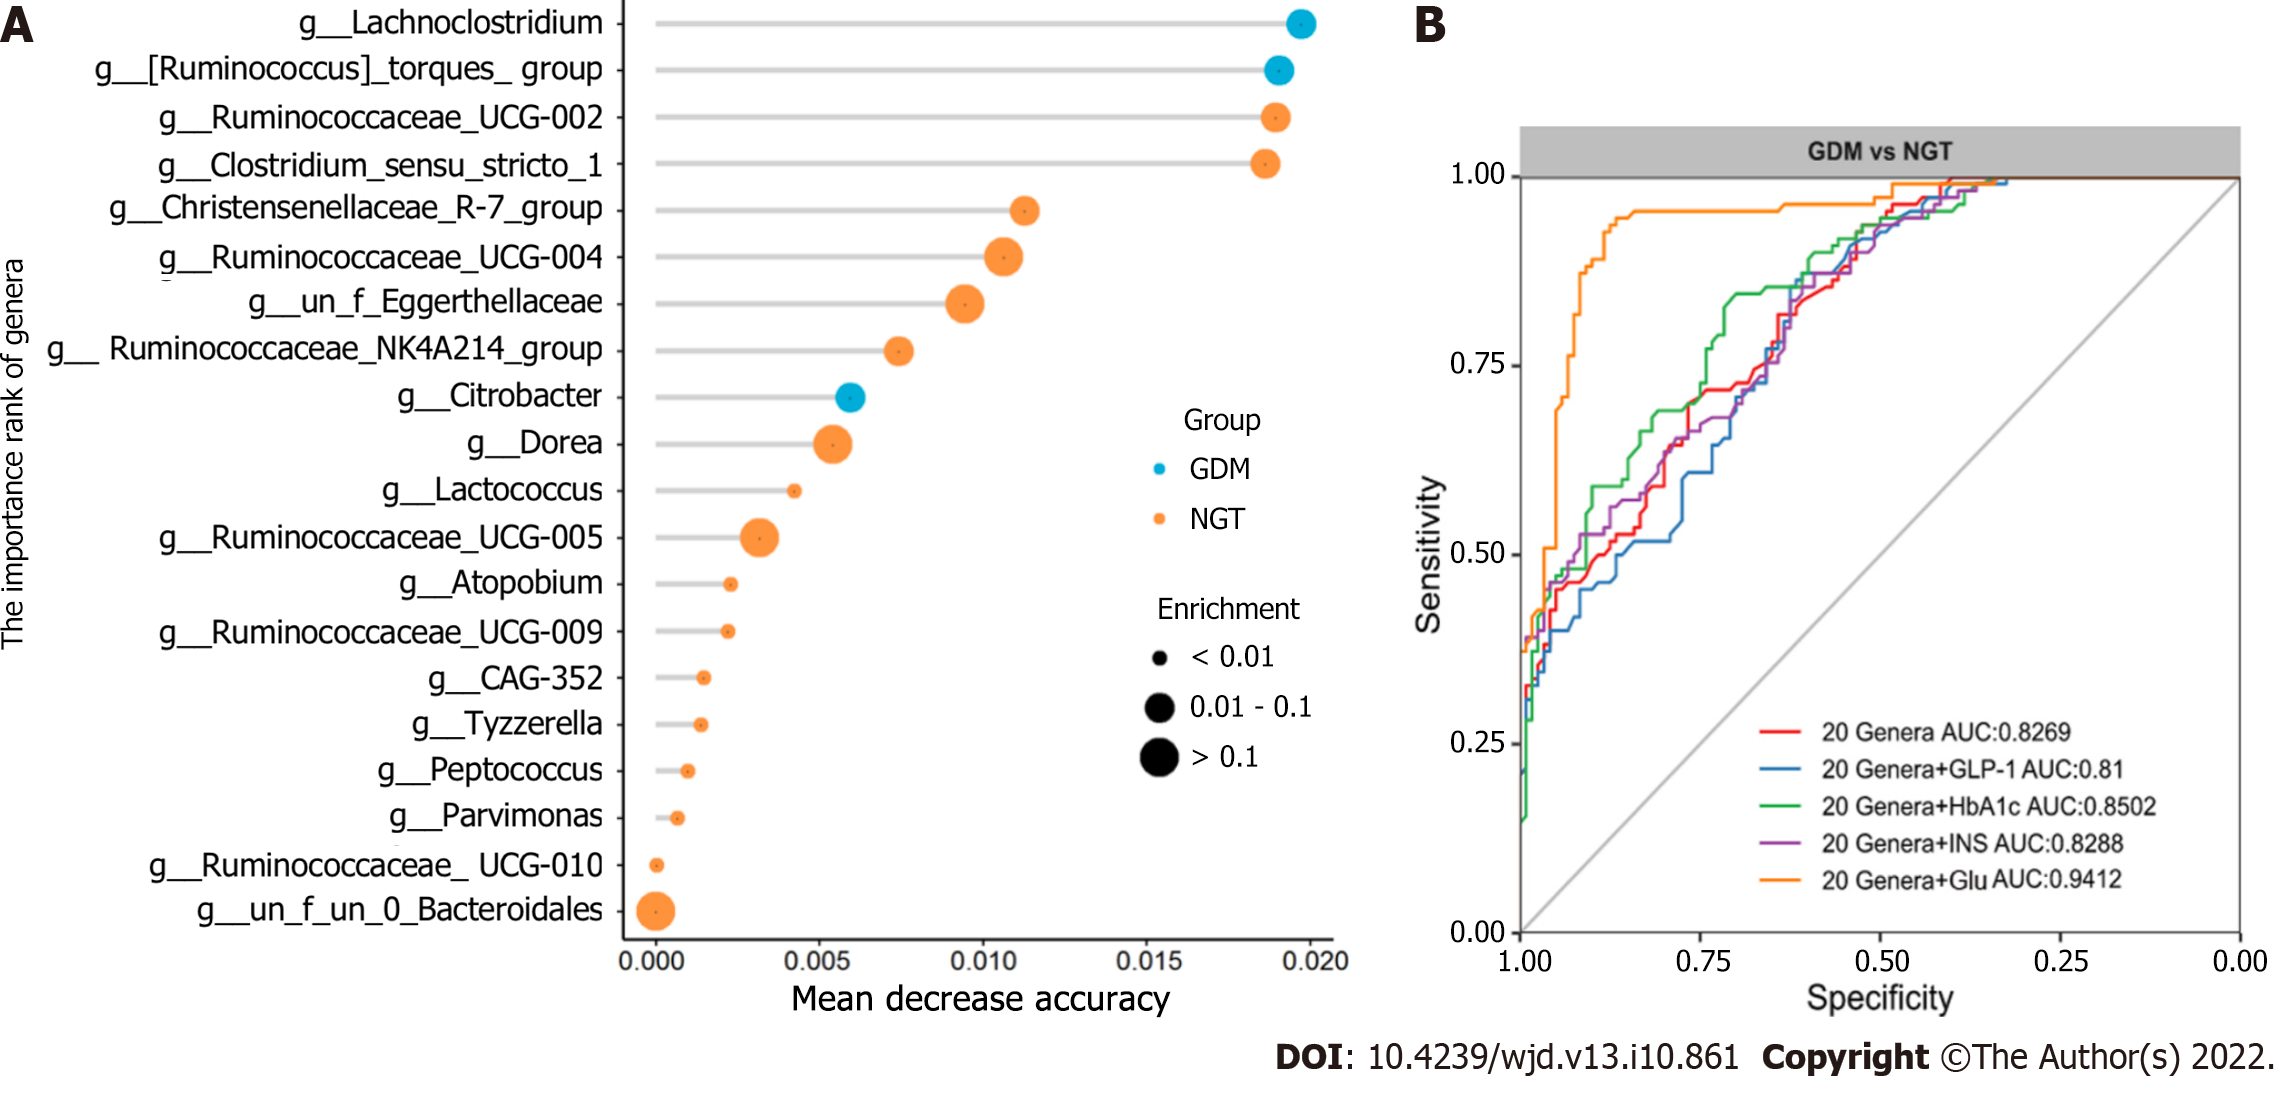
Figure 8 Gut microbiota–based prediction of gestational diabetes mellitus.
A: Identification of gestational diabetes mellitus (GDM) markers by random forest models; B: Receiver operating characteristic (ROC) curves of operational taxonomic units-based diagnostic biomarkers for GDM. NGT: Normal glucose tolerance; GDM: Gestational diabetes mellitus; INS: Insulin; Glu: Glucose; HbA1c: Hemoglobin A1c; GLP-1: Glucagon-like peptide-1.
- Citation: Liang YY, Liu LY, Jia Y, Li Y, Cai JN, Shu Y, Tan JY, Chen PY, Li HW, Cai HH, Cai XS. Correlation between gut microbiota and glucagon-like peptide-1 in patients with gestational diabetes mellitus. World J Diabetes 2022; 13(10): 861-876
- URL: https://www.wjgnet.com/1948-9358/full/v13/i10/861.htm
- DOI: https://dx.doi.org/10.4239/wjd.v13.i10.861


