Copyright
©The Author(s) 2022.
World J Diabetes. Jan 15, 2022; 13(1): 5-26
Published online Jan 15, 2022. doi: 10.4239/wjd.v13.i1.5
Published online Jan 15, 2022. doi: 10.4239/wjd.v13.i1.5
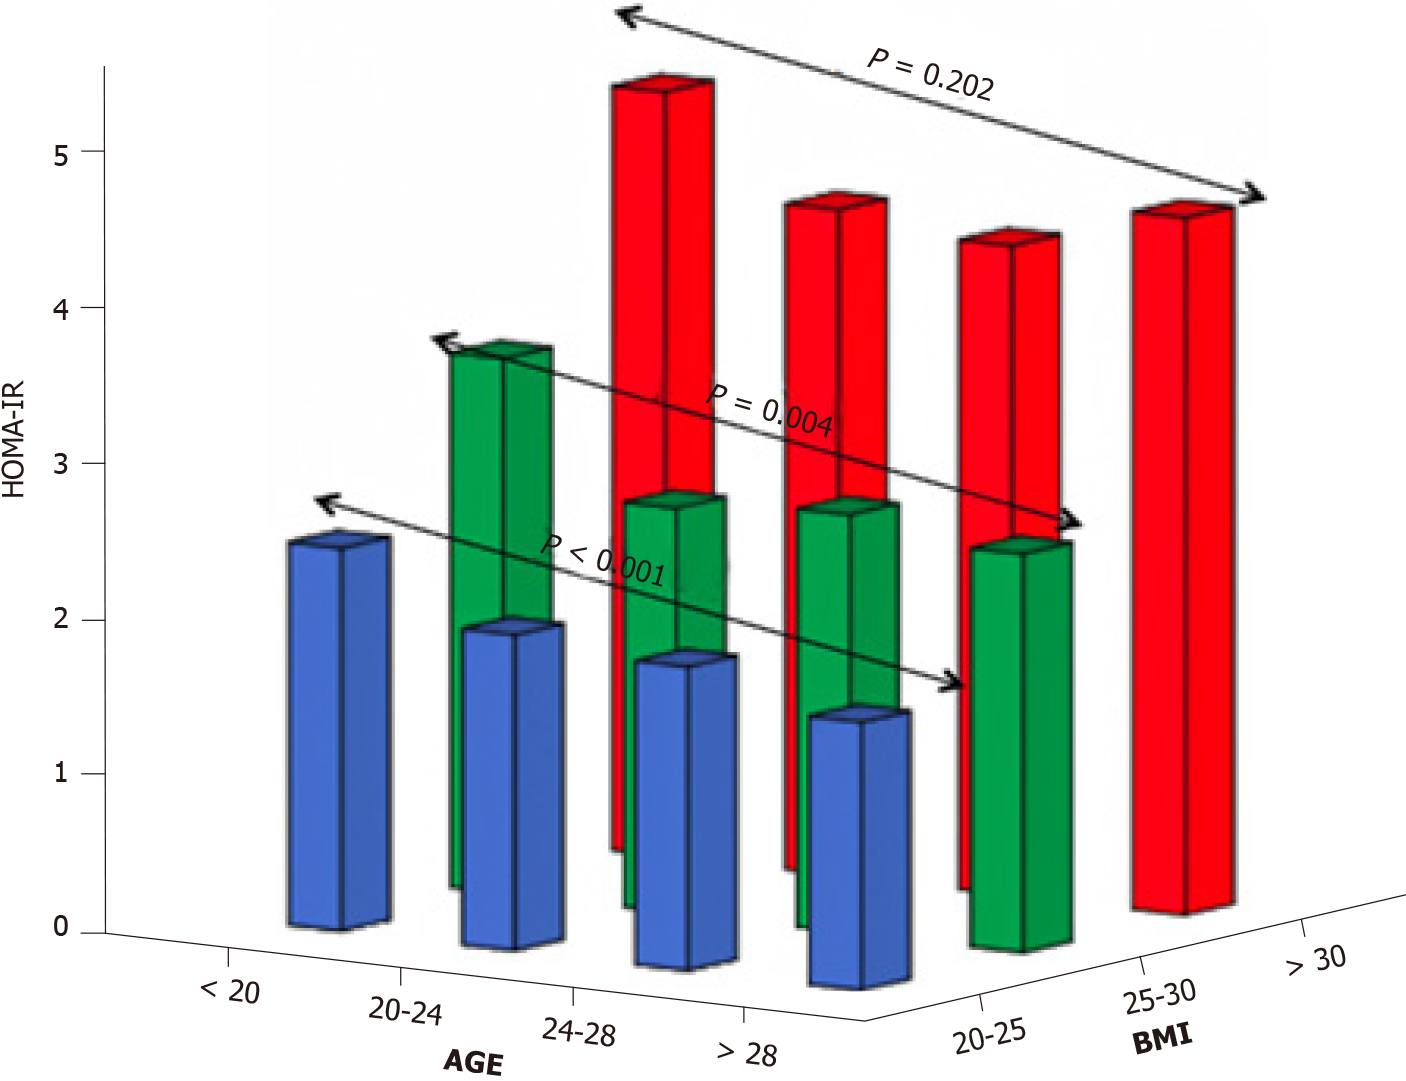
Figure 1 The gradual improvement of insulin resistance over the years in normal weight (blue bars) and overweight (green bars) women with polycystic ovary syndrome, but not in their obese counterparts (red bars).
Adapted from[52]. HOMA-IR: Homeostatic model assessment for insulin resistance; AGE: Advanced glycation end-product; BMI: Body mass index.
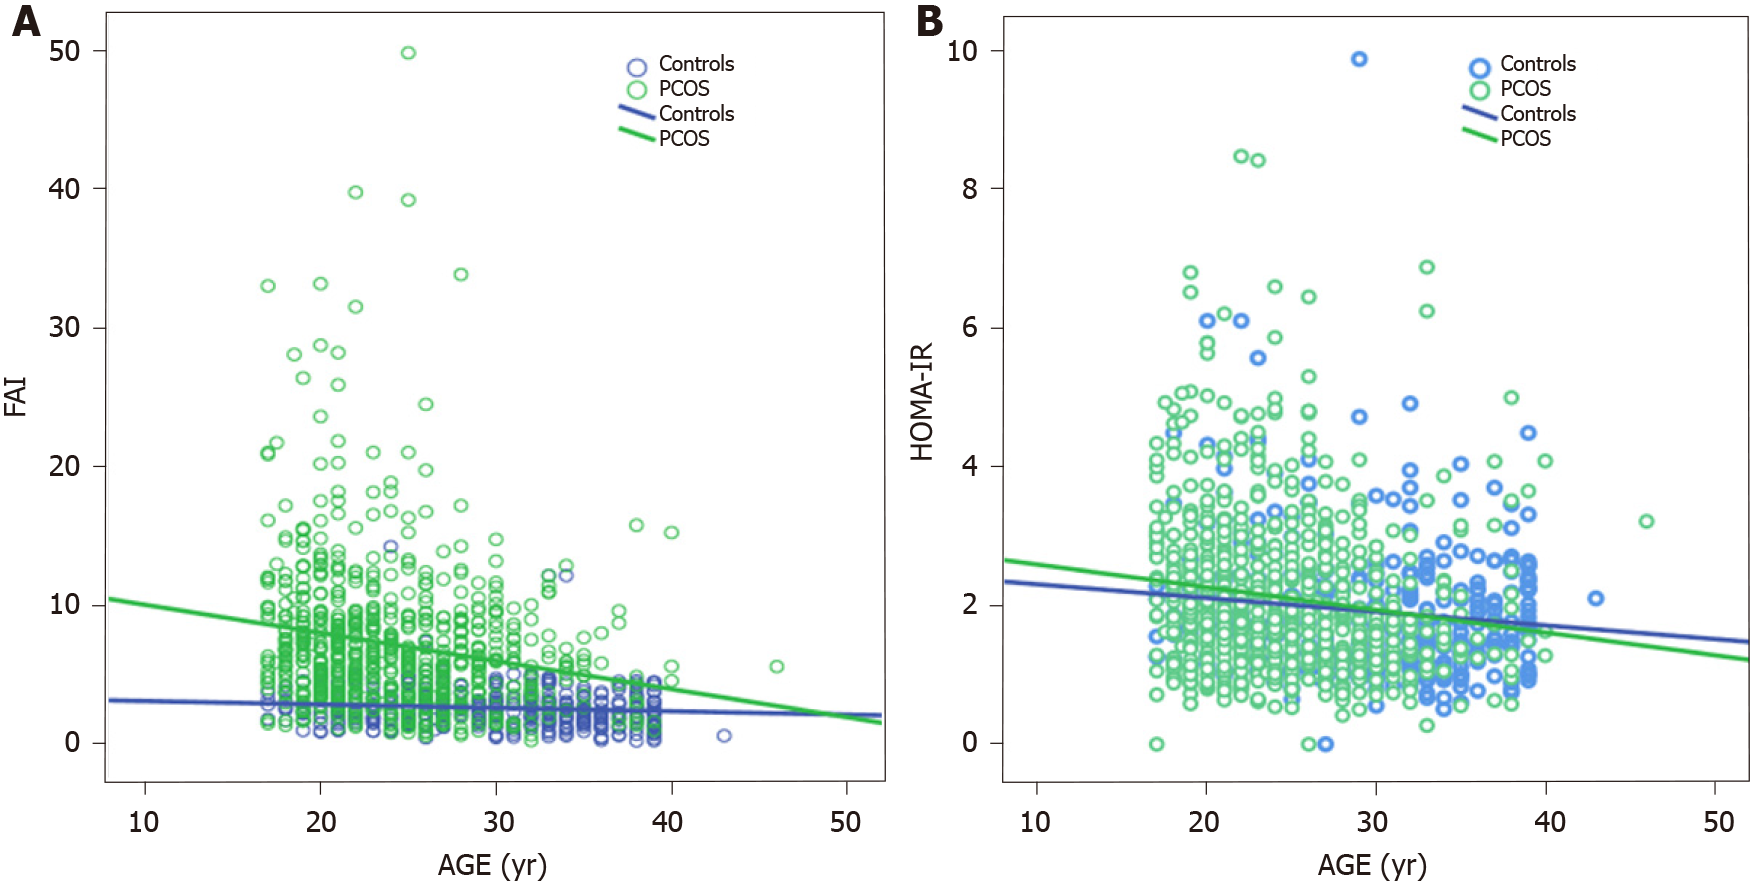
Figure 2 The gradual decrease of homeostatic model assessment for insulin resistance and free androgen index in normal weight women with polycystic ovary syndrome, compared with controls.
Adapted from[53]. A: Free androgen index; B: Homeostatic model assessment for insulin resistance. PCOS: Polycystic ovary syndrome; FAI: Free androgen index; HOMA-IR: Homeostatic model assessment for insulin resistance.
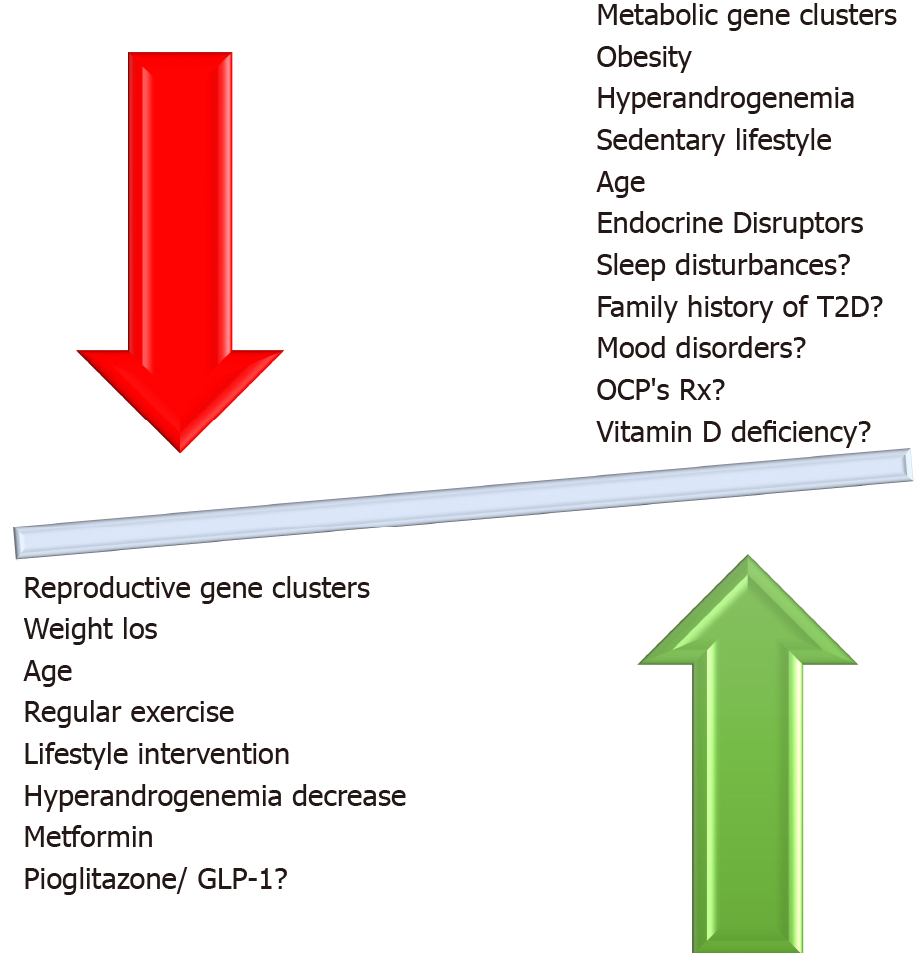
Figure 3 The interaction of positive (green arrow) and negative (red arrow) factors affecting dysglycemia in women with polycystic ovary syndrome.
T2D: Type 2 diabetes mellitus; GLP-1: Glucagon-like peptide 1.
- Citation: Livadas S, Anagnostis P, Bosdou JK, Bantouna D, Paparodis R. Polycystic ovary syndrome and type 2 diabetes mellitus: A state-of-the-art review. World J Diabetes 2022; 13(1): 5-26
- URL: https://www.wjgnet.com/1948-9358/full/v13/i1/5.htm
- DOI: https://dx.doi.org/10.4239/wjd.v13.i1.5


