Copyright
©The Author(s) 2021.
World J Diabetes. Apr 15, 2021; 12(4): 306-330
Published online Apr 15, 2021. doi: 10.4239/wjd.v12.i4.306
Published online Apr 15, 2021. doi: 10.4239/wjd.v12.i4.306
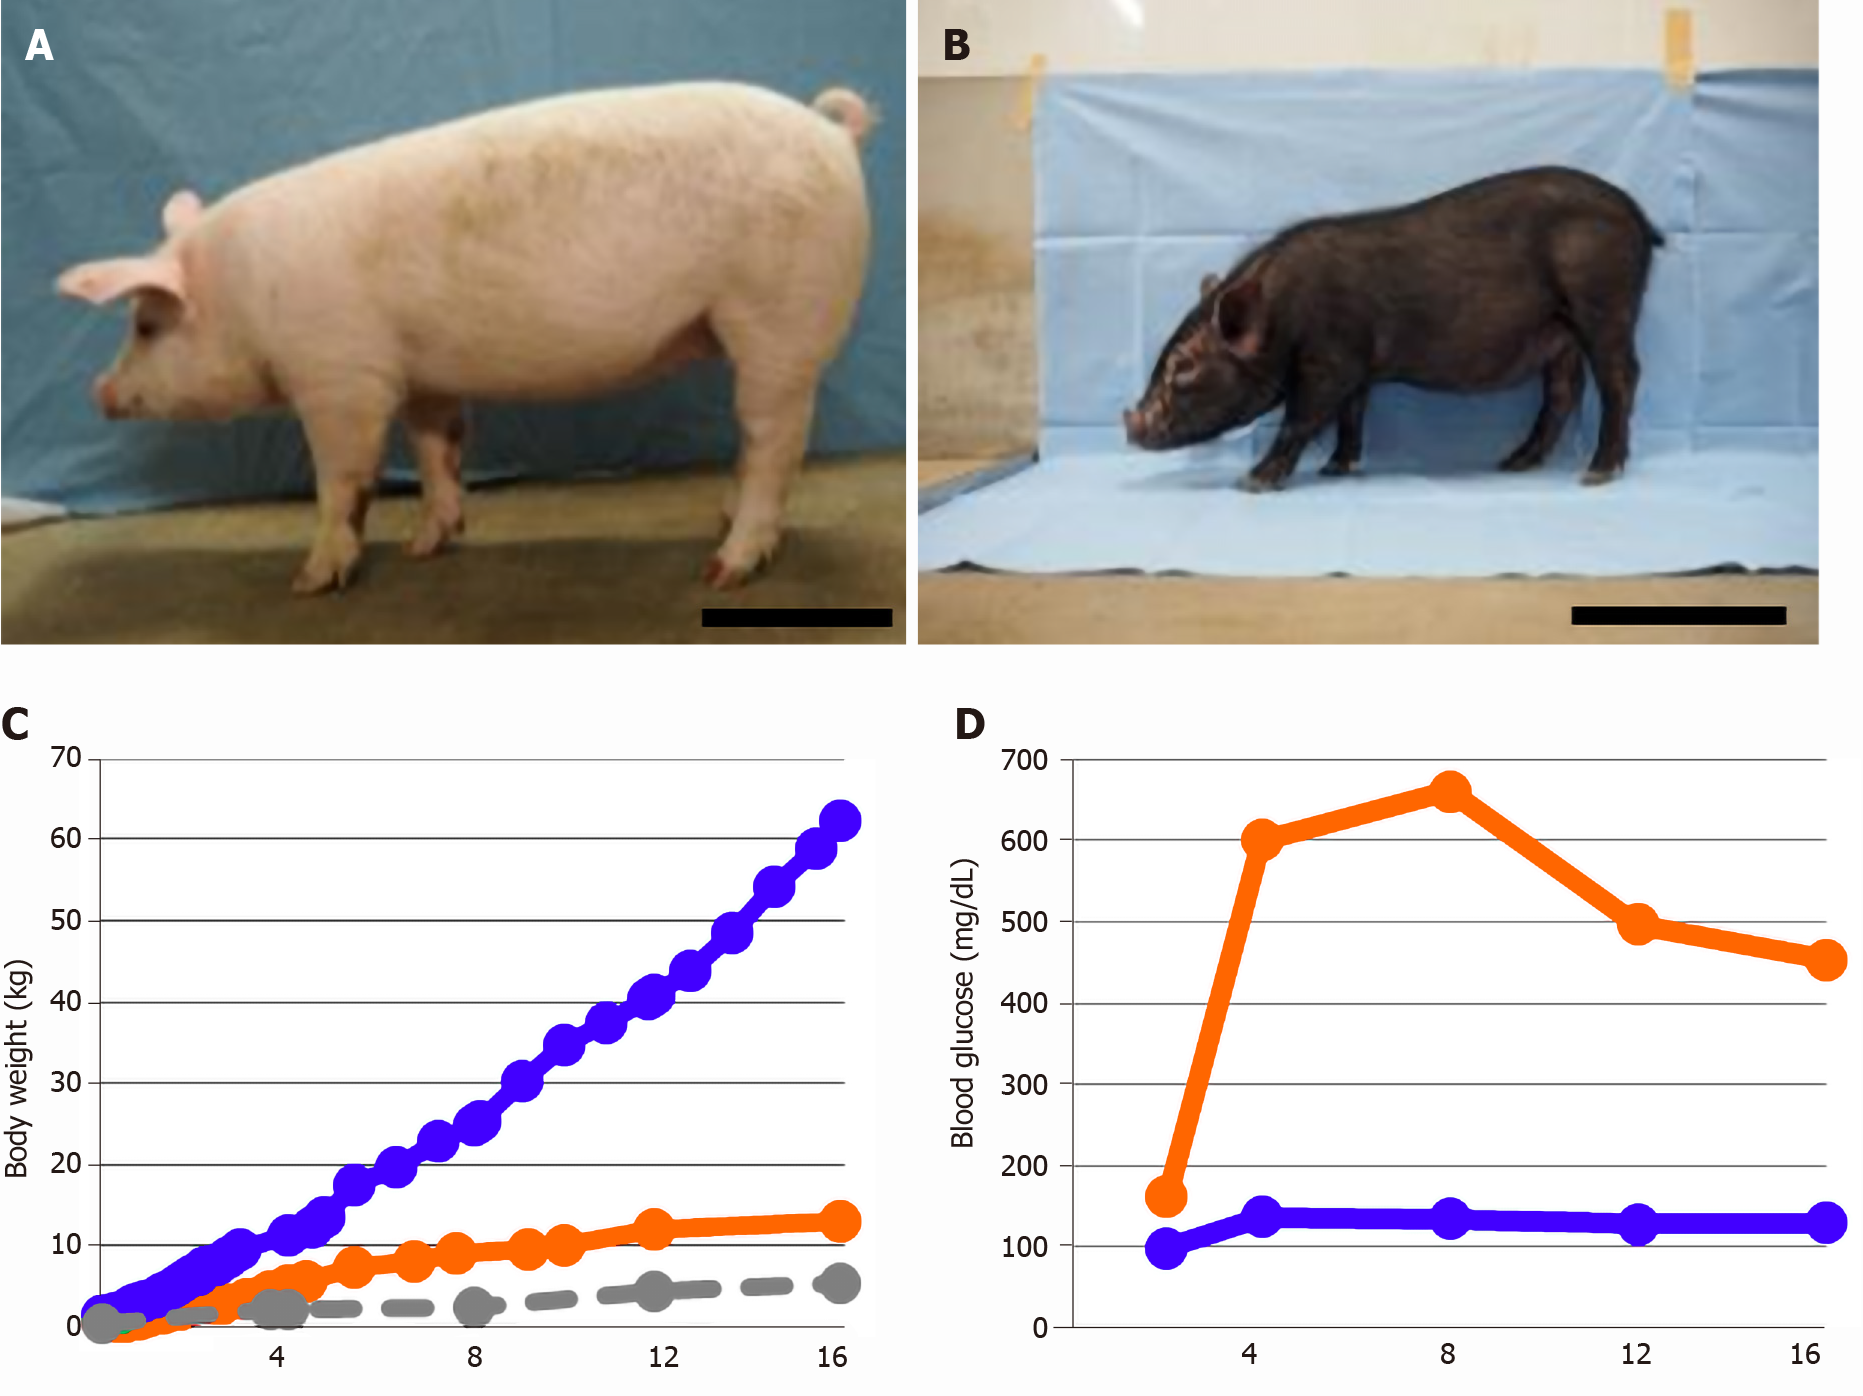
Figure 1 Generation of transgenic-mini pigs carrying a dominant-negative mutant HNF1α gene.
A: Common domestic pig; B: Transgenic (Tg)-mini pigs carrying a dominant-negative mutant HNF1α gene; C: Body weights at specified times; D: Blood glucose level. Blue line: Common domestic pigs, n = 2-4. Orange line: Tg-mini pig, n = 1. Gray line: micro-mini pig, n = 2-4. Quantitative data are presented as means. Scale bar: 30 cm. Time after birth is indicated in days.
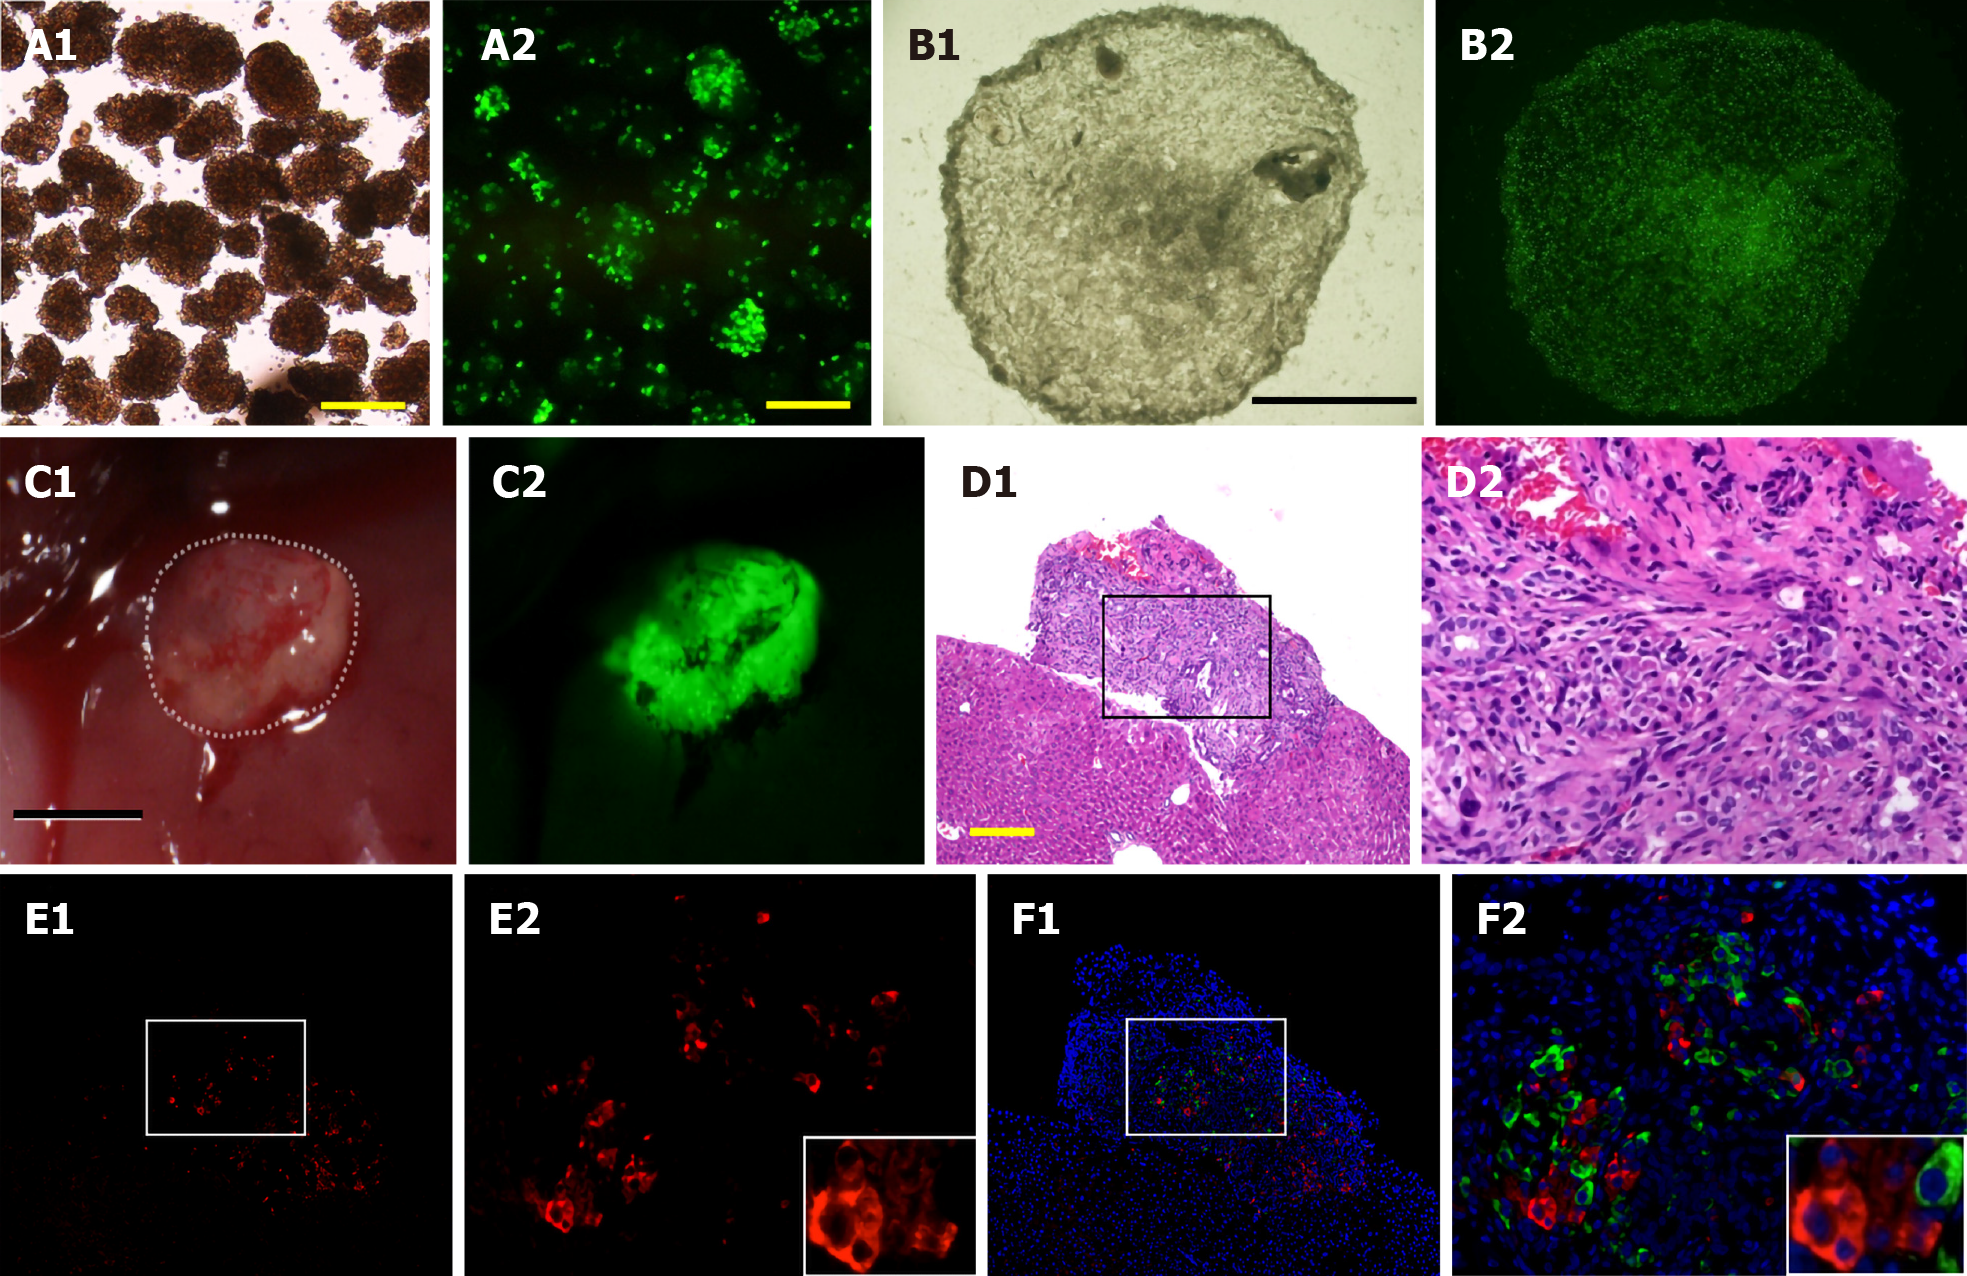
Figure 2 The engineered islet cell sheets.
A: Isolated pancreatic islets from a PDX1-Venus transgenic pig. Bright-field image of isolated islets (A1). Fluorescence microscopic image of the islets (A2). The PDX1-Venus transgenic (Tg) pig expresses green fluorescent protein specifically from the β-cells. The PDX1 gene promoter was conjugated to Venus, a green fluorescent protein. The isolated islets strongly emit green fluorescence in their nuclei; B: Islet cell sheets that were generated in vitro by seeding dispersed primary islets cells from a PDX1-Venus Tg pig into temperature-responsive 24-well culture plates covered with laminin. Bright-field image of the islet cell sheet (B1). Fluorescence microscopy image of the islet cell sheet (B2); C: The islet cell sheet was harvested 3 d after plating and transplanted onto the liver of streptozotocin-induced diabetic severe combined immunodeficiency mice. Bright-field microscopy. The sheet attached to the liver of diabetic mice (C1). The sheet emitted green fluorescence (C2); D-F: Immunohistochemical analysis of the transplanted islet cell sheet. Hematoxylin–eosin (HE) staining of the sheet on day 23 (D1 and D2). Immunofluorescence analysis of transplanted islet cell sheets (E1, E2, F1 and F2). Glucagon-positive cells (cytoplasm; green) and merged images (insulin-positive cells, cytoplasm; red) (F1 and F2). (D2), (E2), and (F2) present higher magnification images of the region indicated by a square in the panels (D1), (E1), and (F1), respectively. Nuclei were stained blue with DAPI (4,6-diamidino-2-phenylindole). Scale bars: yellow, 200 μm; black, 5 mm. The time after transplantation is indicated in days.
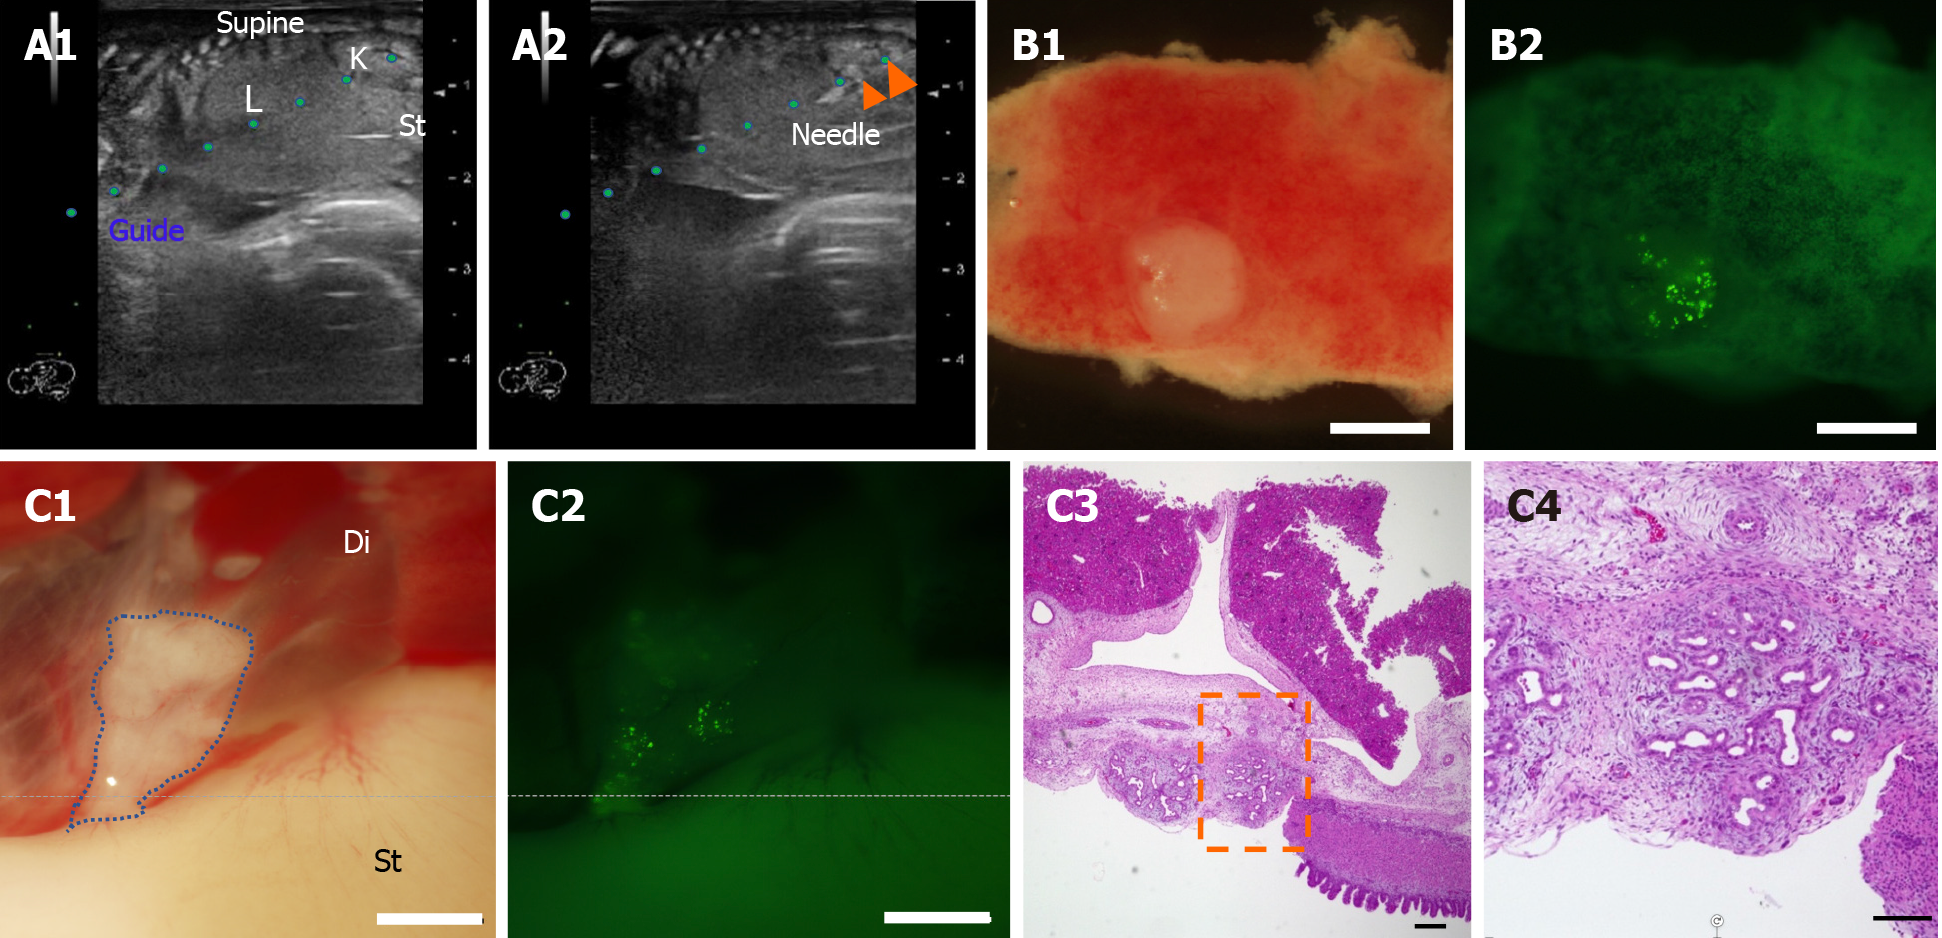
Figure 3 Ultrasound-guided fetal pancreatic tissue injection into a porcine fetus with organ niche.
A: The pancreas was harvested from the 40-d-old PDX1-Venus transgenic-pig fetus and minced. The minced-fetal pancreas was injected, under ultrasonographic guidance, through the uterine wall into the peritoneal cavity of a 40-d-old pig fetus. Peritoneal cavity of a 40-d-old pig fetus and a guide for the needle (A1). The needle was inserted into the omental foramen, and the minced-fetal pancreas was injected (A2); B: The minced-fetal pancreas was attached to the liver on day 14 (B1) and emitted green fluorescence (B2); C: The minced-fetal pancreas was attached under the diaphragm on day 14 (C1) and emitted green fluorescence (C2). Hematoxylin–eosin staining of the pancreas on day 14 (C3 and C4). The transplanted cells survived, and histological analyses confirmed the progressive development of the pancreatic ductal structures. (C4) comprises a higher magnification image of the region indicated by a black square in panel (C3). The time after birth is indicated in days. Scale bars: white, 1 mm; black, 5 µm. L: Liver; K: Kidney; St: Stomach; Di: Diaphragm.
- Citation: Nagaya M, Hasegawa K, Uchikura A, Nakano K, Watanabe M, Umeyama K, Matsunari H, Osafune K, Kobayashi E, Nakauchi H, Nagashima H. Feasibility of large experimental animal models in testing novel therapeutic strategies for diabetes. World J Diabetes 2021; 12(4): 306-330
- URL: https://www.wjgnet.com/1948-9358/full/v12/i4/306.htm
- DOI: https://dx.doi.org/10.4239/wjd.v12.i4.306


